This is a preprint of a paper intended for publication in a journal or proceedings. Since changes may not be made before publication, this preprint should not be cited or reproduced without permission of the author. This document was prepared as an account of work sponsored by an agency of the United States Government. Neither the United States Government nor any agency thereof, or any of their employees, makes any warranty, expressed or implied, or assumes any legal liability or responsibility for any third party’s use, or the results of such use, of any information, apparatus, product or process disclosed in this report, or represents that its use by such third party would not infringe privately owned rights. The views expressed in this paper are not necessarily those of the United States Government or the sponsoring agency.
INL/EXT-05-00398 PREPRINT
Comparison Of A
One-Dimensional Model Of A
High-Temperature
Solid-Oxide Electrolysis Stack
With CFD And
Experimental Results
2005 ASME International Mechanical
Engineering Congress And Exposition
J. E. O’Brien
C. M. Stoots
G. L. Hawkes
November 2005
Proceedings of IMECE2005 2005 ASME International Mechanical Engineering Congress and Exposition November 5-11, 2005, Orlando, Florida USA
IMECE2005-81921
Comparison of a One-Dimensional Model of a High-Temperature Solid-Oxide
Electrolysis Stack with CFD and Experimental Results
J. E. O’Brien, C. M. Stoots, and G. L. Hawkes Idaho National Laboratory
Idaho Falls, ID 83415, USA;[email protected]
ABSTRACT
A one-dimensional model has been developed to predict the thermal and electrochemical behavior of a high-temperature steam electrolysis stack. This electrolyzer model allows for the determination of the average Nernst potential, cell operating voltage, gas outlet temperatures, and electrolyzer efficiency for any specified inlet gas flow rates, current density, cell active area, and external heat loss or gain. The model includes a temperature-dependent area-specific resistance (ASR) that accounts for the significant increase in electrolyte ionic conductivity that occurs with increasing temperature. Model predictions are shown to compare favorably with results obtained from a fully 3-D computational fluid dynamics model. The one-dimensional model was also employed to demonstrate the expected trends in electrolyzer performance over a range of operating conditions including isothermal, adiabatic, constant steam utilization, constant flow rate, and the effects of operating temperature.
INTRODUCTION
A research program is under way at the Idaho National Laboratory to assess the performance of solid-oxide cells operating in the steam electrolysis mode for hydrogen production over a temperature range of 800 to 900ºC. The research program includes both experimental and modeling activities. Experimental activities, including both single button-cell testing and stack testing have been documented in several recent publications [e.g., 1-3]. The modeling activities include detailed computational fluid dynamics (CFD) simulations [4] and system-level modeling.
In order to evaluate the potential hydrogen-production performance of large-scale high-temperature electrolysis (HTE) operations, we have developed an engineering process model at INL using the commercial system-analysis code HYSYS. Using this code, several detailed process flow sheets have been defined that include all of the components that would be present in an actual HTE plant such as pumps, compressors, heat exchangers, turbines, and the electrolyzer. Since the
electrolyzer is not a standard HYSYS component, a custom one-dimensional electrolyzer model was developed for incorporation into the overall process flow sheet. This electrolyzer model allows for the determination of the average Nernst potential, cell operating voltage, gas outlet temperatures, and electrolyzer efficiency for any specified inlet steam, hydrogen, and sweep-gas flow rates, current density, cell active area, and external heat loss or gain. The one-dimensional electrolyzer model was validated by comparison with results obtained from a fully 3-D computational fluid dynamics model and by comparison with experimental results. This paper provides details on the one-dimensional electrolyzer model, comparisons to CFD and experimental results, and electrolyzer performance predictions based on the one-dimensional model over a range of operating conditions.
NOMENCLATURE
Acell per-cell active area, cm2
ASR area-specific resistance, Ohm cm2
F Faraday number, 96487 J/V mol
) (T GR
' Gibbs energy of reaction, J/mol
o i i T H
H( ) sensible enthalpy, J/mol
i o f
H
' enthalpy of formation, J/mol
i current density, A/cm2
current, A
LHV low heating value of hydrogen, J/mol
i
N molar flow rate, mol/s
Ncells total number of electrolysis cells
Q heat transfer rate to electrolyzer, W
R universal gas constant, J/mol K
T temperature, K
V voltage, V
W electrical work performed on electrolyzer, W
y mole fraction
ONE-DIMENSIONAL ELECTROLYZER MODEL
In general, for an operating electrolysis stack, there will be a temperature change associated with the electrolysis process. For these cases, the energy equation for electrolysis process can be written as:
¦
' P o i P i o f i H H T H N W Q i ( ) ] [¦
' R o i R i o f i H H T H N [ i ( ) ] (1)where Q is the external heat transfer rate to or from the
electrolyzer, W is the rate of electrical work supplied to the
electrolyzer, Niis the molar flow rate of each reactant or
product,
i o f
H
' is the standard-state enthalpy of formation of
each reactant or product and o
i i T H
H( ) is the sensible
enthalpy for each reactant or product. Applying the energy equation in this form, all reacting and non-reacting species included in the inlet and outlet streams can be accounted for, including inert gases, inlet hydrogen (introduced to maintain reducing conditions on the steam/hydrogen electrode), and any excess unreacted steam. In general, determination of the outlet temperature from Eqn. (1) is an iterative process. The heat transferred during the process must first be specified (e.g., zero for the adiabatic case). The temperature-dependent enthalpy values of all species must be available from curve fits or some other data base. The solution procedure begins with specification of the cathode-side inlet flow rates of steam, hydrogen, and any inert carrier gas such as nitrogen (if applicable). The inlet flow rate of the sweep gas (e.g., air or steam) on the anode side must also be specified. Specification of the gas flow rates allows for the determination of the inlet mole fractions of steam, hydrogen, and oxygen that appear in the Nernst equation. The steam mole fraction is expressed in terms of the hydrogen mole fraction as 1-yH2-yN2.
The current density and active cell area are then specified, yielding the total operating current. Care must be taken to insure that the specified inlet gas flow rates and total cell current are compatible. The minimum required inlet steam molar flow rate is the same as the steam consumption rate, given by: 2 2 min , 2 , 2 2 cells H cell cells O H O H i N N F A i N F I N N ' ' (2)
which is of course also equal to the hydrogen production rate. Once the total and per-cell hydrogen production rates are known, the outlet flow rates of hydrogen and steam on the cathode side and oxygen on the anode side can be determined. The flow rates of any inert gases, the anode-side sweep gas, and any excess steam or hydrogen are the same at the inlet and the outlet. Once all these flow rates are known, the summations in Eqn. (1) can be evaluated. The product summation must be evaluated initially at a guessed value of the product temperature, TP.
The operating voltage corresponding to the specified current density is obtained from:
) (T ASR i V Vop Nernst u (3)
where the stack area-specific resistance, ASR(T), must be
estimated and specified as a function of temperature. The cell-mean Nernst potential can then be obtained from an integrated Nernst equation: u )( )( ) ( 2 1 , , , , , , , ,O2A iO2A oH2C iH2C o R P Nernst y y y y T T F V
³
³
³
¸¸ ¹ · ¨ ¨ © § ' P R A O o A O i C H o C H i T T y y y y H O H O N H R dy dy dT y y y y RT T G , 2 , , 2 , , 2 , , 2 , 2 2 2 2 2 2 2 / 1 1 ln ) ( (4)where yi, O2, A is the anode-side inlet mole fraction of oxygen,
etc. Note that the upper limit of integration on the temperature integral,TP, is initially unknown. Once the ASR and the mean
Nernst potential are known, the operating voltage is obtained from Eqn. (3) and the electrical work term in Eqn. (1) is
obtained from W VopI. An algorithm then must be
developed to iteratively solve for the product temperature, TP,
in order to satisfy Eqn. (1). This algorithm can then be imbedded in a loop so that a full numerical “sweep” can be performed. We have implemented this procedure in MathCad. The MathCad model provides accurate estimates of electrolyzer operating voltage (and corresponding electrolyzer efficiency) and outlet temperatures, for any specified electrolyzer heat loss or gain, gas flow rates, current density, and per-cell ASR(T). This electrolyzer model was developed for incorporation into system-level electrolysis plant models being developed using HYSYS system simulation software. With a realistic electrolyzer model incorporated into the overall HYSYS plant model, good estimates of overall hydrogen-production efficiencies can be obtained over a wide range of prospective operating conditions.
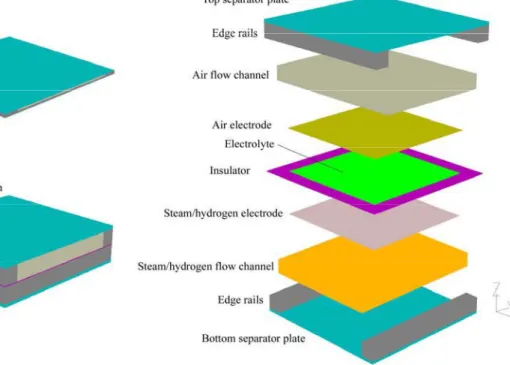
Predictions obtained from the 1-D integral model have been compared to results obtained from a fully 3-D FLUENT simulation. Complete details of the FLUENT electrolysis stack model are provided in [4]. A condensed description is presented here. The numerical model developed for this paper was based on the geometry of a single solid-oxide electrolysis cell (SOEC) taken from a planar stack described in detail in [1, 2]. The numerical domain extends from the center plane of one separator plate to the center plane of the next separator plate. Symmetry boundaries are applied at the top and bottom of the model. Three representations of the numerical model are presented in Fig. 1. In the top left portion of this figure, the full model is shown to scale. Since the model includes only one cell, the model geometry is quite thin in the vertical (z) direction. To show more detail, the model is shown in the bottom left portion of Fig. 1 with a vertical exaggeration of 10× in the z-direction. An exploded view with the 10× vertical exaggeration is shown in the right half of the figure.
In the exploded view, the bottom element is the bottom separator plate. Since we are trying to represent a unit cell extracted from a larger stack, the bottom and top separator plates in the numerical model are only half as thick (i.e., 0.19 mm) as the hardware separator plates. Therefore, the top and bottom boundaries of the numerical model represent symmetry planes and the boundary conditions on those faces are set accordingly. The edge rails are shown attached to the bottom separator plate. In the stack hardware, the edge rails are
fabricated from the same material as the separator plates, but they are separate pieces.
The next element in the numerical model is the steam/hydrogen flow channel. The flow channels are the regions in the stack between the separator plate, the edge rails and the electrodes in which the corrugated/perforated “flow fields” are located. In the FLUENT model, the steam/hydrogen flow channel has been specified as a high-porosity porous-media region with metallic nickel as the solid material and with anisotropic permeability, much higher in the primary flow direction than in the cross flow directions. The height of the flow channel is set by the thickness of the edge rails, 1.019 mm.
The next three layers in the numerical model are associated with the electrolyte/electrode assembly, as shown in the right half of Fig. 1. The FLUENT solid-oxide fuel cell (SOFC) module treats the electrolyte as a 2-D planar element with the properties of yttria-stabilized zirconia (YSZ). Therefore the electrolyte in the model has geometrical thickness of zero. On either side of the electrolyte are the electrodes which are created with 3-D elements. Therefore, the electrolyte/electrode assembly in the model is only as thick as the two electrodes. Around the outer periphery of the electrolyte/electrode assembly, we have included an “insulator” with the properties of YSZ. The insulator prevents an electrical short circuit between the top and bottom edge rails. No ionic transport occurs through this insulator.
The next element in the numerical model is the air/oxygen flow channel. It has also been specified as a high-porosity porous media region with ferritic stainless steel as the solid material and with the same anisotropic permeabilities and flow channel height used in the steam/hydrogen flow channel. The top separator plate and edge rails are identical to those on the bottom, but the edge rails are oriented perpendicular to the bottom edge rails to allow for the cross-flow arrangement. The bottom separator plate in the FLUENT model serves as the
electrical ground and the top separator plate serves as the current source.
Additional parameters specified in the numerical model include the electrode exchange current densities and several gap electrical contact resistances. These quantities were determined empirically by comparing FLUENT predictions with stack performance data. The FLUENT model uses the electrode exchange current densities to quantify the magnitude of the activation overpotentials via a Butler-Volmer equation [5].
The gas flow inlets are specified in the FLUENT model as mass-flow inlets, with the gas inlet temperatures are set at 1103 K and the inlet gas composition determined by specification of the mass fraction of each component. The gas flow rates used in the model were the same as those used for the experimental base case, on a per-cell basis. For example, the base case for the steam/hydrogen inlet used a total inlet mass flow rate of
8.053×10⁻⁶ kg/s, with nitrogen, hydrogen and steam mass
fractions of 0.51, 0.0074, and 0.483, respectively. The base case air flow rate was 4.33×10⁻⁶ kg/s.
Details of the core mass, momentum, energy, and species conservation and transport features of FLUENT are documented in detail in the FLUENT user manual (FLUENT, 2004). An SOFC model adds the electrochemical reactions, loss mechanisms, electric field computation, and electrode porous media constitutive relations (Prinkey et al., 2004). This reference also documents the treatment of species and energy sources and sinks arising from the electrochemistry at the electrode-electrolyte interfaces. The FLUENT SOFC user-defined subroutine was modified for our HTE work to allow for operation in the SOEC mode. Model results provide detailed profiles of temperature, Nernst potential, operating potential, anode-side gas composition, cathode-side gas composition, current density and hydrogen production over a range of stack operating conditions.
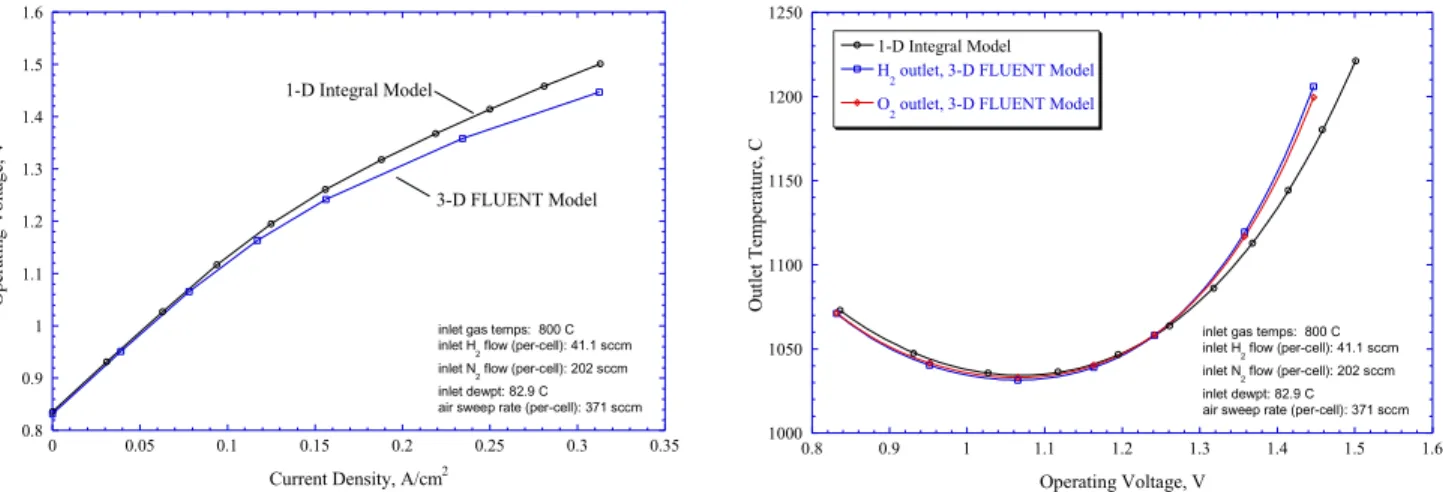
Representative results obtained from the integral electrolyzer model for an adiabatic case are presented in Fig. 2, along with results obtained from FLUENT. Fig. 2 shows predicted voltage-current characteristics and predicted gas outlet temperatures. The 1-D integral model predicts somewhat higher operating voltages compared to the FLUENT results. This makes the 1-D model conservative since higher operating voltages correspond to lower electrolysis efficiencies. The disparity can be explained by noting that the CFD model can more accurately account for the variation in local Nernst potential and local current density associated with the cross-flow geometry of the planar stack. Note that, for an operating voltage near the thermal minimum (~1.06 V), both models predict outlet temperatures for this particular adiabatic case that are about 30ºC lower than the inlet temperatures. This temperature depression is due to the fact that the endothermic heat requirement of the steam dissociation reaction is larger than the ohmic heating in the operating voltage range between open-cell potential and the thermal-neutral voltage. Per-cell gas flow rates for this case were based on the flow rates used in recent planar HTE stack tests [1, 2]. The 1-D model also predicts the correct value of the thermal neutral voltage for 800ºC, 1.287 V. At this operating voltage, the outlet temperatures are equal to the inlet temperatures under adiabatic conditions. The 1-D model is also useful for assessing the effect of using a steam sweep rather than an air sweep on the oxygen side. Use of a sweep gas that does not contain oxygen is advantageous because it reduces the Nernst potential, thereby increasing the electrolysis efficiency for a specified current density. We are considering the use of steam for the sweep gas since it would be relatively easy to separate the steam from the produced oxygen by condensation. The produced oxygen then could be sold as a commodity. Incorporation of the 1-D model into our HYSYS system simulation will enable a broad range of parametric studies.
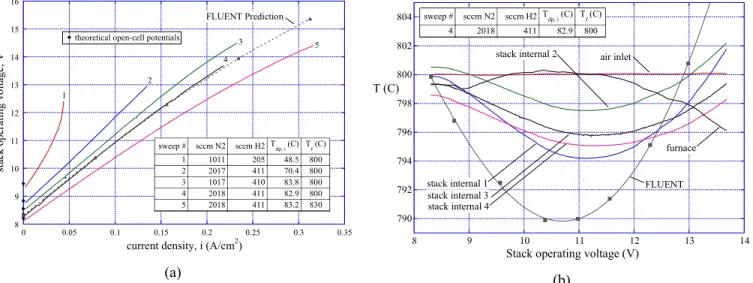
Results obtained from FLUENT were also compared to experimental results. Details of recent SOEC stack testing activities are presented in references [1, 2]. Only one set of representative results are shown here in Fig. 3. This figure shows experimentally measured voltage-current characteristics and internal stack temperatures obtained during a DC potential sweep, along with FLUENT predictions. The FLUENT model included empirical values for internal stack contact resistances,
scaled to match the measured voltage-current values of sweep 4 of Fig. 3 (a). Corresponding internal stack temperatures are shown in Fig. 3 (b). The experimental internal stack temperatures were obtained from four miniature (inconel-sheathed, 0.010-inch (250 µm) OD, mineral-insulated, ungrounded, type-K) thermocouples that were inserted into selected air-flow channels. The comparison between the experimentally obtained stack internal temperatures and the FLUENT mean electrolyte temperature is not perfect, primarily due to the fact that the sweeps were performed at a rate that was too fast to allow the stack to achieve thermal steady-state. Nevertheless, the trends are clearly shown. Future stack test objectives will include obtaining steady-state internal stack temperature data.
OVERALL PROCESS THERMAL-TO-HYDROGEN EFFICIENCY
In order to assess the overall hydrogen production efficiency of any large-scale water-splitting process, an appropriate process efficiency must be defined that can be applied to a variety of processes. The feedstock for any large-scale HTE process will be liquid water at ambient temperature and pressure, and the products will be hydrogen and oxygen, ultimately also at ambient temperature. The HTE process may occur at elevated pressure, so the products may also be delivered at elevated pressure. In order to maximize the overall process efficiency, it is essential to recuperate as much of the process heat as possible.
To compare the performance of an HTE process to alternate hydrogen production techniques, we have adopted a general efficiency definition that can be applied to any thermal water-splitting process, including HTE, low-temperature electrolysis (LTE), and thermochemical processes. Since the primary energy input to the thermochemical processes is in the form of heat, the appropriate general efficiency definition to be applied to all of the techniques is the overall
thermal-to-hydrogen efficiency, ȘH. This efficiency is defined as the
heating value of the produced hydrogen divided by the total thermal input required to produce it. Either the low heating value, LHV, or the high heating value, HHV, of the hydrogen can be used. From a process efficiency viewpoint, since the feedstock is liquid water, it makes sense to use the high heating value. From a utilization viewpoint, depending on the
0.8 0.9 1 1.1 1.2 1.3 1.4 1.5 1.6 0 0.05 0.1 0.15 0.2 0.25 0.3 0.35 Op er at in g V olt ag e, V
Current Density, A/cm2
1-D Integral Model
3-D FLUENT Model
inlet gas temps: 800 C inlet H
2 flow (per-cell): 41.1 sccm
inlet N
2 flow (per-cell): 202 sccm
inlet dewpt: 82.9 C air sweep rate (per-cell): 371 sccm
1000 1050 1100 1150 1200 1250 0.8 0.9 1 1.1 1.2 1.3 1.4 1.5 1.6 1-D Integral Model
H2 outlet, 3-D FLUENT Model O2 outlet, 3-D FLUENT Model
Ou tl et Te m pe ratur e, C Operating Voltage, V
inlet gas temps: 800 C inlet H
2 flow (per-cell): 41.1 sccm
inlet N
2 flow (per-cell): 202 sccm
inlet dewpt: 82.9 C air sweep rate (per-cell): 371 sccm
Figure 2. Predicted operating voltage and gas outlet temperatures for adiabatic electrolyzer operation; comparison of 1-D integral MathCad model with full 3-D FLUENT simulation.
application, it may make more sense to use the low heating value. We will use the low-heating-value definition in this paper:
¦
i i H Q LHVK
(5)The denominator in this efficiency definition quantifies all of the net thermal energy that is consumed in the process. Therefore, this summation includes any direct nuclear process heat as well as the thermal equivalent of any electrical work delivered to the process such as electrolyzer power, power input to components such as pumps, compressors, etc. The thermal equivalent of any electrical power consumed in the process is the power divided by the thermal efficiency of the power cycle. We are using an assumed power-cycle thermal efficiency of 45% for the comparisons made in this paper. An advanced power cycle driven by a high-temperature nuclear reactor should easily be able to achieve this thermal efficiency value [6]. For an electrolysis process, the primary contribution to the summation in the denominator of Eqn. (5) is the thermal equivalent of the electrical energy input to the electrolyzer. For a thermochemical process, the primary contribution to the summation in the denominator of Eqn. (5) is direct nuclear process heat. All other direct thermal inputs are also included. Direct thermal inputs include any net (not recuperated) heat required to heat the process streams up to the electrolyzer operating temperature and any direct heating of the electrolyzer itself required for isothermal operation.
The one-dimensional electrolyzer model includes two inlet streams, one for steam/hydrogen on the cathode side and the other for a sweep gas on the anode side. Possible sweep conditions considered in this study include air sweep, steam sweep, and no sweep. Any value of direct electrolyzer heat addition can also be input to the model. The heat addition cases of interest are adiabatic and isothermal. Zero heat addition corresponds to adiabatic cases. Since there is no sensible enthalpy change for the isothermal case, the magnitude of the
heat transfer required to achieve isothermal operation,Q(T), can be calculated directly from the following form of the first law: op R H H T IV N T Q( ) ' 2' ( ) (6)
and since the hydrogen production rate, 'NH2is equal to I/2F, and the thermal neutral voltage, Vtn = ǻHR(T)/2F,
) (
)
(T I Vtn Vop
Q (7)
Note that this result predicts positive heat transfer to the electrolyzer for operating voltages less than thermal neutral and negative heat transfer (i.e., heat rejection from the electrolyzer) for operating voltages greater than thermal neutral.
The outlet streams leave the electrolyzer at a temperature that is dependent on the total flow rate, the amount of heat addition (e.g., isothermal or adiabatic electrolysis) to the electrolyzer, and the operating voltage (e.g., see Fig. 2). The operating voltage also has a significant effect on the electrolysis efficiency. We can derive an expression for the hydrogen production efficiency as a function of the operating voltage for
an electrolysis process. For a control volume drawn only
around the electrolysis stack, with We=VI, inlet and outlet
streams at T, P, and using the enthalpy of reaction, ǻHR at the
operating temperature in the definition of an electrolyzer thermal-to-hydrogen efficiency, ȘH,e, direct application of the
first law yields:
R P op R e H H FV H ' ' ) 1 / 1 ( 2 , K K (8)
Therefore lower operating voltages always yield higher efficiencies. Low operating voltages can be achieved in practice, with reasonable current densities, only if the electrolyzer area-specific resistance is low. Note that at Vop =
Vtn, Eqn. (8) yields ȘH = ȘP. Operation at the thermal neutral
voltage yields the same overall hydrogen production efficiency
8 9 10 11 12 13 14 15 16 0 0.05 0.1 0.15 0.2 0.25 0.3 0.35 st ack op er at ing vo ltage , V
current density, i (A/cm2)
T f (C) T dp, i (C) sccm H2 sccm N2 sweep # 800 48.5 205 1011 1 800 70.4 411 2017 2 800 83.8 410 1017 3 800 82.9 411 2018 4 830 83.2 411 2018 5 1 2 3 4 5 theoretical open-cell potentials
FLUENT Prediction (a) 790 792 794 796 798 800 802 804 8 9 10 11 12 13 14 T (C)
Stack operating voltage (V) stack internal 1
stack internal 4 stack internal 3
stack internal 2 air inlet
furnace Tf (C) Tdp, i (C) sccm H2 sccm N2 sweep # 800 82.9 411 2018 4 FLUENT (b)
Figure 3. Experimentally measured operating voltages and gas outlet temperatures obtained during DC potential sweeps, with comparisons to FLUENT results.
as that of the power cycle. Letting Vop = Eo = ǻGR/2F, Eqn. (8) yields R P R R o e H H G H E ' ' ' ) 1 / 1 ( ) ( ,
K
K
(9)which is the overall efficiency corresponding to operation at the reference open-cell potential, Eo. This value is always higher
than the power-production thermal efficiency. The open-cell potential corresponding to the electrolyzer operating conditions, including temperature and gas partial pressures, is given by the Nernst equation: » » ¼ º « « ¬ ª ¸¸ ¹ · ¨¨ © § ¸¸ ¹ · ¨¨ © § 1/2 2 / 1 2 2 2 ln std O H O H u o oc P P y y y jF T R E V (10)
For a specified temperature, the open-cell potential can be significantly lower than Eo for high steam mole fraction, low
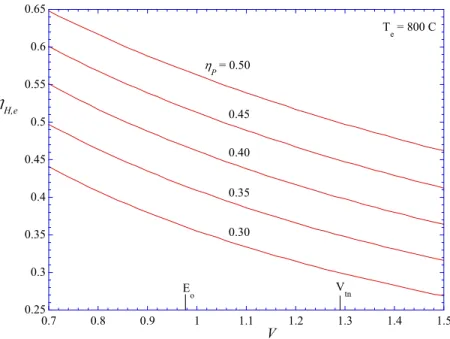
hydrogen mole fraction, low oxygen mole fraction, and low operating pressure. For electrolysis, it is desirable to have as low of a Nernst potential as possible, since the operating cell current density is proportional to the difference between the operating voltage and the Nernst potential. If the Nernst potential is low, a reasonable current density can be achieved with a low operating voltage, and therefore with high efficiency, according to Eqn. (8). The effect of operating potential on electrolyzer thermal-to-hydrogen efficiency is illustrated in Fig. 4. This figure shows a series of overall efficiency curves, over a range of assumed power-production efficiency values for an electrolysis temperature of 800ºC. Note that operating at any voltage lower than thermal neutral yields a hydrogen-production efficiency that is greater than the power-cycle thermal efficiency. On the steam/hydrogen side of the electrolysis cell, the use of high inlet steam mole fraction and a high total steam flow rate is desirable, subject to the constraint that a hydrogen content of 5 – 10% must be used in order to maintain reducing conditions on the steam/hydrogen
electrode. On the oxygen side, a low average oxygen mole fraction is desirable. Therefore, a non-oxygen-containing sweep gas should be considered with a high flow rate. This is why we are considering the use of steam as a sweep gas on the oxygen side of these cells. The steam can be separated from the oxygen later by a heat-recuperating condensation process, yielding a pure oxygen product at low temperature.
As an example HTE operating condition, assume T = 800ºC, P = 1 atm, yH2O = 0.95, yH2 = 0.05, yO2 = 0.05, ASR =
0.5 Ohm cm2, and Ș
P = 0.45. Under these conditions, the
Nernst potential is 0.772 V. If we wish to achieve a current density of 0.25 A/cm2, the required operating voltage would be
0.897 V, yielding an electrolyzer thermal-to-hydrogen production efficiency of 0.54 for the assumed power-production efficiency of 0.45. So, with favorable operating conditions, high-temperature electrolysis can yield overall hydrogen-production efficiencies that are higher than the power-cycle thermal efficiency. Furthermore, if the electrolysis process is powered by a high-efficiency advanced reactor/power cycle, overall thermal-to-hydrogen efficiencies greater than 50% can be achieved.
Conventional low-temperature electrolysis would correspond to a power-cycle efficiency around 35% and, due to lower open-cell potentials and higher overpotentials, a per-cell operating voltage in the 1.6 – 1.7 range, yielding overall thermal-to-hydrogen-production efficiencies of less than 35%.
It should be emphasized that this discussion of electrolyzer thermal-to-hydrogen efficiency based on Eqn. (8) and Fig. 4 does not consider the entire HTE system. The control volume for this discussion is drawn only around the electrolyzer and the inlet and outlet streams are assumed to be at the same high temperature (i.e., isothermal operation). No consideration of heat up of the process streams to the electrolyzer temperature is included. In fact, due to the relative heat capacity rates of the product gas streams and the liquid water inlet stream in the overall HTE system, net heat addition will always be required to supply at least some of the enthalpy of vaporization of the 0.25 0.3 0.35 0.4 0.45 0.5 0.55 0.6 0.65 0.7 0.8 0.9 1 1.1 1.2 1.3 1.4 1.5 KH,e V op 0.30 0.35 0.40 0.45 KP = 0.50 E o Te = 800 C Vtn
Figure 4. Electrolyzer thermal-to-hydrogen efficiencies as a function of power-cycle thermal efficiency and electrolyzer per-cell operating voltage.
liquid water and to boost the electrolyzer inlet stream (steam/hydrogen) to the desired stack inlet temperature (800-850ºC), so these efficiency values are optimistic. Nevertheless, this analysis provides guidance for optimizing the performance of the electrolyzer itself.
RESULTS OF PARAMETRIC STUDIES
The one-dimensional electrolyzer model was developed primarily for incorporation into a larger system-level HTE process model. But it is also useful as a stand-alone tool for evaluating electrolyzer performance under various operating conditions. A summary of the cases that have been studied is provided in Table 1. The second column in the table designates the sweep gas condition: air sweep, steam sweep, or no sweep. The third column specifies the electrolyzer thermal boundary condition: isothermal or adiabatic. For operating voltages between open-cell and thermal neutral, isothermal operation requires direct heating of the electrolyzer by some means. The fourth and fifth columns specify the total stack inlet flow rates
of fuel (composition fixed at 0.95 mole-fraction H2O, 0.05
mole-fraction H2) and sweep gas. The sixth and seventh
columns define the per-cell area-specific resistance (ASR) of the electrolyzer stack at a temperature of 1100 K. The ASR value used in the electrolyzer module was either fixed or temperature-dependent per the following Arrhenius equation:
¸¸ ¹ · ¨¨ © § u ) ( 10300 exp 10 973 . 3 463 . 0 ) ( 5 1100 T K ASR T ASR K (11)
where ASR1100K represents the user-specified cell ASR at the
temperature 1100 K. This constant allows one to shift the entire ASR curve to higher or lower ASR values, to mimic lower or higher performing cells, respectively. This equation for ASR(T) is based on empirical data obtained from an actual operating stack, modified to allow user specification of the ASR
value at 1100 K. The temperature dependence of the ASR is
important for analyzing adiabatic cases (since the outlet temperature in these cases is generally different than the inlet temperature) and for evaluating the effect of electrolyzer inlet
temperature on overall process efficiency. In order to show the trends that can be expected with higher or lower ASR, three
values of ASR1100K have been included in this study. The
ASR1100K value of 2.0 Ohm·cm2 represents a per-cell
stack-average ASR value at 1100 K that is achievable with existing
technology. The ASR1100K value of 1.0 should be achievable
with improvements in material and fabrication technology in the near term. The value of 0.5 is an optimistic value that has been observed in button cells, but will be difficult to achieve in a stack of this design (planar, with electrolyte-supported cells) in the short term. The final two columns in Table 1 define the stack inlet temperature and operating pressure.
Representative results obtained with the one-dimensional model are presented in Figs. 5 and 6. Electrolyzer gas outlet temperatures are plotted in Figure 5(a) as a function of operating voltage for adiabatic electrolyzer operation with various cell ASRs. For operating voltages between the open-cell potential and thermal neutral, the endothermic heat of reaction requirement is larger than the ohmic heating, resulting in an electrolyzer outlet temperature that is lower than the inlet. The thermal minimum voltage corresponding to the minimum outlet temperature is approximately 1.06 V. Lower ASR values tend to increase the magnitude of this temperature depression. For Case 2, the ASR is allowed to vary with temperature according to Eq. (13). Since the ASR value increases with decreasing temperature, this case shows a smaller outlet temperature depression than the comparable fixed ASR case (Case 1). All four temperature profiles return to the electrolyzer inlet temperature at the thermal neutral voltage (~1.285 V). Beyond the thermal neutral voltage, outlet temperatures increase rapidly, since the rate of ohmic heating now exceeds the endothermic heat requirement.
The per-cell heat requirement for isothermal electrolyzer operation is shown in Fig. 5(b) for several ASR values. For operating voltages less than thermal neutral, ohmic heating is insufficient to supply the endothermic heat of reaction and additional heat must be added to the electrolyzer (positive values) to supplement the ohmic heating. Maximum heat addition is required at the thermal minimum voltage (~1.06 V). Table 1. Matrix of test cases analyzed for a 10-cell, 64 cm2per-cell active area, stack. Inlet composition is 0.95
mole-fraction H2O, 0.05 mole-fraction H2 for all cases.
Case
# Sweep Gas Thermal BC Electrolyzer Fuel Mass Flow Rate (kg/hr)
Sweep Mass Flow Rate
(kg/hr)
ASR at
1100 K ASR Inlet (K) T Pressure (Pa)
1 steam adiabatic 0.1933 0.0562 0.5 fixed 1100 0.1×10⁶
2 steam adiabatic 0.1933 0.0562 0.5 variable 1100 0.1×10⁶
3 steam adiabatic 0.1933 0.0562 1.0 fixed 1100 0.1×10⁶
4 steam adiabatic 0.1933 0.0562 2.0 fixed 1100 0.1×10⁶
5 steam isothermal 0.1933 0.0562 0.5 fixed 1100 0.1×10⁶
6 steam isothermal 0.1933 0.0562 1.0 fixed 1100 0.1×10⁶
7 steam isothermal 0.1933 0.0562 2.0 fixed 1100 0.1×10⁶
8 air isothermal 0.1933 0.09005 0.5 fixed 1100 0.1×10⁶
9 none isothermal 0.1933 0.0 0.5 fixed 1100 0.1×10⁶
10 steam isothermal 0.1933 0.0562 0.5 fixed 1150 0.1×10⁶
11 steam isothermal 0.1933 0.0562 0.5 fixed 1200 0.1×10⁶
12 steam isothermal 0.1933 0.0562 0.5 fixed 1100 1×10⁶
13 steam isothermal 0.1933 0.0562 0.5 fixed 1100 5×10⁶
14 steam isothermal 0.9665 0.281 0.5 fixed 1100 0.1×10⁶
800 900 1000 1100 1200 1300 0.7 0.8 0.9 1 1.1 1.2 1.3 1.4
Case 1 (ASR = 0.5 ohm cm2)
Case 2 (ASR(T) = 0.5 ohm cm2 at 1100 K)
Case 3 (ASR = 1 ohm cm2)
Case 4 (ASR = 2 ohm cm2)
Te
mperature
(K)
Operating Voltage Per Cell (Volts) (a) -60 -40 -20 0 20 40 60 0.7 0.8 0.9 1 1.1 1.2 1.3 1.4 1.5
Case 5 (ASR = 0.5 ohm cm2)
Case 6 (ASR = 1 ohm cm2)
Case 7 (ASR = 2 ohm cm2)
Hea t Add ed Per Ce ll (W )
Operating Voltage Per Cell (Volts) (b)
Figure 5. (a) Electrolyzer outlet temperature versus operating voltage for adiabatic operation; (b) required heat addition for isothermal electrolyzer operation.
For operating voltages beyond thermal neutral, electrolyzer heat rejection is required to maintain isothermal conditions.
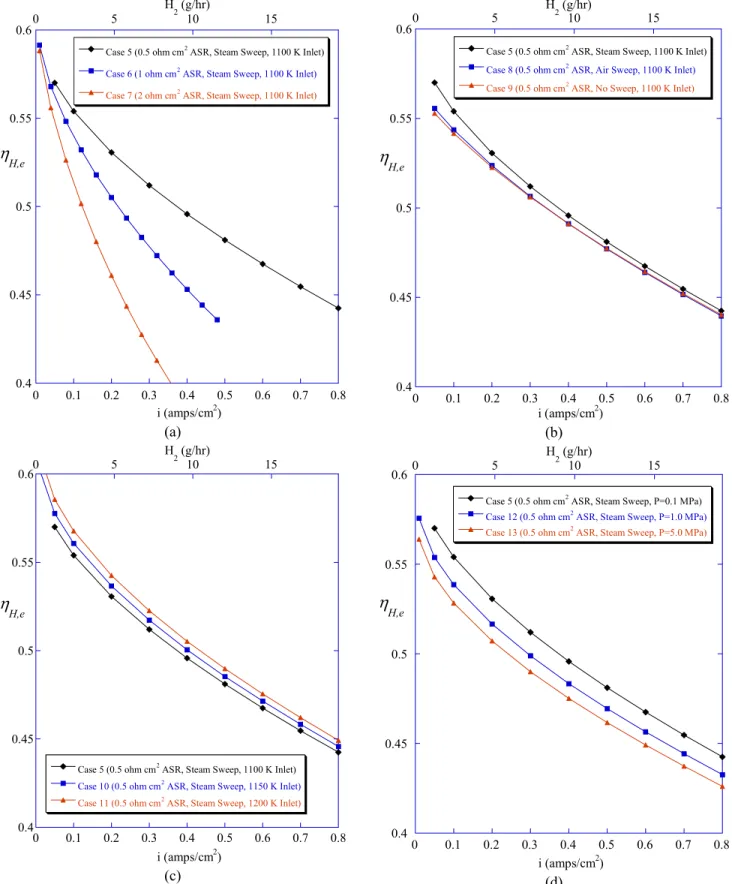
Fig. 6 depicts estimated electrolyzer thermal-to-hydrogen production efficiencies ȘH,e, defined in Eq. (8), for the various
isothermal cases listed in Table 1, as a function of current density. Each thermal-to-hydrogen efficiency value is based
upon the enthalpy of reaction ǻHR at the stack operating
temperature and the cell operating voltage corresponding to the current density shown, for a constant power-cycle efficiency ȘP
= 0.45. Figure 6(a) shows the decrease in hydrogen-production efficiency with increasing current density. In fact, peak thermal-to-hydrogen production efficiencies occur at zero current density – highest efficiencies are at the lowest production rates In addition, for a specified current density, the thermal-to-hydrogen production efficiency improves for lower ASR values.
Fig. 6(b) illustrates the effect of sweep gas upon hydrogen production efficiency. The mole-fraction or partial pressure of O2 on the sweep side of the electrolyzer cell affects the Nernst
potential, as can be seen in Eqn. (10). Minimizing the cell-mean oxygen partial pressure minimizes the Nernst potential. For a given ASR, the current density and hydrogen production rate is proportional to the difference between the operating voltage and the Nernst potential. Therefore, by minimizing the Nernst potential the required operating voltage for a given hydrogen production rate is minimized and production efficiency is increased.
In Figure 6(b), the no-sweep case (Case 9) shows the lowest thermal-to-hydrogen production efficiencies. In this case, the partial pressure of O2 is always 1. Efficiencies for the
air-sweep case (Case 8) show approximately the same values as for the no-sweep case, except at the lowest current densities. However, the steam sweep case (Case 5) shows improved performance. Incorporation of the electrolyzer model into the overall system model will allow us to determine whether these trends hold up for the system as a whole, considering heat recuperation issues.
Fig. 6(c) demonstrates the increase in overall thermal-to-hydrogen production efficiency with electrolyzer temperature for isothermal electrolyzer operation. Heat of reaction, gas
component thermal properties, Nernst voltage, ASR, and
power-cycle efficiency are all functions of temperature. For Cases 5,
10, and 11, ASR and power-cycle efficiency were held constant
at 0.5 ohm-cm2 and 0.45, respectively. Higher temperatures
reduce the amount of electrical energy required to break the chemical bonds in the water molecules. This results in a lower Nernst potential. Therefore, the minimum electrical energy demand for electrolysis decreases with increased temperature. The thermal energy requirement, however, increases with increasing temperature. As a result, the total energy demand,
ǻHR, increases very slightly with temperature. The advantage
of high-temperature operation lies with the substitution of electrical energy with thermal energy, yielding an overall efficiency gain. In fact, under favorable operating conditions, high-temperature electrolysis can yield overall hydrogen-production efficiencies that are significantly higher than the power-cycle thermal efficiency.
The effect of operating pressure upon electrolyzer thermal-to-hydrogen efficiency is reverse that of temperature, as shown in Fig. 6(d). Higher pressure operation increases the Nernst potential, and consequently the operating voltage required to produce a specified current density.
Increasing the flow rate of steam/hydrogen on the cathode side and sweep gas on the anode side of the electrolyzer results in reduced Nernst and operating potentials and correspondingly increased electrolysis efficiency. This effect is shown in Fig. 7. Using case 5 as a base case, efficiencies for flow rates corresponding to 5, 10, and 20 times the base flow are shown in the figure as a function of current density. The increased flow rates yield increased efficiencies of a few percentage points. From an overall system standpoint, however, this strategy would not be desirable since it would require recycling large amounts of excess steam and would also require large heat exchangers for recuperation.
CONCLUSIONS
A one-dimensional model has been created to study the thermal and electrochemical behavior of high temperature
steam electrolysis in a planar solid oxide electrolysis stack. Details of the model have been presented in this paper. The model allows determination of the average Nernst potential, cell operating voltage, gas outlet temperatures, extent of ohmic 0.4 0.45 0.5 0.55 0.6 0 0.1 0.2 0.3 0.4 0.5 0.6 0.7 0.8 0 5 10 15
Case 5 (0.5 ohm cm2 ASR, Steam Sweep, 1100 K Inlet)
Case 6 (1 ohm cm2 ASR, Steam Sweep, 1100 K Inlet)
Case 7 (2 ohm cm2 ASR, Steam Sweep, 1100 K Inlet)
i (amps/cm2) H2 (g/hr)
K
H,e (a) 0.4 0.45 0.5 0.55 0.6 0 0.1 0.2 0.3 0.4 0.5 0.6 0.7 0.8 0 5 10 15Case 5 (0.5 ohm cm2 ASR, Steam Sweep, 1100 K Inlet)
Case 8 (0.5 ohm cm2 ASR, Air Sweep, 1100 K Inlet)
Case 9 (0.5 ohm cm2 ASR, No Sweep, 1100 K Inlet)
i (amps/cm2) H2 (g/hr)
K
H,e (b) 0.4 0.45 0.5 0.55 0.6 0 0.1 0.2 0.3 0.4 0.5 0.6 0.7 0.8 0 5 10 15Case 5 (0.5 ohm cm2 ASR, Steam Sweep, 1100 K Inlet)
Case 10 (0.5 ohm cm2 ASR, Steam Sweep, 1150 K Inlet)
Case 11 (0.5 ohm cm2 ASR, Steam Sweep, 1200 K Inlet)
i (amps/cm2) H 2 (g/hr)
K
H,e (c) 0.4 0.45 0.5 0.55 0.6 0 0.1 0.2 0.3 0.4 0.5 0.6 0.7 0.8 0 5 10 15Case 5 (0.5 ohm cm2 ASR, Steam Sweep, P=0.1 MPa)
Case 12 (0.5 ohm cm2 ASR, Steam Sweep, P=1.0 MPa)
Case 13 (0.5 ohm cm2 ASR, Steam Sweep, P=5.0 MPa)
i (amps/cm2) H
2 (g/hr)
K
H,e(d)
Figure 6. Electrolyzer thermal-to-hydrogen efficiencies as a function of current density: effect of (a) ASR, (b) sweep gas, (c) operating temperature, and (d) operating pressure.
heating, and electrolyzer efficiency for any specified inlet gas flow rates, current densities, cell active area, and external heat loss or gain. The cell ASR is accounted for through a temperature-dependent correlation derived from empirical data from an actual operating electrolysis stack, allowing user specification of the ASR value at 1100 K.
Results from the one-dimensional model have been compared to results from a fully 3-D computational fluid dynamics model. The 1-D model correctly calculated the thermal neutral voltage. The 1-D model predicted slightly higher operating voltages compared to the CFD results, making the one-dimensional model conservative since higher operating voltages correspond to lower electrolysis efficiencies.
Parametric studies were conducted using the 1-D model to evaluate electrolyzer performance and efficiency under various operating conditions. Reducing the cell ASR as well as
reducing the sweep gas O2 partial pressure was shown to
increase electrolyzer efficiency. Electrolyzer efficiency was also improved for higher temperature operation and lower pressure operation. Under certain conditions, electrolyzer thermal-to-hydrogen production efficiency was shown capable of exceeding the electrical power cycle efficiency.
ACKNOWLEDGMENTS
This work was sponsored by the US Department of Energy, Office of Nuclear Energy, Science and Technology. Ceramatec, Inc. is participating through a subcontract with INEEL.
REFERENCES
1. O’Brien, J. E., Stoots, C. M., Herring, J. S., and Hartvigsen, J. J.,“Hydrogen Production Performance of a
10-Cell Planar Solid-Oxide Electrolysis Stack,” Proceedings, ASME 3rd International Conference on Fuel Cell Science, Engineering, and Technology, May 23 – 25, 2005, Ypsilanti, MI.
2. O’Brien, J. E., Herring, J. S., Stoots, C. M., Lessing, P. A., “High-Temperature Electrolysis for Hydrogen Production
From Nuclear Energy,” to be presented at the 11th
International Topical Meeting on Nuclear Reactor Thermal-Hydraulics NURETH-11, Popes Palace Conference Center, Avignon, France, October 2-6, 2005. 3. O’Brien, J. E., Stoots, C. M., Herring, J. S., Lessing, P. A.,
Hartvigsen, J. J., and Elangovan, S., “Performance Measurements of Solid-Oxide Electrolysis Cells for
Hydrogen Production from Nuclear Energy,” Journal of
Fuel Cell Science and Technology, Vol. 3, August 2005, pp. 72-82.
4. Hawkes, G. L., O’Brien, J. E., Stoots, C. M., Herring, J. S., Shahnam, M., “CFD Model of a Planar Solid Oxide Electrolysis Cell for Hydrogen Production from Nuclear Energy,” to be presented at the 11th International Topical Meeting on Nuclear Reactor Thermal-Hydraulics NURETH-11, Popes Palace Conference Center, Avignon, France, October 2-6, 2005.
5. Prinkey, M., Shahnam, M., and Rogers, W. A., “SOFC FLUENT Model Theory Guide and User Manual,” Release Version 1.0, FLUENT, Inc., 2004.
6. Yildiz, B., Hohnholt, K., and Kazimi, M. S., “H2
Production Using High Temperature Steam Electrolysis Supported by Advanced Gas Reactors with Supercritical
CO2 Cycles,” MIT-NES-TR-002, December 2004.
0.4 0.45 0.5 0.55 0.6 0 0.2 0.4 0.6 0.8 1 case 5, 1x flow case 14, 5x flow case 15, 10x flow case 16, 20x flow K H,e i, A/cm2
Figure 7. Effect of flow rates on electrolyzer thermal-to-hydrogen efficiencies.