MICROSTRUCTURAL EVOLUTION AND PHYSICAL
BEHAVIOR OF A LITHIUM DISILICATE GLASS-CERAMIC
Wen Lien
Submitted to the faculty of the University Graduate School in partial fulfillment of the requirements
for the degree Master of Science in the School of Dentistry,
Indiana University May 2014
Accepted by the Graduate Faculty, Indiana University, in partial fulfillment of the requirements for the degree of Master of Science.
Master’s Thesis Committee
Tien-Min G. Chu, D.D.S., Ph.D., Chair
Jeffrey A. Platt, D.D.S, M.S. John A. Levon, D.D.S, M.S. David T. Brown, D.D.S., M.S. Dong Xie, Ph.D.
ACKNOWLEDGEMENTS
I believe that God predestined everything, and none of us got to where we are today alone. Specifically, for the past 19 months, my training in the field of dental materials at the Indiana University, School of Dentistry, have been professionally very rewarding, and this thesis would not has been possible without the help, support, and patience of my thesis advisor, Professor Chu. Thank you, Dr. Chu, for allowing me the opportunity to work with you, for permitting me the freedom to express my own individuality, and for providing me a challenging environment to foster creative learning. I appreciate all your time, ideas, and teaching to make my learning experience stimulating. Most importantly, I thank you for your friendship!
Throughout my training, dozens of people have taught me immensely. My gratitude goes to Professor Platt; your dedication in dental materials and occasionally humorous musings bring me joy and inspire me to continue asking questions. Also, thank you, Professor Bottino, for your assistance in my research; your suggestions have been invaluable. Furthermore, on many occasions, your mere presence in the lab have saved me valuable time since I do not have a key and always require someone to open the lab door – or to the grad-student break room or to the printer room. To Mrs. Aranjo, thank you for the courtesies extended to me and for providing a warm and welcome atmosphere. In addition, I would like to thank my committee members, Professor Levon, Professor Brown, and Professor Xie, for reading and commenting on my thesis.
I am especially grateful for Colonel (Dr.) Roberts; the differential-scanning-calorimetry and x-ray diffraction parts of this thesis would not have been possible without the help from Dr. Roberts. Sir, thank you so much for “going above and beyond” to help me gather data for my thesis – I can't thank you enough for your willingness to support me. Also, I extend my sincerest
appreciations to my mentor and dear friend, Colonel (Dr.) Vandewalle, for all his guidance, professional support, and advice as well as friendship! Furthermore, I would like to thank Dr. You and Lieutenant Colonel (Dr.) Lincoln for their help on the scanning electron microscopy images.
I would also like to express my gratitude to Professor Jettpace for her wonderful help in proofreading my thesis.
With countless people teaching and helping me every step, a special group from the Air Force Research Laboratory's Materials and Manufacturing Directorate deserves singularly distinctive recognition. Thank you, Dr. Campbell, Dr. Ehlert, and Dr. Anderson for letting me use the nanoindenter – I will never forget your warm hospitality and generosity.
Unquestionably, throughout my life’s journey, I will be forever indebted to my wife, daughter, and parents for their love, support, and patience.
Last but not least, I’ve finally discovered – sadly wasn’t any sooner – that what really got me through the deepest and darkest times in my life journey was just a prayer away, for there is a lot of difference between just saying prayers and actually praying to God for a moment, and then, I would be in touch with Him all day.
Table of Contents
1.
Introduction ... 1
1.1.
Past and present of glass-ceramics ... 1
1.2.
Defining modern glass-ceramics ... 2
1.3.
Glass and glass-ceramic comparison ... 3
1.4.
Dental glass-ceramics ... 4
1.5.
Classification of dental glass-ceramics ... 5
1.6.
Microstructural phases ... 5
1.6.1.
The predominantly glass-based group ... 5
1.6.2.
The glassy-crystalline group ... 7
1.6.3.
The polycrystalline group ... 10
1.7.
Fabricating techniques ... 11
1.7.1.
Powder-liquid condensation ... 11
1.7.2.
Slip cast ... 12
1.7.3.
Heat-pressed ... 13
1.7.4.
Computer-Aided Design and Computer-Aided Manufacturing (CAD-CAM) ... 14
2.
Lithium disilicate glass-ceramics ... 15
2.1.
Background of lithium disilicate glass-ceramics ... 15
2.2.
Clinical performance of lithium disilicate glass-ceramics ... 15
2.3.
Materials science of lithium disilicate glass-ceramics ... 16
2.3.1.
Lithium disilicate glass-ceramics for dentistry ... 16
2.3.2.
The effect of thermal treatment on lithium dislicates ... 17
2.3.3.
CAD-CAM lithium disilicate glass-ceramics (IPS e.max® CAD) ... 18
2.3.4.
Current challenges ... 19
3.
Objectives and hypotheses ... 21
3.1.
Objectives ... 21
3.2.
Hypotheses ... 21
4.
Materials and methods ... 23
4.1.
Heating schedules ... 23
4.2.
Specimen preparation ... 24
4.3.
X-ray diffraction (XRD) ... 24
4.4.
Flexural strength ... 25
4.5.
Fracture toughness ... 26
4.6.
Nanoindentation ... 27
4.7.
Scanning electron microscopy (SEM) ... 28
4.8.
Differential scanning calorimetry (DSC) ... 29
4.9.
Statistical methods ... 30
5.
Results ... 32
5.1.
XRD patterns ... 32
5.1.1.
The not-fired, 530-590, 590-750, and 590-750 °C H14 groups ... 32
5.1.2.
The 750-780 °C group ... 33
5.1.3.
The 750-840, 820-840, and 820-840 °C (H14) groups ... 35
5.2.
Physical properties ... 36
5.2.1.
Flexural strength, flexural modulus, and fracture toughness ... 36
5.2.2.
Nanoindentation – elastic modulus ... 37
5.2.3.
Nanoindentation – hardness ... 38
5.3.
Microstructural evolution ... 39
5.4.
Non-isothermal kinetics for lithium disilicate crystallization ... 40
5.4.2.
Single-stage DSC heating curves ... 41
5.4.3.
Two-stage DSC heating curves ... 41
5.4.4.
Relationship between heating rates and exothermic peak temperatures ... 42
5.4.5.
Effective activation energy ... 43
6.
Discussion ... 44
6.1.
Assessment of our null and alternative hypotheses ... 44
6.2.
Relationship between heating schedules, microstructures, and physical properties ... 45
6.3.
Glass-ceramic’s crystalline-density-saturation-gradient composition and its hardness .. 47
6.4.
Comparison with past studies ... 50
6.5.
Future research ... 52
7.
Conclusions ... 54
8.
Tables ... 55
9.
Figures ... 61
10.
References ... 89
11.
Curriculum Vitae
List of Tables
Table 1: Two-stage heating schedules. ... 55
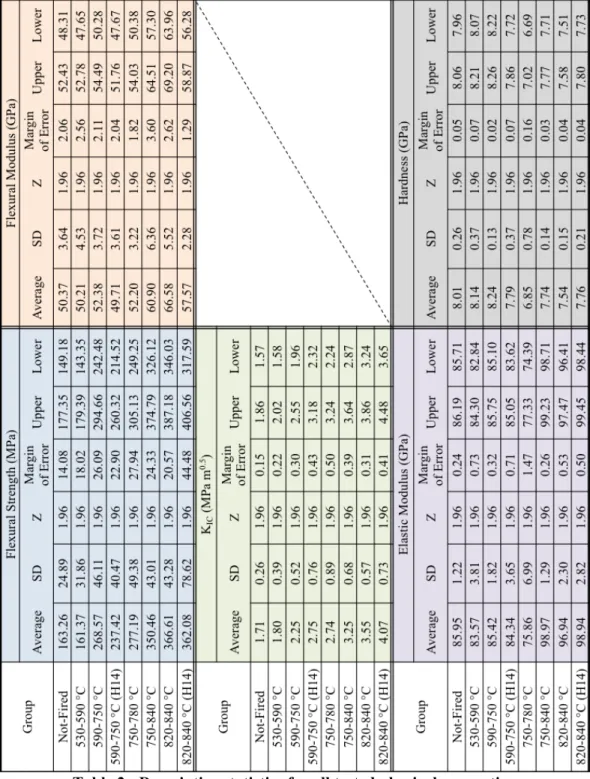
Table 2: Descriptive statistics for all tested physical properties. ... 56
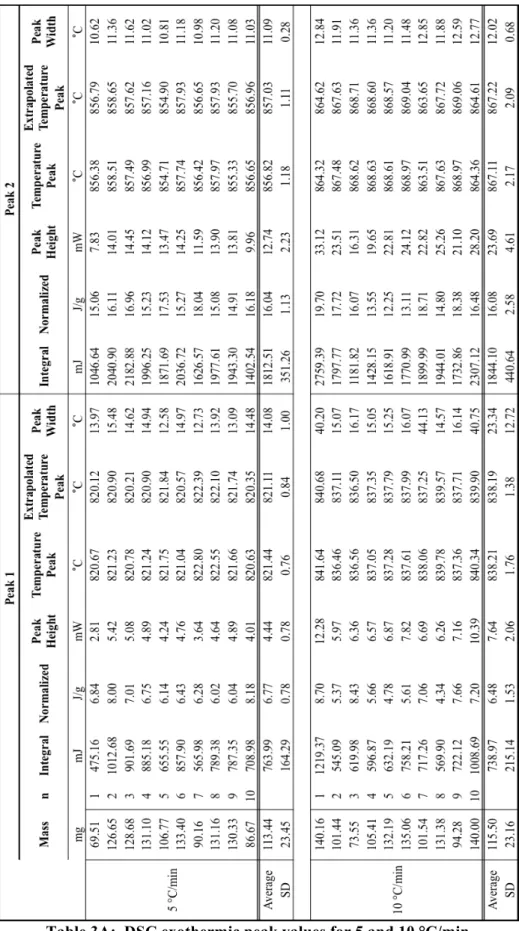
Table 3A: DSC exothermic peak values for 5 and 10 °C/min. ... 57
Table 3B: DSC exothermic peak values for 15 and 20 °C/min. ... 58
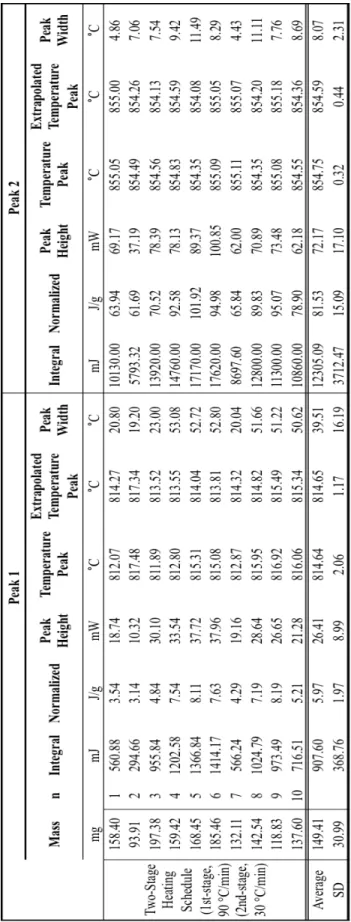
Table 3C: DSC exothermic peak values for the two-stage heating schedule (820-840 °C). ... 59
List of Figures
Figure 1: Classification of fixed dental prosthesis. ... 61
Figure 2: Classification of all ceramic fixed dental prosthesis. ... 61
Figure 3: Graphical representation of Table 1. ... 62
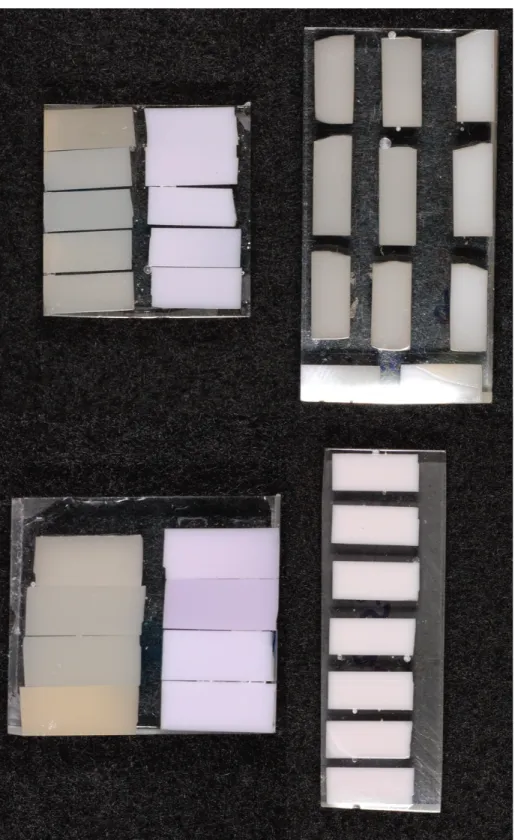
Figure 4: Prepared specimens from the IPS e.max® CAD blocs. ... 63
Figure 5: Examples of prepared specimens for fracture toughness testing. ... 64
Figure 6: Examples of polished specimens for nanoindentation testing. ... 65
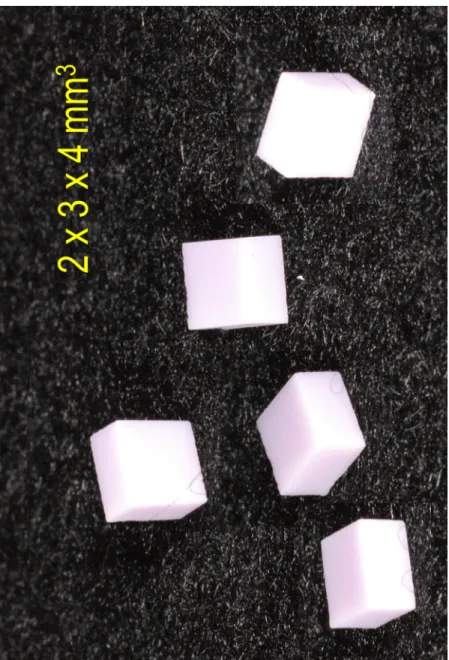
Figure 7: Examples of specimens prepared for DSC testing. ... 66
Figure 8: X-ray- diffraction. ... 67
Figure 9: Flexural strength (n = 12 per group). ... 68
Figure 10: Flexural modulus (n = 12 per group). ... 69
Figure 11: Fracture toughness (n = 12 per group). ... 70
Figure 12: Elastic modulus – nanoindentation (n = 100 per group). ... 71
Figure 13: Surface hardness – nanoindentation (n = 100 per group). ... 72
Figure 14A: A representative SEM image of the Not-Fired group. ... 73
Figure 14B: A representative SEM image of the 530-590 °C group. ... 74
Figure 14C: A representative SEM image of the 590-750 °C group. ... 75
Figure 14D: A representative SEM image of the 590-750 °C (H14) group. ... 76
Figure 14E(1): First representative SEM image of the 750-780 °C group. ... 77
Figure 14E(2): Second representative SEM image of the 750-780 °C group. ... 78
Figure 14F: A representative SEM image of the 750-840 °C group. ... 79
Figure 14G: A representative SEM image of the 820-840 °C (recommended) group. ... 80
Figure 14H: A representative SEM image of the 820-840 °C (H14) group. ... 81
Figure 15: Representative DSC curves for heating rates: 5, 10, 15, & 20 °C/min. ... 82
Figure 16: Representative DSC curves for the manufacturer’s two-stage heating schedule. ... 83
Figure 17: Relationship between heating rates and extrapolated peak-2 temperatures. ... 84
Figure 18A: Non-isothermal kinetics for lithium metasilicate crystallization (peak-1). ... 85
Figure 18B: Non-isothermal kinetics for lithium disilicate crystallization (peak-2). ... 86
Figure 19: Exothermic peak-2 areas of single-stage vs. two-stage heating schedules. ... 87
1. Introduction
1.1.Past and present of glass-ceramics
What is it about studying ceramics and glass that make them so attractive? Even though glass-ceramic materials have been known to most cultures since earliest times, the advancement in glass-ceramic technology has never ceased. Glass-ceramic research has been and continues to be an indicator for human progress. Although glass-ceramics have led to a multitude of benefits that affect human lives, often the importance of glass-ceramics has been underestimated since some of these benefits are embodied in mere conveniences of a relatively trivial sort. For example, one could not help but conjure thoughts of their classical usages like potteries, stained-glass windows, or simply decorations. Today, apart from the centuries-old crudeness of the glass-ceramic technology and the imagery of the men who used such tools, glass-ceramics are a diverse and thriving sector that overlaps with many industries, spanning from advanced manufacturing to renewable engineering and from medical biotechnology to clinical dentistry.
Modern glass-ceramics encompass both traditional and advanced glass-ceramics [1]. The traditional glass-ceramics are generally derived from common, naturally occurring raw materials like clay minerals, quartz sands, and silicate glasses, which are then made into familiar, domestic products such as tableware, bricks, tiles, refractories, and cements through industrial processes that have been practiced for centuries. The advanced glass-ceramics consist of carbides, oxides, nitrides, and non-silicate glasses (e.g., alumina or zirconia), whose applications come in many new façades like the electrical-thermal insulators, lightweight armors, aerospace frameworks, and biomimetic composites. However, many of the most pressing materials’ problems that we face today are driven by the demands placed
on performance. How can we design a glass-ceramic that balances the scale between the intrinsic limits of its engineering tolerance and our application needs, such that our glass-ceramics are able to resist the environmental challenges put forth by humanity or nature?
1.2.Defining modern glass-ceramics
What is a glass-ceramic and how is it different than a glass? In this thesis, a glass-ceramic is defined as an inorganic, nonmetallic, silica-based, matter derived from the manipulation of a glass-based solidified melt. The solidified melt is capable of evolving into a variety of microstructural configurations. Whether the solidified melt remains a glass or becomes a glass-ceramic depends on tailoring its intrinsic chemical composition and imposed thermal treatment. Glass-ceramic development can be generalized in three steps. First, a unique formulation of glass powders and frits is thermally processed to produce a melt. Second, a glass-forming step is executed by quenching the melt in a mold to allow creation of complex designs. Third, the solidified glass precursor undergoes “controlled-crystallization” heat treatments in which the precipitations of crystalline or polycrystalline structures within the solidified melt is modulated by the thermodynamic interaction between the molecular kinetics of the glass and the action of heat, pressure, and subsequent cooling. Furthermore, the genesis of a glass-ceramic is predicated on the addition of nucleating agents, whose function is to reduce the energy barrier of crystalline formation and to act as perturbations for initiating controlled crystallization and for seeding the glassy network with nuclei for subsequent epitaxy. Therefore, the process of forming a crystalline network within a glassy matrix depends on how the amorphous nature of glass is able to compositionally segregate into an ordered molecular arrangement.
1.3.Glass and glass-ceramic comparison
A glass differs from a glass-ceramic by means of its molecular and microstructural configuration. Depending upon the degree of the atomic or molecular ordering, a solidified melt may be comprised solely of an amorphous entity (e.g., glass) or evolve into a partially crystalline structure interspersed with residual glasses (e.g., glass-ceramic). A glass also differs from a ceramic (synonymous with ceramic composite in some literatures) in which the ceramic contains practically 99% singly- or poly-crystalline conformation such as Yttria Stabilized Zirconia (3Y-TZP) [2]. Here, the terms, “amorphous” and “glass”, are synonymous and describe nature’s way of preserving a frozen image of the melt’s structure. By definition, glass is the product of a super cooled liquid, whose atomic arrangement is random and lacks translational symmetry. Because of this atomic disorder and asymmetry, the bond energies, coupling from one atom to another slightly vary when contrasting with the fixed or matching bond energies within an ideal crystal; therefore, during thermal breakdown, a glass solid typically displays a gradual softening into a liquid (glass-transition) rather than having a strict melting point. Additionally, all glasses exhibit a transformation behavior that depends on temperature and pressure. In contrast, glass-ceramics are composed of medium to high percentages of crystals, which are known for their medium- and long-range atomic ordering and predictable symmetry.
To understand why some glasses desire to form crystals but fail to crystallize while other solidified melts crystallize with ease and without vitrification, it is necessary to consider the thermodynamics of glass. Under rapid quenching, the immediate reduction of thermal and radiant energies causes the average translational kinetic energy associated with the disorder motion of silica atoms to decline. This phenomenon not only augments the restriction and localization of silica atoms but also supplant the externally disruptive thermal forces by the
interatomic attractive forces between the silica atoms since the forces of interatomic attraction are slowly exceeding the externally disruptive thermal forces. From a thermodynamic perspective, the energy and vibration of the silica atoms is now confined within the local minimum of its respective potential well, creating a barrier that must be overcome in order for the atoms to move amongst each other, thereby “jamming” the silica atoms in a disordered fashion and preventing the melt from forming a regular lattice. If a melt is to avoid crystallization, the rate of cooling and its structural relaxation needs to be relatively faster than its rate of compositional segregation. Furthermore, if viscous flow under shear forces is present in the melt, the probability of vitrification is increased since the mobility and collisional reactivity of atoms and molecules are impeded through the action of densification by viscous sintering. Therefore, controlling the thermal treatments of a glass allows greater flexibility to modulate its microstructure and physical properties.
1.4.Dental glass-ceramics
In dentistry, modern glass-ceramic fixed dental prostheses (FDPs) utilize the advantages derived from combining properties of crystalline ceramics with those of glasses to restore structural support, protection, and physical integrity to enamel, dentin, and pulpal tissues. They play a critical role in oral rehabilitation while bridging the chasm between synthetic and naturalistic aesthetics. Unlike polymer-based restorations, for which hydrolysis, oxidation, and leachable monomers are a concern, glass-ceramics are chemically and thermally oxidized, forming stable hydroxide- and oxide-based compounds. Under in vivo
environments, they have greater corrosive and microbial resistance, better biocompatibility, much higher melting points, and higher yield strengths than most polymeric restorations [2]. Although glass-ceramics tend to be brittle with no inherent ability for plastic deformation when subject to tensile stresses, they have the capacity for withstanding high compressive
stresses. Typically, they demonstrate greater elastic modulus and less thermal expansion under oral conditions than most metal alloys. More importantly, glass-ceramics provide excellent aesthetic results relative to polymer and metal restorations. Because of these benefits, glass-ceramics are highly favored for many dental applications.
1.5.Classification of dental glass-ceramics
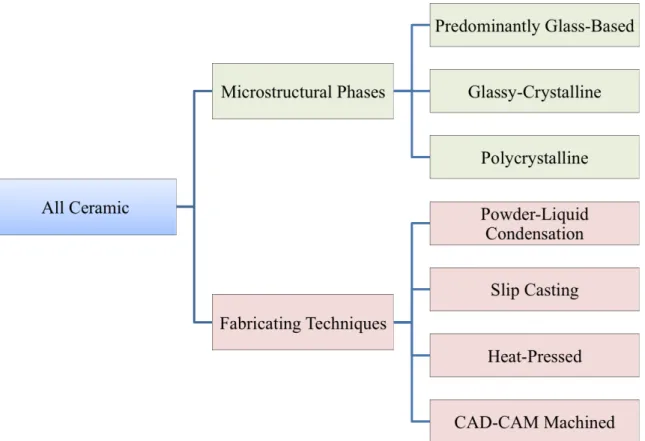
Current fixed dental prostheses (FDP) can be divided into three main types of restorations: (1) all-metal, (2) metal-ceramic, and (3) all-ceramic [2]. See Figure 1. The all-ceramic FDPs can be further classified according to either of the two attributes, (a) microstructural phases or (b) fabricating techniques [2]. Based on the ratio of glassy-to-crystalline components, the “microstructural phases” attribute can be subcategorized into three groups: (i) predominantly glass-based, (ii) glassy-crystalline, and (iii) polycrystalline [3]. For the “fabricating techniques” attribute, it can be subcategorized into the following groups: (i) powder-liquid condensation, (ii) slip casting, (iii) heat-pressed, and (iv) CAD-CAM machined [4, 5]. See Figure 2. Because of the ever-evolving ceramic innovations, these classifications by no means remain stagnant.
1.6.Microstructural phases
1.6.1.The predominantly glass-based group
A predominantly glass-based system typically exhibits greater than 50% of amorphous, glassy network [3]. The two most popular vitreous networks in the predominantly glass-based group are silicate and aluminosilicate liquids, and both can be derived from the melt of silicate [SiO2], alumina [Al2O3], and feldspathic minerals [XnAlSi3O8, where X can be
sodium (Na), calcium (Ca), or potassium (K)], which surprisingly are the three most abundant minerals found in the earth’s crust. Even though the atomic-scale structures for most glasses are still a mystery, the atomic-scale structure for silicates or aluminosilicates is thought to be well-understood. Today, the widely accepted atomic-scale structure for these two melts originates from the continuous network theory of glasses postulated by Zachariasen [6].
The silicate melt contains silicon and oxygen ions, and its basic building block is the silicon-oxygen tetrahedron, where the silicon ion is positioned at the center of the tetrahedron and is bonded to four oxygen ions, located at the four corners of the tetrahedron. Each tetrahedron is “cross-linked” by bridging oxygen ions to form a long-range order of tetrahedral network. In the presence of network-modifying cations (Na+, Ca2+, and K+), the ionic forces of the cations break the bridging oxygen ions and form non-bridging oxygen ions. Because of this, the long-range-ordered silicate network is depolymerized into random clusters of short-range-ordered and medium-range-short-range-ordered structures. In this thesis, a long-range-short-range-ordered network is defined as a crystalline solid, whose atomic arrangement shows periodicity and translational symmetry. The modifying ions can also lower the glass transition temperature and alter the thermal expansion or contraction behavior of the network. An example of a long-range-ordered silicate network is crystalline silicates or quartz, and a silicate network composed of random short-range-ordered clusters is an amorphous glass. Other polymorphs of silicates include cristobalite or tridymite.
The aluminosilicates are solidified melts that contain silicon and aluminum ions tetrahedrally coordinated by the oxygen ions to form a three-dimensional (3D) network. Specifically, the aluminum-oxygen or silicon-oxygen tetrahedrons serve as the basic building blocks of the aluminosilicate network. Unlike the silicon ions, the aluminum ions like to have a coordination number of six and tend to be bonded to six oxygen ions in an octahedral fashion.
The aluminum ion plays a double role. It can substitute for the silicon ion in the tetrahedron. Or, the aluminum ion can function as an independent cation, serving as a network modifier that can reduce the number of network crosslinks and can decrease viscosity by producing non-bridging oxygen ions. If the aluminum ion is to be a substitute of the silicon ion, for every Si4+ that is replaced by an Al3+ in a tetrahedron, the charge is balanced by the modifying cations such as Na+, Ca2+, and K+ ions. The 3D network of aluminosilicates is formed by linking the tetrahedra to each other or to an octahedron via a bridging oxygen ion. After solidification, the aluminosilicate melt can be amorphous or crystalline. An example of a crystalline aluminosilicate is feldspar, and an aluminosilicate network composed of random short-range-ordered clusters is an analogue of amorphous glass. However, in dentistry, feldspathic porcelain is defined as an amorphous aluminosilicate network that is interspersed with feldspar or leucite crystals and is classified as a predominantly glass-based structure [3]. The major advantage of a “predominantly glass-based” prosthesis like feldspathic porcelain is its inherent translucency and enamel-like luster, but its disadvantage is its strength, which is much weaker than the glassy-crystalline or polycrystalline restorations.
1.6.2.The glassy-crystalline group
The glassy-crystalline group consists of a wide variety of glass-ceramic systems: binary [e.g., Li2O-SiO2 or Li2O-2SiO2], ternary [e.g., Li2O-Al2O3-nSiO2 (LAS-System), MgO-Al2O3-nSiO2 (MAS-System), or ZnO-Al2O3-nSiO2 (ZAS-System)], and multicomponent [e.g., IPS e.max® Press and IPS e.max® CAD; Ivoclar Vivadent, Schaan, Liechtenstein]. Among the three systems, binary and ternary are the most thoroughly studied systems because of their simplicity and practicality. These glass-ceramic systems exhibit a glass-to-crystal ratio that ranges from 50% to 70% volume fraction of crystallinity [7]. The production of a glass-ceramic is complicated by the inclusion of a crystalline phase. As mentioned in the earlier
section, glass-ceramic fabrication can be achieved starting by the preparation of a monolithic glass with appropriate base composition, followed by a glass-forming step to allow processing of complex shapes, and then treated by controlled crystallization. The most popular controlled-crystallization system that is commercially available for dental application is the lithium disilicate glass-ceramic. Alternatively, another way to produce a glass-ceramic is by using the method of dispersion-strengthening, a technique similar to making polymer-based composites, where crystalline fillers are added to the glassy matrix to enhance the physical properties and to fine-tune the translucency or opacity of the FDP [7]. The most common particulates used for dispersion-strengthening reinforcement are the feldspar and leucite crystals (e.g., Vitablocs® Mark II, Vident, Brea, California, USA). In this thesis, the glassy-crystalline group consists of glass-ceramics that are fabricated only by the method of controlled crystallization. This is because the percentage of crystallinity made by the dispersion-strengthening method is typically less than 50%, which is considered as a predominantly glass-based structure.
The idea behind dispersion-strengthening or controlled crystallization is to resist crack advancement and ultimately to stop fracture. Although the actual mechanism of fracture for metals, glass, or glass-ceramics is distinctly different, it is generally perceived that the crack advancement can be restrained by toughening the material through compositional or microstructural modifications. For example, for a metal, prior to its fracture or fatigue failure, its macroscopic deformation is related to its microscopic dislocation plasticity. If dislocation motion or slip processes were hindered, metal materials would be brittle, resulting in metal strengthening. On the other hand, unlike a metal, a glass having a random and non-periodic arrangement of atoms, has neither dislocations nor slip systems. Furthermore, for a glass with a homogeneous phase, its microstructure lacks the stress-relieving characteristics such as grains or grain boundaries. Because of this, glass exhibits a low tolerance for flaws,
resulting in the same aforementioned phenomenon as in metal strengthening – brittleness without plasticity.
At room temperature, the glass strength is very much dependent on the intrinsic number of flaws, cracks, or porosities. And, several ways to prevent glass from fracture involve reducing flaws, minimizing crack growth, and hindering porous plasticity. Most importantly, controlling the evolution of grain sizes and grain boundaries, while a glass is being transformed into a glass-ceramic, plays a key role in crack tip shielding. Past studies have shown that either by inducing growth or by inclusion of crystalline grains into the glassy matrix, the grain boundaries can act as crack “pinning agents” since the atomic-scale asymmetry within a grain-boundary region can contribute to the discontinuity of crack growth from one grain to another, thereby strengthening the glass-ceramic [8-10]. Theoretically, the mean-free-path distance between the grains dictates the crack-crystallite interactions. Whether a crack can be pinned or deflected depends on its size relative to the mean-free-path distance. Pinning a crack by the crystalline phase is more effective when the crack size is approximately equal to the mean-free-path distance between the grains. While at larger crack sizes, a grain can act as a barrier, either resulting in crack deflection around the grains or crack propagation through the grains, which altogether requires a large amount of stress. As an unwritten rule, the strength of a glass-ceramic is increased when the mean-free-path distance between grains is decreased relative to the crack size. Alternatively, according to the Hall-Petch equation,
(where σy is the yield stress; σ0 is a materials constant for the starting stress for dislocation
movement; ky is a constant that is unique to each material; and d is the average grain
diameter), the strength of a fine-grained glass-ceramic is higher than a coarse-grained since greater numbers of grain boundaries are found in the fine-grained glass-ceramic, which can help to impede crack motion. However, the Hall-Petch equation no longer holds true when the grain size reaches below ten nanometers. Since nano-scale grains are small enough to act as a collective unit, each grain can start to slip and slide amongst one another, generating slip processes like in the case of a metal.
1.6.3.The polycrystalline group
A polycrystalline ceramic or using the aforementioned terminology, ceramic composite, typically exhibits a 95-99% volume fraction of crystallinity [4]. The conventional view of a polycrystalline-ceramic microstructure is a multiplicity of randomly oriented crystals joined at grain boundaries. These random geometrical orientations and size of the polycrystalline grains play an important role in how a crack propagates and whether the fracture deviates along the grain boundary (inter-granular) or continues through the grain (trans-granular). For example, when the grains within a polycrystalline ceramic happen to be in a favorable orientation for cleavage, the cleavage energy of fracture is at its minimum. Furthermore, since the atomic-scale structure of the grain boundaries can be readily disturbed by interaction with cracks, flaws, porosities, and external fields such as temperature and pressure, a slight variation in the atomistic level of structural order at the grain boundaries can strongly affect crack motion and fracture properties. Despite the complexity of fracture phenomena in poly-crystals, the strength and toughness of the polycrystalline ceramics tends to be better than glasses and glass-ceramics.
With the development of Computer-Aided Design and Computer-Aided Manufacturing, considerable interest in the dental community has piqued in these polycrystalline ceramics for the possible application as posterior FDPs. In addition, recent laboratory and clinical studies have shown promising outcomes for strength, durability, and survival rates [10-12]. However, the advantages of polycrystalline ceramics also come with distinct disadvantages. One major disadvantage is the lack of a glassy phase within the polycrystalline network, which can impair the effectiveness of conventional adhesive luting procedures. Furthermore, as aesthetics become increasingly paramount, the opacity of polycrystalline ceramics can affect the optical translucency, resulting in less than optimal aesthetics. To compensate for this, it has become routine that polycrystalline ceramics are used as core ceramics for veneering with compatible feldspathic porcelain. By doing this, an all-ceramic crown combines the strength of a polycrystalline core with the aesthetics of feldspathic porcelain, but the limited bonding strength exhibited at the interfacial surfaces between polycrystalline substrate, veneering ceramic, or a tooth remain a challenge. Other shortcomings include abrasiveness to the opposing natural dentition. The most popular polycrystalline compositions are alumina, zirconia, and titanium (e.g., ProceraTM Alumina, ProceraTM Zirconia, and ProceraTM Titanium; Nobel Biocare, Zurich, Switzerland).
1.7.Fabricating techniques
1.7.1.Powder-liquid condensation
For years, the use of powder-liquid condensation has been the simplest, most direct, and economical method for layering and veneering dental porcelain. First, the glass-ceramic powders are converted into slips using a diluting agent. Then, custom layering and stacking of the dental porcelain involve the application of these slips, one coating at a time, by using a
sculpturing blade or brush while carefully crafting the tooth anatomy. Finally, the stacked porcelain is dried and thermally treated. The key to a quality prosthesis is to maintain proper moisture level and liquid-to-powder ratio so that the packing of the powder particulates remains dense and compact. This method requires not only the technical know-how but also appropriate experiences along with a touch of artistry to succeed. Because the stacked porcelain is artistically crafted and contains feldspar-based silicate glass with minimal crystalline fillers, its appearance and optical translucency deliver excellent aesthetics for custom veneers. However, the porosity profile of the manually stacked porcelain typically shows a high degree of variability, which can impact the strength and toughness of the restoration.
1.7.2.Slip cast
The process of slip casting uses both ceramic slips and glasses. It involves a two-stage heat-treatment. The slips are a liquid suspension of ceramic particles and behave like hydrocolloids for which imbibition, syneresis, and flocculants can change their physical properties. To control the slips’ pH, rheology, and osmotic equilibrium, other ingredients such as pH modifiers, binders, and deflocculants are added to prevent alkaline pH interaction, to preserve slips’ viscosity, and to avoid leaching of ceramic colloids from the suspension respectively. Besides their principal application in slip casting, slips can also be used when making pressed mixes. In slip casting, the slips are poured into a mold that is designed to absorb water; the mold is contoured to match the desired shape or “jacket” of the master die, which is a perfect replica of the prepared tooth or implant abutment readied for a FDP. After the water from the slips is sodden through the mold’s walls, a thin coating of the ceramic particles is condensed tightly against the mold, creating a ceramic skeleton. Next, this “green” skeleton is dried and prepared for its first thermal treatment, where sintering of the
ceramic particles takes place. The design of the resultant product is anticipated to be a porous microstructure so that it can be infiltrated by molten glass. Subsequently, following a second firing schedule in which the molten glass penetrates into the porous framework via capillary action, the ceramic skeleton is interlaced with the glassy matrix to form the core of the dental prosthesis. Like the metal framework, feldspathic porcelain can be stacked and glazed onto the glass-ceramic core for its final finish. The glass-infiltrated ceramic cores typically exhibit higher fracture resistance and strength than those fabricated by powder-liquid condensation due to the cores’ high polycrystalline contents in their skeleton and less man-made variability.
1.7.3.Heat-pressed
The heat-pressed process is similar to the lost-wax casting method, consisting of designing, investing, burnout, and casting (pressing). In the designing stage, a wax model of the desired FDP is sculptured. Following spruing, the wax model is encased or “invested” in a mold, typically made of gypsum materials. Then, the mold is heated upside-down, and the wax is "lost" or “burnt-out”, leaving behind a cavity. Finally in the pressing stage, instead of using metal, glass-ceramic ingot is heated, softened, and pressed or injected into the mold’s cavity. The resultant product can be finished either with the staining or cut-back techniques. In the staining technique, the pressed restoration is finished first by the application of stains and glazing materials and followed by characterization firing. In the cut-back technique, the pressed restoration is trimmed, veneered, stained, and glazed to create the illusion of optical translucency and anatomical realism like incisal mamelons.
1.7.4.Computer-Aided Design and Computer-Aided Manufacturing (CAD-CAM)
For this work, we concentrated on studying the physical and kinetic properties of an all-ceramic system made of lithium disilicate glass-all-ceramic material that is specifically designed for CAD-CAM. The details of the CAD-CAM techniques are discussed in the following sections.
2. Lithium disilicate glass-ceramics
2.1.Background of lithium disilicate glass-ceramics
The most widely used ingredients found in numerous dental glass-ceramics are silicate [(SiO4)4-] and leucite [KAlSi2O6] crystals, whose growth is often induced within a feldspar-based silicate glass [(Na or K)AlSi3O8] through the process of devitrification [13]. Besides using leucites as the predominant crystals for fine-tuning thermal expansion, strength reinforcement, and optical enrichment, incorporation of alternative inorganic ingredients like lithium disilicate [Li2Si2O5 or Li2O-2SiO2] and oxide-based compounds (e.g., magnesium oxide, aluminum oxide, or zirconium oxide) into glass precursors is rapidly gaining acceptance as the standard of care [4, 14]. These newer generations of glass-ceramics are differentiated from the feldspar-leucite glass-ceramics by their elevated strength, increased processing temperatures, improved toughness, and tailored properties for milling machines [2, 15, 16]. An example of such a system is IPS e.max® CAD (Ivoclar Vivadent, Schaan, Liechtenstein), a lithium disilicate based glass-ceramic that is intended for CAD-CAM processing. In many cases, lithium disilicate glass-ceramics have exhibited better physical performance than the traditional feldspar-leucite glass-ceramics [15, 17, 18]. These improved properties of lithium disilicate glass-ceramic are likely related to its robust multiphasic composition [19].
2.2.Clinical performance of lithium disilicate glass-ceramics
According to a recent review, the failure rate of single-unit crowns made from lithium disilicate glass-ceramics (i.e., IPS Empress® 2 and IPS e.max® Press; Ivoclar Vivadent, Schaan, Liechtenstein) was reported to be less than 5% at 5 years [20]. Also for the
three-unit lithium-disilicate FDPs, the 10-year survival result was 87.9% and was found to demonstrate acceptable longevity as compared with the conventional metal-ceramic gold standards, which usually have a survival rate of 89% [21, 22]. When tooth location was considered, survival rates for both anterior and posterior crowns that were restored with lithium disilicate glass-ceramics were shown to be competitively similar – with only slightly greater success for posterior than anterior crowns [23]. Furthermore, a recent 9-year prospective study found no significant difference in survival rate between anterior and posterior crowns made of lithium-disilicate glass-ceramics [24]. However, crowns restored with feldspar-leucite glass-ceramics showed a greater success for anterior than posterior locations [20]. In general, the most common complications associated with the glass-ceramic FDPs involved: tooth or glass-ceramic fracture, loss of retention, secondary caries, and the need for endodontic treatment [21].
2.3.Materials science of lithium disilicate glass-ceramics
2.3.1.Lithium disilicate glass-ceramics for dentistry
Lithium disilicate glass-ceramics were first introduced into the dental community in 1998 by Ivoclar Vivadent. Since its inception, dental research on the lithium disilicate glass-ceramics have been based on the commercial product, IPS Empress® 2 (Ivoclar Vivadent, Schaan, Liechtenstein). It contained approximately 65% volume fraction of lithium disilicates, 34% volume fraction of residual glass, and 1% volume fraction of porosity after heat treatments [15]. Unlike the binary lithium disilicate system that was first developed by Stookey (1959) [25], the IPS Empress® 2 was derived from a multi-component system, formulated from SiO2-Li2O-K2O-ZnO-Al2O3-La2O3-P2O5 compositions [13, 26]. Scanning electron
micrographs of IPS Empress® 2 revealed that the microstructures of lithium disilicates were elongated crystals with a mean grain length and diameter of 5.2 µm and 0.8 µm respectively [15]. In contrast to IPS Classic®, for which uncontrolled devitrification of leucites occurred only on the surface [27, 28], the controlled crystallization of IPS Empress® 2 ensured that nucleation and crystal growth of lithium disilicates propagated uniformly throughout the bulk structure during heat treatments [26, 28]. The nucleation in IPS Empress® 2 was achieved with the aid of special additives (e.g., P2O5, TiO2 and ZrO2) [29, 30]. Additionally, these additives could alter the eutectic composition and temperature of the IPS Empress® 2 glass-ceramic [31]. According to Headley and Loehman (1984), at low temperature, P2O5 amassed and formed the crystalline nuclei of lithium orthophosphates. Then, lithium metasilicates, lithium disilicates, and cristobalites could be crystallized by epitaxial growth on those lithium orthophosphates [32].
2.3.2.The effect of thermal treatment on lithium dislicates
Besides the special additives, the growth of lithium disilicate crystals could also be affected by a one- or two-stage heating schedule. The one-stage heating schedule only involved a single heating rate and holding time. The two-stage heating schedule typically entailed first and second heat treatments for nucleation then crystallization respectively [29, 33]. The initial heat-treatment stage was important to establish a kinetically favorable setting for stabilizing lithium metasilicates [33]. The second heat-treatment stage, usually at a higher temperature range than the initial, supplied the thermal energy to induce growth of lithium disilicates and to thermodynamically destabilize the lithium metasilicates [33]. According to Borom et al. (1975), the growth of lithium disilicate crystals was not dependent on the crystalline nuclei of lithium metasilicates [33]. Rather, lithium metasilicates kinetically competed with lithium disilicates but slowly diminished since it was thermodynamically less
stable than lithium disilicates at high temperatures [33]. In contrast, Zheng et al. (2008) suggested an interdependence between lithium metasilicates and lithium disilicates, where lithium disilicates could be epitaxially grown on lithium metasilicates [29]. Past investigations have argued that a two-stage heating schedule precipitated more and larger lithium disilicate crystals than a single-stage heating schedule [29, 33, 34]. Even though the single-stage heating schedule might require less overall processing time, it tended to lack the appropriate thermal enrichment for maturation of lithium disilicate crystals [29, 34]. Because of this, phase separations between lithium metasilicates and lithium disilicates were less distinguishable amidst the glass-ceramic microstructures for the single-stage heating schedule that encourages a fast or ultrafast heating rate.
2.3.3.CAD-CAM lithium disilicate glass-ceramics (IPS e.max® CAD)
With the advent of CAD-CAM technology, newer generations of glass-ceramic blocs were introduced to accommodate the ease of milling, to maximize cutting efficiency, and to prolong the life of the milling tools. Today, the insertion of a chair-side IPS e.max® CAD prosthesis involves three fabricating progressions: industrial casting of the blocs, CAD milling, and final thermal refinement for enriching lithium disilicate crystallization. First, according to the manufacturer, glass compositions (mainly SiO2, Li2O, P2O5, ZrO2, ZnO, and K2O) are incongruently melted, quenched, and annealed to form blue ingots, IPS e.max® CAD blocs [35]. The blue tint, acquired from the added colorants, is evidence that the bloc has undertaken a partially glassy-crystalline transformation and signifies its readiness for the second process, CAD milling. In this partially crystallized state, these intermediates inherit a mild to moderate strength and hardness, which can be easily machined by any popular CAD-CAM system. Often, this second process can be conveniently done in a private dental practice. After milling, it is then transformed by a two-stage heat treatment into a dental
prosthesis containing both glassy phase and lithium disilicate crystals. Different heating parameters can upset the driving force for growing lithium disilicates and can alter the overall percentage of residual glasses [15-19, 33]. Theoretically, glass-ceramic prostheses, containing an extra residual glassy phase, are more likely to adversely impact a number of properties including load-bearing capacity, resistance to acidic attacks, and fracture toughness [30]. In contrast, amplifying crystallization lowers the coefficient of thermal expansion, improves the resistance to thermal shock, and increases prosthetic strength [30, 36, 37].
2.3.4.Current challenges
Although many studies have been conducted to evaluate the clinical performance and potential shortcomings of lithium disilicate glass-ceramics in comparison to other popular types of dental materials, only a few focus on the glass-ceramics’ properties from an intrinsic perspective of crystallization, phase assembly, thermal history, and kinetics. Additionally, most of that handful of studies has been confined within the erudite realms of the pure or binary Li2O-SiO2 systems [29, 38-43]. Exploration on how a “multi-component” CAD-CAM bloc crystallizes has been very limited [44]. Further investigation in describing the intricate interplay between thermal treatments and crystalline architecture exhibited by these materials can offer insights on how their atomic-scale behaviors can transcend to distress or to fortify their macroscopic material properties. Most importantly, clarification on why lithium metasilicates tend to evolve to form lithium disilicates needs to be addressed so their desired clinical properties can be deliberately manifested through the manipulation of heat treatments.
In this thesis, we studied the history-dependent response (thermal versus physical) of a multi-component glass-ceramic, named IPS e.max® CAD that was sold in the form of a partially
crystallized precursor, and endeavored to comprehend its kinetic process through analysis of its emergent microstructures and macroscopic physical properties. According to the manufacturer, the heating schedule for inducing crystallization of lithium disilicates within an IPS e.max® CAD bloc consisted of two (double) heating rates and two holding times, each of which was initiated and held at a specific targeted temperature (see Table 1 and Figure 3 for the group labeled as 820-840 °C). Initially, the partially crystallized precursor was heated at a rapid rate of 90 °C/min from 403 °C (furnace stand-by-temperature) to 820 °C and held for 10 seconds at 820 °C (first targeted temperature). This was followed by a slower, second heating rate of 30 °C/min. Then, it was held for a prolonged period of seven minutes at 840 °C (second targeted temperature). In this study, we hypothesized that a slower heating rate before the recommended-first-targeted temperature (820 °C) will allow further crystallization of lithium disilicates. We also hypothesized that a longer holding time at the recommended-second-targeted temperature (840 °C) will allow further crystallization of lithium disilicates, which both are expected to lead to increasing the flexural strength, fracture toughness, elastic modulus, and hardness of the final IPS e.max® CAD samples.
3. Objectives and hypotheses
3.1.Objectives
The aims of this study were:
1) To characterize the transformative behavior, crystallizing kinetics, and microstructural evolution of a partially crystallized glass precursor (IPS e.max® CAD) into lithium disilicate glass-ceramics.
2) To evaluate its physical properties (flexural strength, fracture toughness, elastic modulus, and hardness) at seven unique two-stage heating schedules
3) To find correlations between each stage of the glass precursor’s evolutionary phases and microstructures and to contrast the corresponding physical properties of those phases.
3.2.Hypotheses
The null hypotheses are:
1) When IPS e.max® CAD is thermally processed under a two-stage heating schedule, an early onset of the second heating rate at a lower targeted temperature (750 °C) than the recommended (820 °C), which causes a time extension of the heating interval for the second heating stage, will not have an impact on the glass-ceramic’s flexural strength, fracture toughness, elastic modulus, and hardness.
2) Protracting the holding time at the isothermal temperature, 840 °C, of the second heating stage will not have an impact on the glass-ceramic’s flexural strength, fracture toughness, elastic modulus, and hardness.
The alternative hypotheses are:
1) When the temperature interval at the second heating stage is stretched from 750 to 840 °C versus from 820 to 840 °C, the glass-ceramic’s flexural strength, fracture toughness, elastic modulus, and hardness are predicted to have an increase.
2) Increasing the holding time from 7 to 14 minutes at the isothermal temperature, 840 °C, of the second heating stage will increase the glass-ceramic’s flexural strength, fracture toughness, elastic modulus, and hardness.
4. Materials and methods
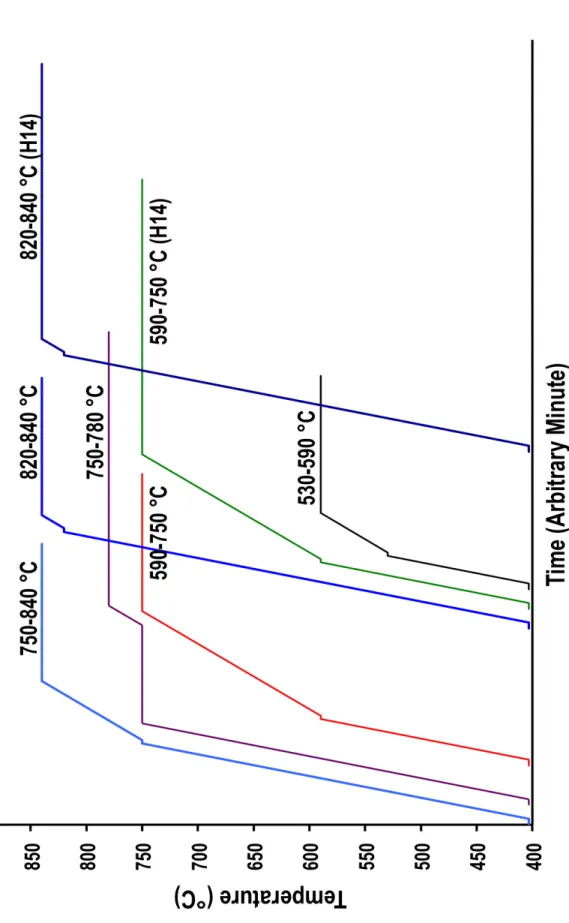
4.1.Heating schedules
Based on past studies and manufacturer recommendations, eight unique two-stage heating schedules (including the not-fired group) were developed to evaluate the IPS e.max® CAD blocs. See Table 1 (Figure 3 is a graphical representation of Table 1). Group 820-840 °C represented the manufacturer’s recommended two-stage heating schedule and was the control group. Here, the two-stage heating schedule was designed to thermally process a glass precursor in two successive stages, where each stage consisted of a unique heating rate, holding time, and targeted temperature. The targeted temperature was defined as the terminal temperature point at which the ramping of heat at a particular heating rate was ended and as the start of an additional ramping of heat at a new heating rate. Usually, the first heating rate was ramped much faster than the second heating rate. In this work, we followed the manufacturer’s recommendation for which the first and second heating rates were maintained at 90 and 30 °C/min respectively. The reason behind this was for consistency, ease of comparison, and minimizing covariates.
All heating schedules were derivatives of the recommended two-stage heating schedule, but the targeted temperatures and the second holding times were modified. The heating schedules for the 530-590, 590-750, 590-750 (H14), and 750-780 °C groups allowed us to study the evolutionary development of the lithium disilicate system. For the 750-840 °C group, the second heating rate (30 °C/min) began at a lower onset temperature than the control group (750 vs. 820 °C). This would protract the time for the second heat ramping to reach the final temperature of 840 °C since it was ramping at a speed of 30 °C/min instead of 90 °C/min. The control group would take less time to complete its second heat ramping as
compared with the 750-840 °C group since it was ramping through a narrower temperature interval of 20 °C scale versus an interval of 90 °C scale for the 750-840 °C group. Because of this, we suspected crystalline growth would be influenced by the prolonged second ramping time. For the 820-840 °C (H14) versus the control group, their difference was the longer holding time of 14 minutes as opposed to the regular seven minutes at 840 °C, where we were expecting the residual crystallization to occur. For this study, furnace stand-by temperature, door closing time, and heating rates were held constant. Additionally, an ultra-short first holding time of 10 seconds was followed by a second holding time of either 7 or 14 minutes. Thus, the overall heating time was calculated by summing the time for closing the furnace door, the two two-stage ramp periods, and the holding times.
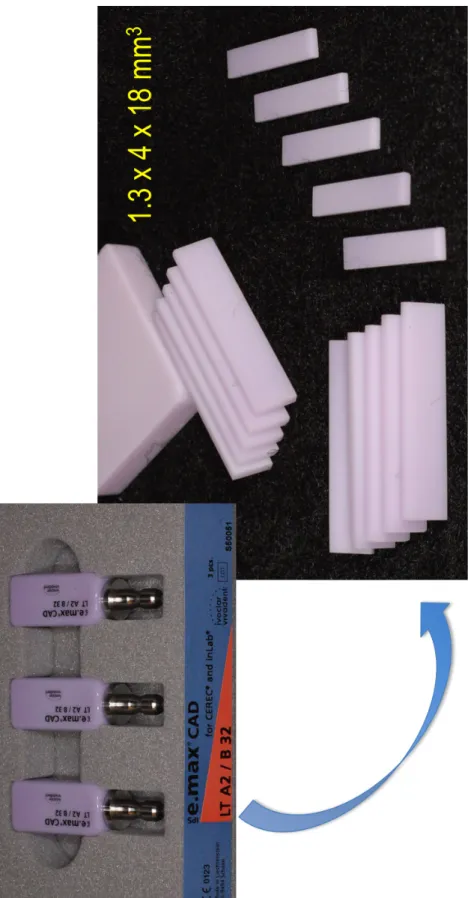
4.2.Specimen preparation
Following the ISO Specification 6872 [45], the IPS e.max® CAD blocs were sectioned into bars using a diamond saw (Isomet 1000, Buehler, Lake Forest, IL). See Figure 4. The rectangular bars were randomly but equally divided into the eight groups of various firing schedules. See Table 1. Twelve rectangular bars per group were used (i.e., for the flexural test, n = 96, and for the fracture test, n = 96). After firing, all surfaces of the bar were polished using silicon carbide paper of 600-, 800-, 1000-, and 1200-grit (EXAKT Technologies, Oklahoma City, OK, USA) under running water at 300 rpm on a polishing machine (EXAKT 400 CS, EXAKT Technologies, Oklahoma City, OK, USA). After polishing with each of the various grits, the specimens were rinsed with water. The specimens were stored dry until testing was performed.
The XRD data were collected from three representative specimens per group by using a D8 Discover X-ray diffractometer with two-dimensional VÅNTEC-500 detector (Bruker Instruments, Billerica, MA, USA). Using monochromatic radiation (λKα = 1.5406 Å), each specimen was scanned in bulk over the 2θ range, 16° – 82°, with an angular resolution of 0.005° for identifying the crystalline phases.
4.4.Flexural strength
The three-point flexure test was performed as recommended by ISO Specification 6872 [45], and the flexural strengths, σFS (MPa), were calculated according to the following formula:
!!" = 3!"
2!!!
where F was the breaking load (N); l was the test span (mm); b was the width of the specimen (mm); and d was the thickness of the specimen (mm). The three-point flexure test fixture consisted of two cylinders with a radius of 0.8 mm (span distance of 15 mm) and a loading, cylindrical head with a radius of 0.8 mm. The IPS e.max® CAD blocs were prepared into bars (1.3 mm x 4 mm x 18 mm) as described in the sample preparation section. Each specimen was loaded to failure (crosshead speed = 0.5 mm/min) using a universal testing machine (MTS Sintech ReNew 1123, MTS Systems, Eden Prairie, MN, USA), at room temperature. The flexural modulus was acquired from the slope of the best-fitted linear region of the load-deflection curve. The mean and standard deviation were then calculated.
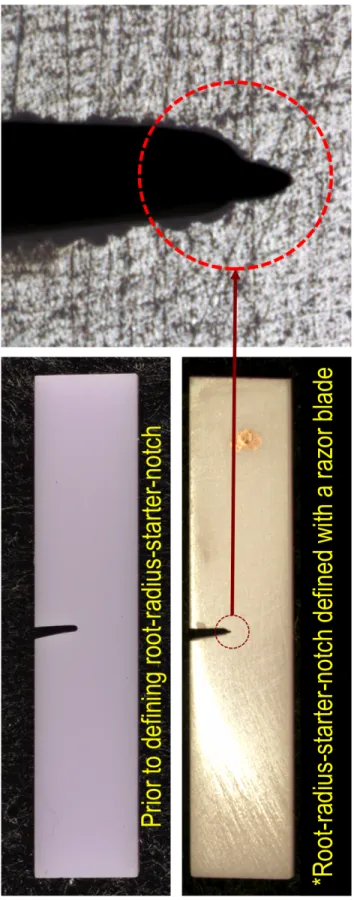
4.5.Fracture toughness
The fracture toughness values were determined by a single-edge notched-beam method, ISO Specification 6872 [45]. See Figure 5. The IPS e.max® CAD blocs were prepared into bars (1.3 mm x 4 mm x 18 mm) as described in the sample preparation section. The notches of the specimens were prepared with a diamond saw (blade thickness = 0.3 mm, EXAKT 300, EXAKT Technologies, Oklahoma City, OK, USA). All root radii of the prepared notches were then manually refined using a single-edged razor blade and diamond polishing paste. The final notch depth and root radius were 1.0 mm ± 0.2 mm and 0.05 mm ± 0.02 mm, respectively, which was verified by using a stereomicroscope (Nikon Measurescope UM-2, Shinjuku, Tokyo, Japan). The KIC (MPa m0.5) values were calculated using the following
equations: !!" = ! ! ! ! ! 3 ! 2(1− !)!.! ! ! = 1.9472 – 5.0247 ! + 11.8954 !! –18.0635 !!+14.5986 !!– 4.6896 !! != ! !
where P, S, a, b, and w were peak load (MPa), test span length (m), notch depth (m), specimen thickness (m), and specimen width (m) respectively. The specimens were tested in a similar manner as flexural strength in a universal testing machine at a crosshead speed of 1 mm/min. The mean and standard deviation were then calculated.
4.6.Nanoindentation
A MTS Nanoindenter® XP (MTS Systems, Eden Prairie, MN, USA) equipped with TestWorks® software (MTS Systems, Eden Prairie, MN, USA) and fitted with a tetrahedral Berkovich diamond indenter tip (Serial # TB20128, MTS Systems, Eden Prairie, MN, USA) of 20 nm radius (faces 65.3° from vertical axis) was used to measure all specimens. A linear array of indents (100 indents per group = 10 indents per specimen x 10 specimens per group; total n = 800) was diagonally imprinted on the polished surfaces obtained from the fragments of the three-point flexure test (see Figure 6). Each consecutive indent was spaced 30 µm apart from each other to avoid any interference of residual stresses from adjacent imprints. Force–displacement curves for the indents were used to evaluate the elastic moduli. For each indent, elastic modulus was calculated using the standard methods of Oliver and Pharr [46], where the unloading force-displacement curves were fitted to the upper 50% of the maximum force with a power-law expression,
!=! (ℎ−ℎ!)!
where P (mN) and h (nm) were ordered pairs of force-displacement data, and B (mN/nmm), hf
(nm), and m (no unit) were best-fit constants. Here, P was the contact force exerted by the indenter onto the sample, and h was the penetrating displacement of the indenter into the sample, relative to the position at which the indenter first contacted the sample’s surface. The contact stiffness, S (mN/nm), was analytically differentiated with respect to displacement and was evaluated at the maximum displacement,
!= !"
!ℎ !!!!"#
The contact area, A (nm2), was determined using the depth to area calibration for the Berkovich tip. The reduced modulus, Er (GPa), was calculated using the contact stiffness and
contact area at maximum load,
!! =
1
2
! ! ! .
The Elastic modulus, E (GPa), per group was computed from Er as
! = 1− !! 1 !!−
!!!
!!
!!
where ν was the Poisson’s ratio of lithium disilicate glass-ceramic [47-49], and νi and Ei were
the Poisson’s ratio (0.07) and elastic modulus (1141 GPa) of the Berkovich indenter, respectively. The nanoindentation hardness was obtained from the indentation load divided by the projected contact area, A (nm2),
!"#$%&''= ! !
where the A and P were determined as described earlier.
4.7.Scanning electron microscopy (SEM)
Microstructural analyses were performed using a Field Emission-SEM (Sigma VP, Carl Zeiss, Oberkochen, Germany). To study the microstructures of lithium disilicate crystals, the
polished surfaces of the glass-ceramic specimens were etched with an aqueous 9% hydrofluoric acid (HF) for one minute. This etching procedure was necessary to partially remove the glassy phase, thereby enhancing the image contrast between the crystalline and glassy phases under SEM. After the chemical etching, the specimens were washed several times using acetone and distilled water. Next, they were placed in an ultrasonic bath at room temperature for 10 minutes to remove residuals of HF and external particles adhering to the surfaces. Then, they were imaged under SEM after being sputter-coated with gold (Denton Vacuum Desk II, Denton Vacuum, Moorestown, NJ, USA).
4.8.Differential scanning calorimetry (DSC)
A differential scanning calorimeter (DSC822e, Mettler-Toledo, Columbus, OH, USA) was used to investigate the non-isothermal crystallization kinetics of the IPS e.max® CAD. Temperature and sensitivity calibrations were done in the same experimental conditions as those used for the actual samples. The non-isothermal experiments were performed on a total of forty IPS e.max® CAD specimens (10 specimens per heating rate) that were without any previous thermal treatment. Four variable heating rates (5, 10, 15, 20 °C/min) in the temperature range of 500 °C to 880 °C were done. Each specimen’s dimension was 2 mm x 3 mm x 4 mm (see Figure 7) and was tested in a platinum crucible for better thermal conductivity and under nitrogen atmosphere to prevent extensive thermal degradation.
Several approaches were available to characterize the crystallization kinetics of IPS e.max® CAD. To determine the activation energy, the approach used in this study was based on the theoretical model formulated by Kissinger (1957) [50-52]. Using the Kissinger model, the relationship between a particular heating rate, βi (e.g., 5, 10, 15, or 20 K/min), and the peak
!" !!
!! =
!
! !!+!"#$%&#%
where E (kJ/mole) was the crystallization activation energy, and R was the gas constant [8.3145 J/(K mole)]. A plot of !" !!
!! versus
!
!! would then yield a straight line with slope
E/R, whose terms could be rearranged to obtain the activation energy, E [53].
Also, ten IPS e.max® CAD specimens, again without any previous thermal treatment, were heated in the differential scanning calorimeter that strictly adhered to the manufacturer’s recommended two-stage heating schedule, where each of the partially crystallized precursors was heated at a rapid rate of 90 °C/min from 403 °C (furnace stand-by-temperature) to 820 °C and held for 10 seconds at 820 °C (first targeted temperature), was followed by a slower, second heating rate of 30 °C/min, and then was held for a prolonged period of seven minutes at 840 °C (second targeted temperature). Each specimen’s dimension was 2 mm x 3 mm x 4 mm (see Figure 7) and was also tested in a platinum crucible and under nitrogen atmosphere for the same reasons as explained earlier. The exothermic energies (peak area normalized against mass) were acquired from the DSC curves, and the mean and standard deviation were then calculated.
4.9.Statistical methods
The statistics of the measured properties was analyzed by the Kruskal-Wallis, one-way analysis of variance (ANOVA), and Tukey's post-hoc tests at alpha = 0.05 significance using SAS® 9.4 statistical software (SAS Institute Inc., Cary, NC, USA). Prior to conducting the
multiple comparisons of means, the Kolmogorov-Smirnov test was applied to ensure that our dataset could be modeled by a normal distribution, and the Levene’s test was used to assess that our dataset demonstrated homogeneity of variances. If the dataset did not meet the criteria of normal distribution, Kruskal-Wallis with Tukey’s post-hoc test was used to compare groups’ means. If the assumption of equal variances were not fulfilled, we would then proceed with an adjusted F statistic (Welch test) for determining whether a post-hoc test could be executed prior to comparing groups’ means.
5. Results
5.1.XRD patterns
5.1.1.The not-fired, 530-590, 590-750, and 590-750 °C H14 groups
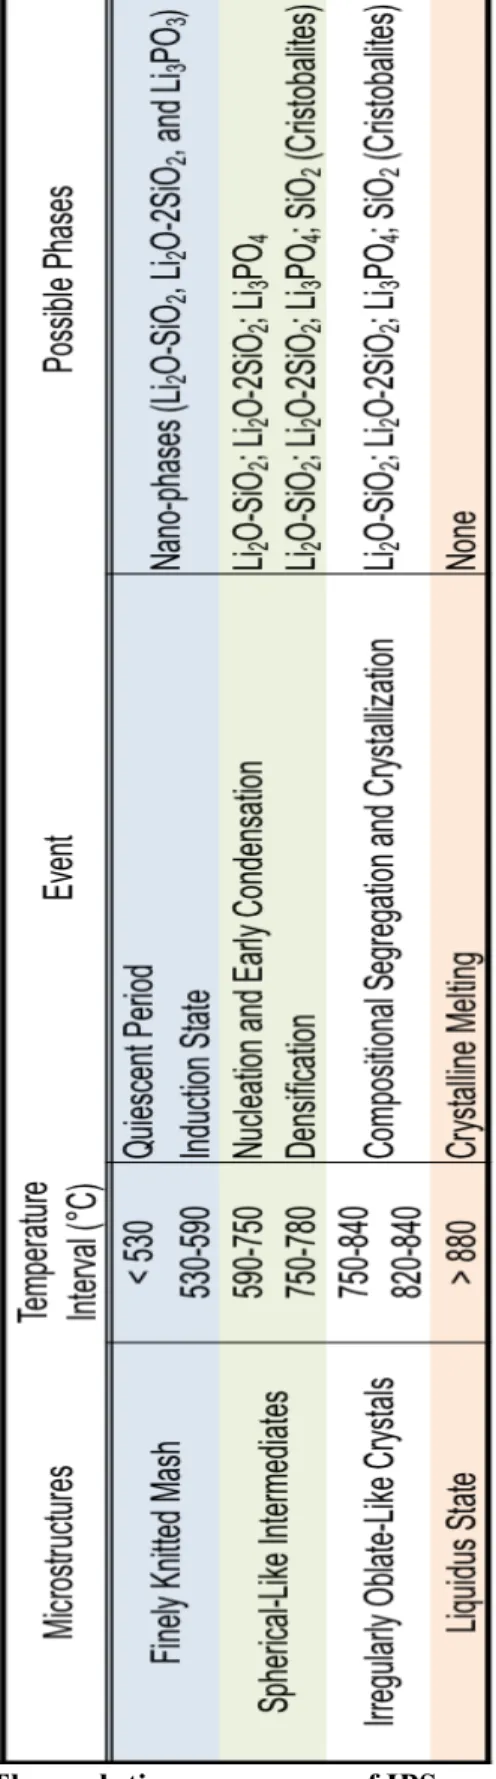
The XRD patterns for the eight groups are presented in Figure 8, and they are organized by their temperature intervals at the second heating stage of a two-stage heating schedule, from the lowest to the highest temperature intervals. Starting with the “not-fired” group at the bottom of Figure 8, the diffraction pattern near the baseline, ranging from the 2-theta scale of 16 to 38 degrees, shows a widely distributed “hump”, which represents the glassy phase within the IPS e.max® CAD blocs. As the temperature was gradually elevated and the “glassy hump” slowly dwindled but did not disappear, its continual presence across all eight of the XRD patterns demonstrates the tenacity of residual glasses within the glass-ceramic matrix. This justifies that the heat-treated IPS e.max® CAD material can be categorized according to the aforementioned classification as a glassy-crystalline group. Groups that were treated within the second-stage thermal interval of 530-750 °C (i.e., 530-590, 590-750, and 590-750 °C H14) exhibited similar XRD patterns as compared to the not-fired group. Their major XRD peaks are identified to be the lithium metasilicate [Li2SiO3 or Li2O-SiO2] and lithium orthophosphates [Li3PO4].
The detection of Li2SiO3 was made by the diffraction angles at 18.82, 26.89, 32.96, 38.5, 51.59, 55.25, 58.88, 69.53, 72.64, and 75.61, using ICCD 029-0829. The identification of Li3PO4 was made by the diffraction angles at 29.68, 34.57, 41.43, and 44.13 using ICCD 025-1030.
5.1.2.The 750-780 °C group
As shown in Figure 8, the different peaks that appeared in the 750-780 °C XRD pattern were indicative signs of a glass-ceramic that consisted of three major phases: lithium disilicates, cristobalite, and lithium orthophosphates. For lithium disilicates and cristobalites [SiO2], their identification was made by the diffraction angles at 23.81, 24.35, and 24.86, using ICCD 040-0376 and 015-0637, and by the diffraction angles at 21.75 and 35.78, using ICCD 039-1425, respectively, while lithium orthophosphates was identified by the diffraction angles as described in the previous section.
When the five XRD patterns, ranging from the bottom of Figure 8 up to the 750-780 °C group, were simultaneously surveyed, they revealed a glass-ceramic that was being transformed from predominantly lithium metasilicates’ contents into a heterogeneous mixture of different phases. Since the XRD peak intensities have been used to qualitatively estimate the relative proportions of different phases in a glass-ceramic system by comparing peak intensities attributed to the identified phases [54], the relative peak intensities between the three major phases in the 750-780 °C group suggested that lithium metasilicates continued to thrive within the glass-ceramic network while lithium disilicate and cristobalite crystals started to amass. Hence, for groups treated with temperature below 780 °C, including the not-fired group, lithium metasilicates were observed as the main crystalline phase, which verified the manufacturer’s claim that the IPS e.max® CAD bloc was a partially glassy-crystalline material.
Besides comparing relative XRD peak intensities within a group, peak intensities between groups were also evaluated. For example, the same crystalline phases that appeared at the same 2-theta positions in the XRD patterns of the not-fired, 530-590, 590-750, and 590-750
H14, and 750-780 °C groups showed peak-intensity variation. Perhaps, lithium metasilicate and lithium orthophosphate phases were the two best examples for demonstrating peak-intensity variation. For instance, the XRD peaks of lithium orthophosphate phase (marked as n in Figure 8) for the not-fired and 750-780 °C groups were more prominent as compared to the 590-750, and 590-750 °C H14 groups. There are two possible reasons that could lead to the peak-intensity variation for the lithium orthophosphates between groups. One, the presence of lithium orthophosphates was expected for the not-fired group since it was included as a nucleating agent according to the manufacturer. Its disappearance in the 530-590 °C group and the gradual reemergence through heating from 530-590 to 780 °C (see Figure 8, g, f, e, and d) were indicative that the growth of lithium orthophosphates could be induced, where its development was postulated to depend on how the phosphate ions could act as a lithium ion scavenger, resulting in the formation of lithium orthophosphate [34]. The XRD peaks of lithium metasilicate phase (marked as v in Figure 8) for the 530-590, 590-750, and 590-750 °C H14 groups were less prominent than the not-fired and 750-780 °C groups. Again, this gradual enlargement of the lithium metasilicates’ peak intensities indicated that the development of lithium metasilicates was postulated to be temperature dependent and to involve the epitaxial growth of lithium metasilicate on a lithium orthophosphate crystal [32, 55].