Increasing inter-generational social mobility: is educational
expansion the answer?
Franz Buscha* and Patrick Sturgis**
Abstract: Reforms which increase the stock of education in a society have long been held by policy-makers as key to improving rates of intergenerational social mobility. Yet, despite the intuitive plausibility of this idea, the empirical evidence in support of an effect of educational expansion on social fluidity is both indirect and weak. In this paper we use the raising of the minimum school leaving age from 15 to 16 years in England and Wales in 1972 to estimate the effect of educational participation and qualification attainment on rates of intergenerational social class mobility. Because, in expectation, children born immediately before and after the policy was implemented are statistically exchangeable, the difference in the amount of education they received may be treated as exogenously determined. The exogenous nature of the additional education gain means that differences in rates of social mobility between cohorts affected by the reform can be treated as having been caused by the additional education. The data for the analysis come from the ONS Longitudinal Study, which links individual records from successive decennial censuses between 1971 and 2001. Our findings show that, although the reform resulted in an increase in educational attainment in the population as a whole and a weakening of the association between attainment and class origin, there was no reliably discernible increase in the rate of intergenerational social mobility.
Keywords: social mobility; education; census; inter-generational; cohorts; England.
* University of Westminster, London, NW1 5LS, Email: [email protected]
Introduction
The level of intergenerational social mobility in a society is widely taken as a yardstick of its fairness and equality, outwardly signalling whether citizens achieve social and economic status through hard work and ability, or as a result of advantages bestowed upon them by their parents. The compelling argument that increasing social and economic fluidity between generations makes a society fairer is girded by a more instrumental economic discourse; that the allocation of individuals to occupations on the basis of merit is a more efficient use of the available ‘talent pool’. In a socially fluid society, therefore, jobs will be filled by individuals possessing the most suitable attributes to undertake them, with higher levels of economic output and productivity accruing as a result. By implication, then, increasing social mobility should yield benefits, not only for deserving individuals but for society as a whole (Heath 1981; Payne 1987; Swift 2004).
Thus it is that social mobility has become the key motif of the current political epoch, with politicians on both left and right in the UK now championing it as a core policy objective. The prominence of social mobility as an issue of contemporary public and political debate is well illustrated by the fact that between 2008 and 2012 alone, six government or parliamentary reports were published on the subject (Saunders 2012) and many more made direct reference to it as a subsidiary policy objective. The Labour governments of 1997 to 2010 were the first to place social mobility at the centre of their policy programme, encapsulating as the notion of social mobility did, New Labour’s emphasis on equality of opportunity rather than outcomes, and justifying the substantial investment in educational expansion, particularly, though not exclusively in the tertiary sector (Goldthorpe 2012). The centrality of social mobility as a guiding theme driving policy reform has, if anything, strengthened under the current government, with an explicit statement that improving intergenerational social mobility is its ‘principal social policy objective’ for the 2010 to 2015 parliament (HM Government 2011a).
In both academic and policy spheres, as well as amongst media commentators, education is seen as fundamental to achieving the apparently consensual goal of increasing social mobility (Ishida Müller and Ridge 1995). For example, thirteen of the seventeen indicators drawn up by the government to monitor short to medium term progress in increasing social mobility, are measures of educational attainment across the life-cycle (HM Government 2011a). Similarly, much of the rationale and justification for educational policy reform is framed around narratives of improving social mobility. The increase in the minimum age of participation in education and training to seventeen in
2013 (and to eighteen by 2015), for instance, is described in a Department of Education strategy document as ‘central to our ambitions to improve social mobility’ (HM Government 2011b: 2). This emphasis on the key role of educational expansion in increasing social mobility is based on two linked empirical regularities; educational attainment is highly predictive of socio-economic achievement (Breen et al. 2009; Hunt and McIntosh 2007; Walker and Zhu 2013) and socio-economic origin is highly predictive of educational attainment (Shavit and Blossfeld 1993; Goodman et al 2009; Blanden and Machin 2010). Eliding these two robust associations into a single mechanism leads to the intuitively appealing inference that public policy must focus on weakening the link between socio-economic origins and educational achievement, if social mobility is to be increased.
However, the idea that increasing the stock of education in a society will enhance intergenerational mobility must accommodate an apparent empirical paradox (Boudon 1974); despite major expansion in the mass education system during the twentieth and early twenty-first centuries, social fluidity in the UK appears hardly to have changed at all (Goldthorpe and Mills 2004; Goldthorpe and Jackson 2007; Paterson and Ianelli 2007) and may actually have declined somewhat on some measures (Blanden et al. 2004). And while the exact trend in post-war social mobility in the UK remains a source of some disagreement (Blanden, Gregg and Macmillan 2013; Goldthorpe 2012; Lambert, Prandy and Bottero 2007), one thing at least seems evident; there has not been an increase in social fluidity commensurate with what might be expected given the scope of educational reform and expansion during the period under examination (Saunders 2010; Breen 2010). Be that as it may, however, the very broad time frame over which this comparison between social mobility and educational expansion has been made, as well as the rather indirect nature of the contrast, means that little is currently understood about whether and how specific educational reforms have affected social mobility in the past. Nor, as a consequence, do we adequately understand how policies might best be designed and implemented to achieve this objective in the future.
Our objective in this paper is, therefore, to shed light on the question of whether policies which are intended to increase the stock of education in a society impact on rates of intergenerational social mobility. Specifically we estimate the effect of the raising of the statutory minimum school leaving age in 1972 from 15 to 16 years in England and Wales on educational attainment and, subsequently, on rates of social mobility. Although the effects of this policy change have already been studied extensively in economics, our
research makes two important and novel contributions. First, while existing studies have used variation in the statutory school leaving age to estimate the causal effect of education on employment propensity and earnings in adulthood, we assess for the first time whether it had a discernible effect on intergenerational social class mobility. Second, while existing studies have estimated population average effects of the change in the school leaving age on educational attainment, our analysis is the first to decompose the observed effects by the socio-economic origins of those affected by the policy change. This is an important innovation, because it seems unlikely that the effect of the reform would have been experienced uniformly across the distribution of socio-economic origin states. We might anticipate, for instance, that the education gain would be smallest for those from more advantaged backgrounds, because the majority of this group would have stayed at school beyond their fifteenth birthday anyway. And, by the same token, any effects that are observed should be expected to be more substantial amongst those from less materially advantaged backgrounds, because a larger proportion of this group would have left school at a younger age if the policy had not been introduced. Whether the educational reform had this kind of asymmetric effect is of interest in its own right. However, it is particularly germane to an assessment of whether the reform resulted in an increase in social fluidity. This is because an educational reform should only be expected to have this effect if it equalizes educational attainment between groups from different social class origins, or if it changes the composition of social class groups achieving qualifications that differ in the strength of the intergenerational class association (Breen 2010).
2. Social class mobility and the role of education
Although political and media attention to social mobility is a comparatively recent phenomenon, empirical analysis of intergenerational class inequality dates back to the 1950s, when David Glass carried out the first nationally-representative study of occupation-based mobility trends over the first half of the twentieth century (Glass 1954). The evidence from the 1949 survey on which this study was based showed that class mobility had remained more or less constant, despite the significant changes that had taken place in the education system and the broader social structure during this period. This finding was strongly counter to expectations at the time, because the research was undertaken not long after the implementation of the 1944 Education Act, which had
been intended and widely anticipated to improve the life chances of those from less advantaged backgrounds.
Subsequent work by John Goldthorpe and other sociologists in the 1980s showed that an increase in mobility had taken place in the thirty years following the end of World War II (Goldthorpe, Llewellyn and Payne 1980; Heath 1981; Goldthorpe and Payne 1986). The rapid expansion of professional and managerial occupations that the UK experienced as it evolved from an agricultural and manufacturing society towards a service-based economy resulted in rapid growth in non-manual occupations, producing ‘more room at the top’ and, therefore, a substantial increase in upward mobility over time. It is important to distinguish here, however, between absolute and relative measures of social mobility. Absolute mobility is the simple difference between an individual’s socio-economic position in adulthood and that of his or her parents when the individual was a child (usually taken at age 14). Absolute mobility makes no adjustment for structural change in an economy over time and, thus, will necessarily change if the ratio of middle to working class jobs in an economy alters, as was the case in Britain and most western democracies in the middle part of the twentieth century (Goldthorpe, Llewellyn and Payne 1987). Relative mobility, in contrast, adjusts for changes in the occupational composition of an economy over time, yielding measures which denote the relative chances of different socio-economic destinations across the distribution of origin states. In conventional social mobility analysis in the sociological tradition, relative mobility is assessed by taking ratios of odds in cross-tabulations of origin and destination social class groups (Erikson and Goldthorpe 1985; Breen 2010). This enables an expression of the relative chances of moving between different social class groups, conditioning on changes in the marginal distribution of the origin and destination states across periods (Goodman 1978; Erikson and Goldthorpe 1992).
Goldthorpe and colleagues showed that, although absolute mobility had increased in the post war decades, relative mobility had hardly changed at all, or at least not in a way that could be characterised as approximating a linear trend, the so-called constant fluxpattern (Erikson and Goldthorpe 1992). Thus, despitemajor changes to the educational system, the social class structure, and the industrial composition of the UK economy, the chances of children from disadvantaged backgrounds moving into managerial and professional occupations, relative to their more advantaged contemporaries, remained essentially unaltered. Although hampered by a scarcity of suitable data sets containing the necessary variables for mobility analysis, subsequent
investigations have found that this basic pattern continued into the later decades of the twentieth century and the first decade of the twenty-first century, though with some indication of a slight increase in relative mobility and a decrease in absolute mobility (Golthorpe and Mills 2008; Li and Devine 2011).
An important implication of approaching social mobility from a relative rather than an absolute perspective is that, for educational expansion to alter the association between class origin and destination states, the increase in educational attainment must be differential across the distribution of origin states. This is because it is not ‘absolute’ educational attainment that determines one’s position in the occupational hierarchy but where one stands in the ranking of educational achievement. Thus, if the amount of additional education introduced by a policy intervention is experienced uniformly across the population, then no change in the educational ranking will have occurred and social mobility will be unaffected. If, however, the policy change succeeds in reducing the strength of the association between social class origin and educational attainment then equalization will have occurred and social fluidity might be expected to increase as a result (Breen and Jonsson 2005; Breen 2010).
A second way in which fluidity can be increased through educational expansion is when a policy reform has the effect of shifting individuals from less advantaged backgrounds into educational attainment levels at which the association between class origins and destinations is weaker than at lower levels of attainment (Hout 1988). For instance, if a policy change has the effect of increasing the proportion of adults from working class backgrounds with degrees, and the association between origin and destination states is weaker for graduates than for non-graduates, then this policy should, ceteris paribus, have the effect of increasing social fluidity.
3. The Raising of the School Leaving Age
The statutory school leaving age has been increased twice in England and Wales since the Second World War, in 1947 and 1972. The Education Act of 1944 increased the minimum age at which children could legally exit the school system from 14 to 15 on the 1st of April 1947. The 1944 Act also gave future governments the power to raise the
school leaving age by a further year, to 16, as soon as it was deemed practicable to do so (Education Act, 1944). Following a long hiatus, this was implemented in 1971 and, from September 1972, all children attending school in England and Wales were required to stay on until the age of 16.i The 1972 Raising of the School Leaving Age (RoSLA), in
principle at least, therefore affected all individuals born on or after 1 September 1957. Anyone born after this date was legally required to receive a minimum of eleven years of schooling, while those born before it were subject to a minimum of ten years. The national coverage of the school system in England and Wales means that these changes were implemented with no regional or temporal variation, in contrast to similar changes enacted within the education systems in the United States and other countries.ii
The analytical appeal of RoSLA events is that they induce an exogenous increase in the quantity of education received by a population and so the estimated effects of the additional education on other outcomes can be interpreted as causal (Angrist and Krueger 1991; Harmon and Walker 1995). The increase in education following a RoSLA event can be considered exogenous because it is not subject to individual choice. Rather, it is determined solely by whether an individual was born before or after the date which determines school cohort allocation in the year the policy was implemented. Because it is very unlikely that this assignment rule (date of birth relative to school cohort assignment date) is itself directly causally related to later life outcomes such as employment status, social class, and earnings, it can be used to identify the causal effect of the additional education on these outcomes (Harmon and Walker 1995; Devereux and Hart 2010; Grenet, 2013).
In the UK, Harmon and Walker (1995) estimated a 15 percent increase in hourly earnings for each additional year of education. Subsequent studies supported the conclusion that the RoSLAs in England and Wales significantly increased the amount of schooling undertaken and that this additional education resulted in an increased probability of being in employment (Dickson and Smith 2011), and of higher hourly earnings (Oreopoulos 2006; Grenet 2013; Devereux and Hart 2010) in adulthood. Non-economic outcomes were also affected by the 1972 RoSLA, with evidence showing a reduced probability of teenage pregnancy (Wilson 2012), better self-reported health (Siles 2009) and a reduced probability of criminal conviction (Machin et al. 2011), although null results have also been reported for self-reported health (Clark and Royer 2010) and voting (Milligan, Moretti and Oreopoulos 2004).
While the evidence seems clear, then, that these policy changes increased the stock of education undertaken by the population as a whole, no existing study has been able to examine whether the magnitude of the increase differed according to the socio-economic origin of the individuals affected by the policy change. In large part, this is because the data sets used for estimating these effects contain no information about the
socio-economic origins of the cohorts affected by the reforms. As we noted earlier, though, it seems unlikely that the effects would be entirely uniform, because a disproportionate number of children from more advantaged backgrounds would likely have stayed at school until or beyond their sixteenth birthday in the absence of the reform. Concomitantly, it seems probable that those from the least advantaged backgrounds, who were most likely to leave school at 15 prior to the reform, would benefit the most. In the following section, we describe how the data source that we use in this study enables us to evaluate whether the effect of the 1972 RoSLA was asymmetric across socio-economic origin states, as well as whether it affected the social class destinations of those affected by the reform.
4. Data and measures
We use the Office of National Statistics Longitudinal Study (LS). The LS is a 1 percent sample of the population of England and Wales, with individual records linked across successive censuses between 1971 and 2001iii. The LS was initially created from the 1971
and 1981 censuses by selecting all individuals born on one of four (undisclosed) birth dates and linking records across years at the individual level. This procedure has been repeated at each subsequent census, using the same four birth dates, with the records for the same individuals linked across years and new members joining if they are born, or have emigrated to England and Wales from another country, since the previous census. Data linkage ceases if a study member dies or emigrates from England and Wales. The LS thus provides representative cross-sectional and longitudinal information about the population of England and Wales for the years 1971, 1981, 1991, and 2001.
The LS has a number of advantages over other potential data sources for our purposes here. First, it has an extremely large sample size, with 289,335 individuals present in both the 1971 (as children) and 2001 (as adults) waves. Second, due to the census’ high rates of compliance and linkage rates of approximately 95 percent from one census to the next, it has excellent coverage of the target population. And third, it is possible to link the census records of all other individuals who were enumerated in the LS member’s household to the LS member’s records. This so-called ‘non-member’ information is a key feature of our analysis because it can be used to derive a high-quality measure of the socio-economic origin of LS members, via the occupation of co-resident parents recorded when the LS members were children. The ability to link records within households means that it is not necessary to rely on the potentially error-prone
recollections of adult respondents about what their parents’ occupations were decades earlier, as is usually required in studies of intergenerational class mobility. We use the occupation of LS members’ fathers to derive our measure of socio-economic origin. Where the father was not in employment, or where a father is not present in the household, we take the mother’s occupation instead.
This approach means that parental information for 2001 LS members is only available for those who were co-resident with at least one parent at the time of the 1971 census. The rate of missing parental information therefore increases substantially for 2001 LS members who were 16 or above in 1971, as this is the age at which people generally begin to leave home. Our data shows that parental occupation is available for over 96 percent of LS members born after 1954 (which corresponds to being aged 16 or younger in 1971) and that the rate of missing parental information rises rapidly for individuals born prior to this date. The mean age of the parents of the LS members who were born during this period was 42.8 (44.3 for fathers and 41.8 for mothers) and the mean age of the LS members in 2001 was 44. The fact that both LS members and their parents were in their forties at the time their occupations were observed means we can be confident that our estimates of intergenerational mobility should not be adversely affected by observing occupation at too early, or too late a point in the life course (Black and Devereux: 2010).
Social class and status
The theoretical and conceptual status of alternative measures of social class and status continue to be the source of disagreement within the social stratification literature (Bukodi, Dex, and Goldthorpe 2011). We do not seek to contribute to these debates here. Rather, we undertake the same analyses using both a categorical measure of social class and a continuous measure of social status. For the categorical measure of social class we use the Registrar General’s Social Class (RGSC) classification.iv For the continuous
measure of social status, we use the Cambridge Social Interaction and Stratification (CAMSIS) scale (Prandy and Lambert 2003).Due to limitations of space, we present results for CAMSIS only because using a continuous measure of socio-economic position means that we are able to use linear rather than a logistic link function, which makes presentation and interpretation of results more parsimonious. However, the findings are substantively unaltered when using loglinear models fitted to RGSC. Results for the RGSC analyses are available from the corresponding author upon request.
CAMSIS is derived from a multiple correspondence analysis of cross-classified tables representing the occupations of individuals and their spouses, or cohabiting partners. The cells of this table represent the frequency of marriage/partnership between different occupational unit groups taken from the standard occupational coding classification. The data used to produce the CAMSIS scale are taken from the decennial census, via the Sample of Anonymised Records (SARs). The large sample size of the SARs means that the full 3 digit standard occupational unit group coding can be used to produce a more fine-grained measure than would be possible using a data set with fewer observations.
New CAMSIS scales are derived for each census year to take into account the changing nature of occupational prestige over time. CAMSIS is an inherently relative measure of socio-economic position because it is not possible for the total stock of occupational prestige in a society to change over time, only the relative ranking of individuals and occupations within the status hierarchy. To make CAMSIS more readily comparable cross-nationally and over time, it is rescaled so that the mean for the population is set to 50, with a minimum of 0, a maximum of 100, and a standard deviation of 15. CAMSIS is strongly correlated with a range of important indicators of social and material advantage, such as earnings, education, health, job satisfaction, and political engagement (Blanden et al 2009).
Educational Attainment
The UK education system at the time of the 2001 census required a minimum of 11 years of schooling. Children started primary school at age 5 and continued until the end of lower secondary school at age 16. An additional (non-compulsory) two years of schooling could then be pursued in preparation for A level examinations, which are the standard requirement for entry into higher education in England and Wales. Alternatively, following completion of compulsory education at age 16, individuals could pursue a range of vocational qualifications at colleges of Further Education, generally lasting for one or two years.
In the 2001 Census, respondents were asked to indicate which of 12 academic and professional qualification levels they had achieved. These qualification indicators were then converted to a highest qualification variable according to the 2001 National Vocational Qualifications (NVQ) framework (QCA, 2001), as set out in Table I. The NVQ framework is based on occupational standard competencies for a given job role. At
its core the NVQ framework replicates the previously outlined educational stages of upper and lower secondary school and higher education.
TABLE I HERE
Analysis
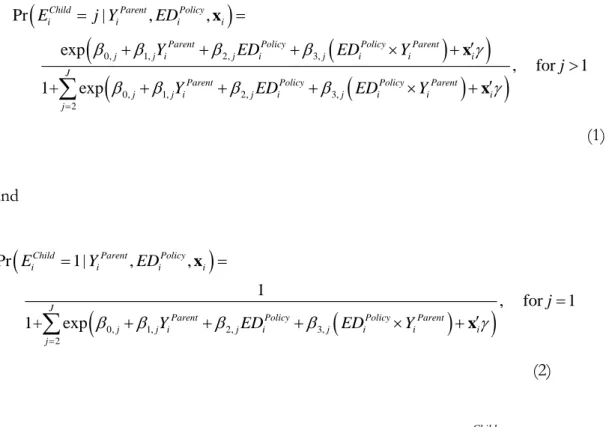
To assess how the 1972 RoSLA affected educational attainment we define the following multinomial logistic regression (McFadden 1973):
0, 1, 2, 3, 0, 1, 2, 3, 2 Pr | , , exp , for 1 1+ expChild Parent Policy
i i i i
Parent Policy Policy Parent
j j i j i j i i i
J
Parent Policy Policy Parent
j j i j i j i i i j E j Y ED Y ED ED Y j Y ED ED Y
x x x (1) and
0, 1, 2, 3,
2 Pr 1| , , 1 , for 1 1+ expChild Parent Policy
i i i i
J
Parent Policy Policy Parent
j j i j i j i i i j E Y ED j Y ED ED Y
x x (2)where j are the previously mentioned education categories, is the highest qualification obtained in 2001 for LS member i, is the CAMSIS score of the parent of LS member i in 1971, is a dummy variable indicating whether LS member i was born after 31 August 1957 and is the interaction of the birth date dummy and parental CAMSIS score in 1971. is a vector of covariates with coefficients , which in this case are parental age in 1971 and Government Office Region. 𝛽1 captures the effect of social origin on a child’s educational attainment, change in educational attainment due to the raising of the school leaving age is captured by ,
Child i E Parent i Y Policy i ED
Policy Parent
i i ED Y i x 2 whilst identifies whether change in educational attainment due to the raising of the school leaving age varied according to the social origin of the LS member.
We can use the same general approach to estimate the effect of the 1972 education reform on intergenerational mobility by estimating, via ordinary least squares, the following expression:
0 1 2 3
Child Parent Policy Policy Parent
i i i i i i i
Y Y ED ED Y x (3)
Here , which is the CAMSIS score for LS member i in 2001, replaces educational attainment as the outcome in equations (1) and (2). now captures the effect of RoSLA on the conditional intergenerational CAMSIS correlation between parents and children and gauges the extent to which change in the intergenerational CAMSIS correlation due to RoSLA differed across the distribution of socio-economic origin states. Because specification of a linear interaction in (or ) is unnecessarily restrictive, we transform into quintile groups and include these as dummy variables in the regression where the omitted variable is quintile group 5 (those in the ‘best off’ quintile).v
Where our specification includes dummy variables the effect of is split over four parameters with one parameter acting as the reference parameter. In either case, the interpretation of these parameters remains the same; they measure the extent to which the raising of the school leaving age reform differentially affected children from different social origins conditional on their origin group.
These two models could, in principle, be combined to produce an instrumental variable (IV) estimate using a structural model, where the IV estimate is the ratio of the reduced form coefficients in equations (1), (2) and (3). However, this approach is complicated by the non-linear link function that is used in models (1) and (2), where education is measured as a categorical variable whilst CAMIS is measured as a continuous variable (Bourguignon, Fournier and Gurgand 2007). We limit our an analysis to the two cohorts on either side of the 1972 discontinuity; LS members born in 1955 and 1956 are coded 0 in the dummy while those born in 1958 and 1959 are given the value 1. We also exclude all those born in 1957 to rule out the possibility of confounding due to within cohort educational differences.vi The idea that the children
born either side of the date the policy change was implemented are, in statistical terms,
3 Child i Y 2 3 3 3 Parent i Y 3 Policy i ED
‘exchangeable’ becomes less plausible the further birth dates are from the school census date. Taking the 1972 RoSLA as an example, it seems reasonable to assume that the group of children born on the 31st of August 1957 are, in expectation, no different in
their probability of various future social and economic outcomes, compared to the group who were born a day later. Thus, if we observe a difference between these two groups on a later outcome, we can be confident that it results from the different amounts of education that the two groups received as a result of the policy change. However, as the birth dates which define the ‘before’ and ‘after’ groups move further in time from the 1st
September discontinuity, the exchangeability assumption becomes less plausible because the possibility of confounding due to macro-level events and life-cycle factors increases. In the current context, a ‘bandwidth’ of two years on either side of the education discontinuity provides an optimal trade-off between proximity to the educational reform and precision of estimates. Sensitivity tests using bandwidths of 1 and 3 years showed very similar results and do not materially alter our conclusions. Results for these specifications can be found in the appendix.
6. Results
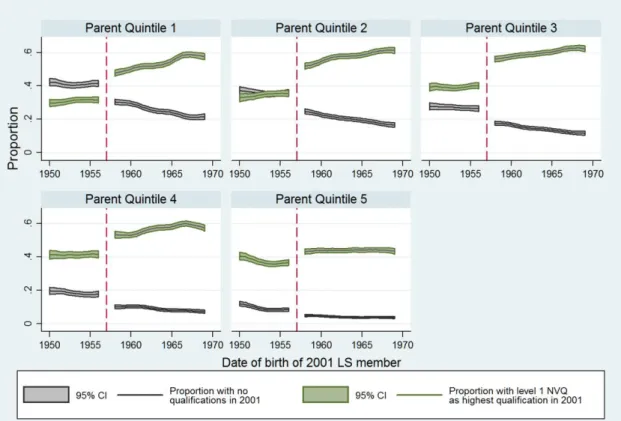
We begin by presenting visual depictions of the effect of the 1972 RoSLA on educational attainment. Figure I plots, by year of birth, the proportion of adults in the 2001 census born between 1950 and 1970 who reported a) no formal qualifications (grey lines) and b) one or more GCSE/O’ levels as their highest qualification (green lines). The dashed red vertical line represents the point at which the school leaving age was increased from 15 to 16. Two things are immediately apparent from Figure I. First, the CAMSIS origin quintile groups differ substantially in their level of educational attainment, both before and after the school leaving age was increased. And second, all quintile groups experienced increases in their educational attainment following the reform. The proportion with no qualifications dropped notably after the reform in all groups, while the proportion with at least one GCSE/O-level increased concomitantly. Additionally, and importantly, the magnitude of the increase in educational attainment differs across the quintile groups; individuals from origin quintiles 2 and 3 exhibit larger increases compared to those at the top and the bottom of the origin distribution. Those in quintile 5 (the most advantaged backgrounds) show the smallest increase in qualifications following the reform.
FIGURE I HERE
Figure 1, then, shows that the 1972 RoSLA significantly increased the stock of education in the population as a whole. That this was the case, however, was already well-known from the existing literature (Dickson and Harmon 2011). What Figure I shows for the first time is that the impact of the reform differed as a function of the economic background of those affected by it. Those in the middle of the socio-economic origin distributionvii experienced the most substantial increase in qualification
attainment, while those at the top experienced the least. This pattern accords with our a priori expectation that a high proportion of children from socio-economically advantaged households would be largely unaffected by the change in the school leaving age because they would have stayed at school until or beyond their sixteenth birthday in any event. Although we had not anticipated this, it may also be the case that children from the least advantaged households were most likely to defy the new legislation and leave school at 15 or younger, leaving those in the middle of the distribution to gain the most.
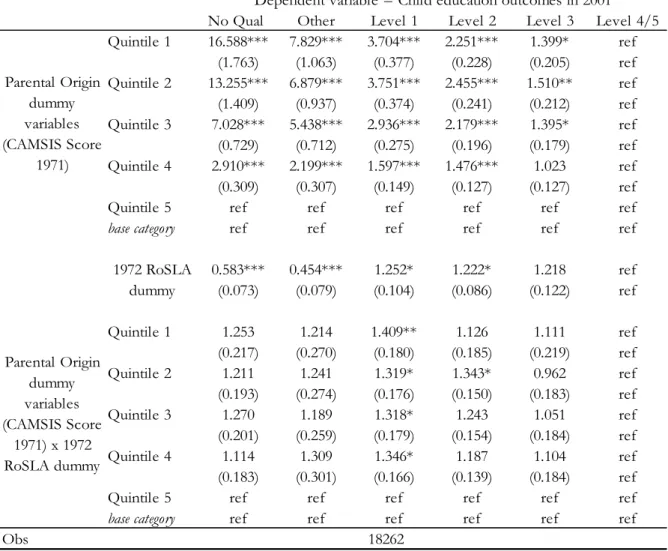
To formally test these effects we fit the multinomial logit model in equation (1). Table II presents the parameter estimates for this model, confirming the well established fact that qualification attainment is strongly related to social background. For example, the odds of children in quintile 1 reporting no qualifications in 2001 are 16 times greater than for those in quintile 5 (the base category), while individuals in quintile 5 are significantly more likely than any other quintile group to attain a level 4 or level 5 qualification. Similarly, those in the middle of the socio-economic origin distribution are most likely to attain ‘mid-ranking’ qualifications, with quintile 2 having the highest odds of reporting level 1 to 3 qualifications as their highest level of attainment.
TABLE II HERE
The coefficient for the RoSLA dummy confirms that the reform had a substantial effect on raising educational attainment, with the odds of ‘no qualifications’ and ‘other qualifications’ as the highest qualification approximately halving, and the odds of the highest qualification being at Level 1 or above increasing by approximately a quarter. In addition to this general increase in educational attainment, the interaction terms between the CAMSIS quintiles and the RoSLA dummy confirm statistically what Figure I showed visually; that the magnitude of the attainment gain differed significantly according to the
social background of the cohort member. Those in quintiles 1 to 4 were significantly more likely to report Level 1 as their highest qualification compared to those in quintile 5 (the base category), after the raising of the school leaving age. In other words, above and beyond the general increase that all individuals experienced from the education reform, individuals from poorer social origins, relative to the highest social origin, experienced an additional increase in education. Additionally, LS members from quintile 2 were more likely to obtain a Level 2 qualification after the reform compared to those from the top and the bottom of the socio-economic origin distribution. Thus, Table II shows that the reform not only increased educational attainment for the population as a whole but also resulted in a weakening of the association between attainment and socio-economic origin. It therefore succeeded in creating the necessary conditions for a subsequent increase in social fluidity, to which we turn next.viii
The impact of the 1972 RoSLA on relative intergenerational social mobility
We now turn to the reduced form model specification in equation (2) which uses the 1972 RoSLA to estimate the effect of the exogenously induced increase in education on intergenerational mobilityix. The key coefficient in this equation is the interaction
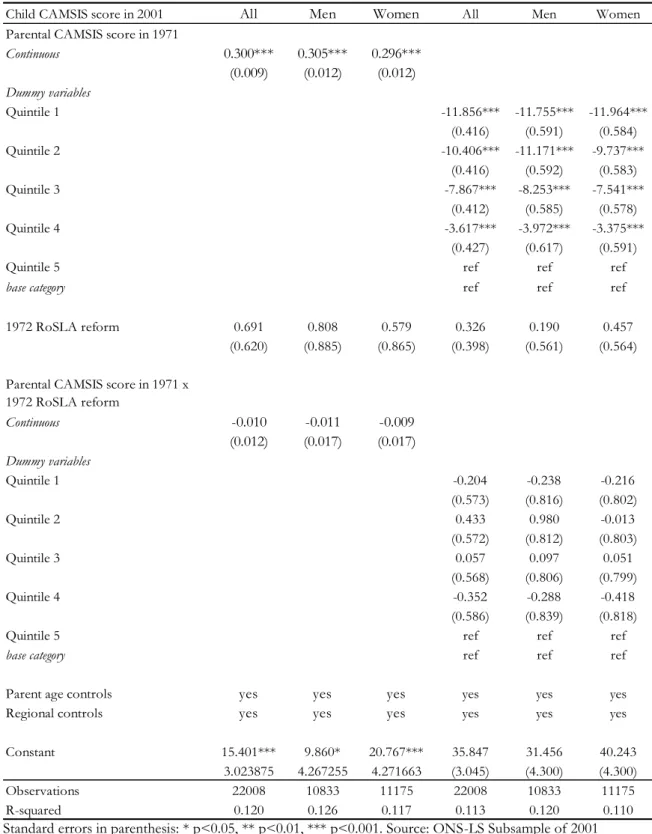
between social origin (parental CAMSIS) and the RoSLA dummy because this denotes the change in the intergenerational correlation for the two cohorts immediately before and after the school leaving age was increased. The parameter estimates for this model are presented in Table III. The first three columns of Table III show estimates from equation (2) with CAMSIS included in continuous form for the sample as a whole, and then separately for men and women. Columns 4 to 6 repeat the first three models but with parental CAMSIS included as quintile group dummies.
TABLE III HERE
Considering models 1 to 3, in which socio-economic origin is treated as continuous, we find no evidence that the additional education induced by the 1972 RoSLA had any effect on relative intergenerational mobility. Although the interaction terms for the sample as a whole and for men and women separately are negative, denoting an increase in fluidity, they are not significantly different from zero. However, as we saw in Table II, the effects of the 1972 RoSLA were differentially related to socio-economic origin, with those in the middle of the distribution gaining the most and those at the top gaining the
least. To test for nonlinearity in the effect of the reform we re-estimate equation (2) with parental CAMSIS score split into quintile groups. Using this specification there is some suggestion that those from the middle of the socio-economic origin distribution – here defined as quintile groups 2 and 3 – experienced upward mobility when compared to quintile groups 1 and 4/5, with the interaction coefficients being positive for these groups and negative for the others. Again, however, none of the interactions can be reliably distinguished from zero. And, moreover perhaps, even if these estimates were significantly greater than zero, they are still small in magnitude, indicating that the impact of the 1972 RoSLA reform on relative intergenerational mobility was, at most, negligible. Those from less advantaged socio-economic backgrounds remain considerably more likely to have lower occupational status in 2001 and those from more advantaged backgrounds maintain the highest occupational outcomes. It can thus be concluded that, although the education reform of 1972 increased the average length of time in education, reduced the proportion leaving school with no qualifications, and reduced socio-economic inequality in educational attainment, it had no discernable effect on social fluidity.
Discussion
Over the course of the past 15 years, intergenerational social mobility has come to dominate public and political debate in a manner seldom witnessed for a concept whose origin lies in the academic sociological literature. Spurred by the widespread belief that social mobility in the UK has ‘ground to a halt’ and is lower than in comparator nations, politicians on both sides of the political spectrum blame one another’s historic policies for creating the current situation and propose remedies to improve matters in the future. The current government has enshrined its commitment to improving social mobility through the creation of a Social Mobility and Child Poverty Commission, with a remit of monitoring and reporting on progress on a range of social mobility indicators and holding the government’s ‘feet to the fire’ if adequate progress is not made (Child Poverty Act 2010). In addition to establishing this Commission, all government departments are now required to consider the potential impact on social mobility of any new policies they propose. Increasing social mobility has thus become an archetypal ‘valence issue’, in the sense that all parties consider it to be an important and desirable outcome, the only question for the electorate is, which party is managerially competent to deliver it (Clarke et al 2004)
The policy framework that has been established to produce a more socially fluid society is heavily dependent on educational reforms at different points in the life-course. The government’s ‘social mobility strategy’ seeks to improve and equalize educational outcomes from the early stages of infant development, through early-years, primary, and secondary education, and into the further and tertiary sectors (Cabinet Office 2013). As a key part of this agenda, the age at which young people can move from education and training into full-time employment was raised from 16 to 17 in 2013 and will increase again by an additional year in 2015. This significant change to the statutory framework of compulsory education is described by the government as ‘central to our ambitions to improve social mobility’ (HM Government 2011b). Yet, the evidence to support the idea that educational expansion of this kind will deliver an increase in social mobility is, at best, weak. There is a large and robust body of research which shows that educational attainment is strongly predictive of obtaining and maintaining socio-economic advantage (Devereux and Hart 2010; Shavit and Blossfeld 1993). And there also exists a similarly robust set of findings which demonstrate that educational attainment is very strongly related to the socio-economic circumstances into which an individual is born (Hout, 1988; Blanden et al. 2013). However, it is quite a leap from these empirical regularities to the conclusion that policies which expand the stock of education in society will eventually produce greater social fluidity between generations. As scholars in the sociological tradition have observed, social class fluidity appears to have remained stubbornly resistant to change during the course of the twentieth century (Boudon 1974; Goldthorpe et al. 1987; Goldthorpe and Mills 2004), despite the many and varied expansionist educational reforms that were enacted during this period (Breen 2010).
Yet the aggregate and long-term nature of this comparison is itself rather unsatisfactory, for it is surely possible that specific educational reforms did have an impact on fluidity for particular cohorts, at particular points in time, while others did not. Simply observing that aggregate fluidity has not increased linearly over time does not preclude this possibility. Indeed, a variable impact of different educational policy reforms over time could well give rise to the sort of ‘trendless fluctuation’ in relative mobility rates that scholars have often observed (Erikson and Goldthorpe 1992). In this paper, we have sought to address this lacuna in the existing evidence base by evaluating the causal impact of a specific educational reform on subsequent social mobility. Focusing on the 1972 raising of the school leaving age from 15 to 16 years in England and Wales, our results show that the policy change succeeded in creating the minimal conditions
considered necessary for increasing social fluidity. That is to say, in addition to increasing the total stock of education in the population as a whole, the policy also equalized educational attainment between social class origins. This equalization effect occurred because those from the most advantaged backgrounds showed the smallest gain in attainment, while those in the middle of the socio-economic origin distribution showed the largest improvement. Counter to our initial expectations, the largest educational gains were not found amongst those from the least advantaged backgrounds. We have no empirical leverage on why this should have been the case, although we speculate that those from the least advantaged backgrounds may have disproportionately ignored the new legislation and left school before their sixteenth birthday.
The new policy also changed the composition of social class groups at different levels of qualification attainment, with a significant increase amongst those in the middle of the socio-economic origini distribution obtaining level 1 and level 2 qualifications. This compositional change at different qualification levels also opens up the possibility that the reform might have resulted in greater fluidity, if the origin/destination association is weaker at the higher qualification level than at the levels below, which in this case are ‘other qualifications’ and ‘no qualifications’.
However, even though the 1972 RoSLA established these minimal conditions for an increase in social fluidity, we find no evidence to suggest that it actually had such an effect. Although the pattern of the coefficients is suggestive of a change in fluidity as a result of the reform, in the sense that the groups which experienced the largest education gain had positive signed coefficients (indicating upward mobility) and the groups which experienced the smallest education gains had negative signed coefficients (indicating downward mobility), none was significantly different from zero. This same basic pattern of results is obtained when the bandwidth around the RoSLA event is altered to one and to three years, when the number of quantile groups is changed to four or six and when using log-linear models applied to the categorical Registrar General’s measure of social class position. The very large sample size on which our analysis is based also means that we can exclude the possibility that we have insufficient statistical power to reliably detect in our sample a substantive change in the broader population. We can, in sum, be confident that our results are not an artefact of research design, of measurement operations, or of analytical specification: the educational expansion engendered by the 1972 reform had no effect on intergenerational social mobility.
There are a number of possible reasons that might explain why this was the case. First, although the reform equalized educational attainment across the distribution of origin states, the magnitude of the change may have simply been too small to have a subsequent effect on the relative chances of occupational upgrading. Similarly, the compositional change within qualification levels may not have moved sufficient numbers from less advantaged backgrounds to educational levels at which the origin destination-association is weaker. The vast majority of the educational gain was at NVQ level 1 (equivalent to 1-4 GCSEs at grades A-C) and a small amount at NVQ level 2 (5+ GCSEs or 1 A’ level) and it is possible that the intergenerational correlation at these levels is the same, or not appreciably lower than at the qualification levels below. A third, unverifiable, possibility is that the higher social class groups responded to the equalization of human capital and credentials by drawing more heavily on their social networks and accumulated cultural capital to maintain their advantage in the job market. Be that as it may, whatever the exact reasons for the failure of the 1972 reform to increase fluidity, it seems clear that expansionist education policies cannot be assumed to lead inevitably, or in any straightforward manner, to higher rates of intergenerational social mobility. And this is so, even when they succeed in engendering compositional change across educational levels and in equalizing the distribution of educational attainment across social class groups. Policy-makers would be well advised to remember this fact when designing, implementing, and justifying expansionist educational policies in the future.
Notes
1 Some children could leave at age 15 if their birthday was in June, July or August.
1 In Scotland the minimum school leaving age was raised three years later on 1 September 1975. We therefore exclude Scotland from the following analysis and when referring to UK only include England, Wales and Northern Ireland in this definition.
1 The 2011 census has now been linked but does not form a part of this analysis.
1 The National Statistics Socio-Economic Classification (NS-SEC) is not available for the 1971 wave of the LS. A version of NS-SEC is available for subsequent waves, although this is not based on the full set of questions.
1 Specification checks show that our results are not sensitive to using 3 or 6 quantile groups.
1 The ONS-LS data does not include month of birth and children born in September have more schooling that those born in August due to school intake laws.
1 Which is represented by a series of five parental CAMSIS origin dummy variables.
1 We tested these results by gender and found no evidence of statistically significant differences
1 As mentioned previously, our CAMSIS measure of occupational prestige is standardised every census with a mean of 50 and standard deviation of 15 and we therefore inherently measure relative intergenerational mobility.
REFERENCES
Angrist J. and A. Krueger (1991) “Does compulsory school attendance affect schooling and earnings?” Quarterly Journal of Economics, Vol. 106, pp. 979-1014.
Black, S. and Devereux, P. (2011) "Recent Developments in Intergenerational Mobility,"
Handbook of Labor Economics, Elsevier.
Blanden J, Gregg P, Macmillan L. (2013) “Intergenerational Persistence in Income and Social Class: The Impact of Within-Group Inequality”. Journal of Royal Statistical Society Series A: Statistics in Society, Vol. 176, No. 2, pp. 541-563.
Blanden, J. and Machin, S. (2010) Intergenerational inequality in early years assessments.
In Children of the 21st Century: the First Five Years (eds K. Hansen, H. Joshi and S. Dex), pp.
153–168. Bristol: Policy Press.
Boudon, Raymond (1974) Education, Opportunity, and Social Inequality: Changing Prospects in Western Society, New York: John Wiley and Sons.
Bourguignon, F., Fournier, M. and Gurgand, M. (2007) “Selection Bias Corrections Based on the Multinomial Logit Model: Monte Carlo Comparisons”, Journal of Economic Surveys, Vol. 21, No. 1, pp. 174-205.
Breen, Richard. (2010) “Educational Expansion and Social Mobility in the Twentieth Century” Social Forces Vol. 89, No. 2, 2010, pp. 365-88.
Breen, Richard, and Jan O. Jonsson. 2005. “Inequality of Opportunity in Comparative Perspective: Recent Research in Educational Attainment and Social Mobility.” Annual Review of Sociology 31:223-43.
Breen, R., & Luijkx, R. (2004) “Social Mobility in Europe between 1970 and 2000” In R. Breen (Ed.), Social Mobility in Europe. (pp. 37-75). Oxford: Oxford University Press. Breen, Richard, Ruud Luijkx, Walter Müller and Reinhard Pollak. 2009. “Non-Persistent Inequality in Educational Attainment: Evidence from Eight European Countries.”
American Journal of Sociology 114(5):1475-521.
Bukodi, E. Dex, S. and Goldthorpe, J. (2011) The conceptualisation and measurement of occupational hierarchies: a review, a proposal and some illustrative analyses, Quality and Quantity, 45, 623-639.
Cabinet Office (2013) Improving Social Mobility to Create a Fairer Society, Deputy’s Prime Minister’s Office 29th April.
Child Poverty Act 2010, accessed from www.legislation.gov.uk 4/12/13
Clarke, H., Sanders, D., Steward, M., and Whiteley, P. (2004) Political Choice in Britain, Oxford University Press.
Devereux, P. and Hart, R. (2010) “Forced to be rich? Returns to compulsory schooling in Britain”, The Economic Journal, Vol. 120, pp. 1345-1364.
Education Act 1944, accessed from www.legislation.gov.uk 16/12/13.
Erikson, R. and Goldthorpe, J. H. (1985) “Are American Rates of Social Mobility Exceptionally High? New Evidence on an Old Issue”, European Sociological Review, Vol. 1, pp. 1-22.
Erikson R. and Goldthorpe J. (1992) The Constant Flux: A Study of Class Mobility in Industrial Societies, Oxford: Clarendon Press.
Goldthorpe, J. (2012) “Understanding – and Misunderstanding – Social Mobility in Britain: The Entry of the Economists, the Confusion of Politicians and the Limits of Educational Policy”, Barnett Papers in Social Research, Oxford Institute of Social Policy and Nuffield College, University of Oxford, January.
Goldthorpe, J. H., Llewellyn, C. and Payne, C. (1980) Social Mobility and Class Structure in Modern Britain, Oxford: Clarendon Press.
Goldthorpe, J.H and Payne, C. (1986) “Trends in intergenerational class mobility in England and Wales 1972-1983”, Sociology, 20: 1-24.
Goldthorpe, J. H. and Mills, C. (2004) Trends in intergenerational Class Mobility in Britain in the Late Twentieth Century, in R. Breen (ed.), Social Mobility in Europe, Oxford: Oxford University Press.
Goldthorpe, J. H. and Jackson, M. (2007) Intergenerational Class Mobility in Contemporary Britain: Political Concerns and Empirical Findings, British Journal of Sociology, 58: 526-46.
Goldthorpe, J. H., Llewellyn, C and Payne, C. (1987) Social Mobility and Class Structure in Modern Britain, 2nd ed., Oxford: Clarendon Press.
Goodman, L. (1978) Analyzing Qualitative/Categorical Data: Log-linear Models and Latent Structure Analysis, Cambridge, Abt.
Goodman, A., Sibieta, L. and Washbook, E. (2009) Inequalities in educational outcomes among children aged 3 to 16. Final Report. National Equality Panel, Institute for Fiscal Studies, London.
Grenet, J. 2013. “Is Extending Compulsory Schooling Alone Enough to Raise Earnings? Evidence from French and British Compulsory Schooling Laws”, The Scandinavian Journal of Economics, Vol. 115, no. 1 (January), pp. 176-210.
Harmon, C. (2011) “Economic returns to education: What we know, what we don’t know and where we are going – Some brief pointers”, IZA policy paper no. 29. August. Harmon, C. and Walker, I. (1995) “Estimates of the economic return to schooling for the United Kingdom”, American Economic Review, Vol. 85, No. 5, pp. 1278-1286.
HM Government (2011a) Opening Doors, Breaking Barriers: A Strategy for Social Mobility. London: Cabinet Office.
HM Government (2011b) Building Engagement, Building Futures: Our strategy to maximise the participation of 16-24 year olds in education, training and work. London: Cabinet Office.
Hout, Michael. 1988. “More Universalism, Less Structural Mobility: The American Occupational Structure in the 1980s.” American Journal of Sociology 93(6):1358-400.
Hunt, S. and McIntosh, S. (2007) “Raising the Participation Age: An Assessment of the Economic Benefits”, DCSF Research Report No. 26, November.
Ishida, H., Muller, W. and Ridge, J. (1995) “Class Origin, Class Destination, and Education: a Cross-National Study of Ten Industrial Nations.” American Journal of Sociology, Vol. 101, pp. 145-93.
Lambert, P., Prandy, K. and Bottero W. (2007) “By slow degrees: Two centuries of social reproduction and mobility in Britain”, Sociological Research Online, Vol. 12, No. 1.
Li, Y. and Devine, F. (2011) Is Social Mobility Really Declining? Sociological Research Online,
16 (3) 4.
McCulloch, G., Cowan, S. and Woodin, T. (2012) “The British Conservative Government and the raising of the school leaving age, 1959–1964”, Journal of Education Policy, Vol. 27, pp. 509-527.
Milligan, K., Moretti, E and Oreopoulos, P, (2004) “Does education improve citizenship? Evidence from the United States and the United Kingdom”, Journal of Public Economics, Vol. 88 (9-10), pp 1667-1695.
Nicoletti C., and Ermisch J. (2007) “Intergenerational earnings mobility: Changes across cohorts in Britain”, B.E. Journal of Economic Analysis & Policy, Contributions, Vol.7, No. 2, pp. 1-36.
Paterson, L. and Ianelli, C. (2007) Patterns of Absolute and Relative Social Mobility: a Comparative Study of England, Wales and Scotland, Sociological Research Online, 12 (6) 15. Payne, G. (1987) Mobility and Change in Modern Society, London: Macmillan.
Prandy, K. and Lambert, P. (2003) “Marriage, social distance and the social space: an alternative derivation and validation of the Cambridge Scale”, Sociology, Vol. 37, pp. 397-41.
Saunders, P. (2011) Social Mobility Myths, London: Civitas.
Saunders, P. (2012) “Social Mobility Delusions: Why so much of what politicians say about social mobility is wrong, misleading or unreliable”, Civitas discussion paper. Shavit, Yossi, and Hans-Peter Blossfeld. Editors. 1993. Persistent Inequality: Changing Educational Attainment in Thirteen Countries. Westview Press.
Siles, M, (2009) “The causal effect of education on health: Evidence from the United Kingdom”, Economics of Education Review, Vol. 28, pp. 122-128.
Swift, A. (2004) “Would Perfect Mobility be Perfect?” European Sociological Review, Vol. 20, No. 1, pp. 1-11.
Walker, I. and Zhu, Y. (2013) “The Impact of University Degrees on the Lifecycle of Earnings: Some Further Analysis”, BIS Research Paper 112, August.
Wilson, T. (2012) “Compulsory Education and Teenage Motherhood”, Discussion paper, Royal Holloway University of London, July. Qualifications and Curriculum Authority (2001), Qualifications framework.
TABLES AND FIGURES
Table I: ONS-LS highest qualification descriptors
NVQ Code Qualifications covered Descriptor
Level 0 No academic or professional qualifications Basic general knowledge. No official qualifications
Level 1 CSEs (grades 2-5), GCSEs (grades D-G), 1-4 CSEs (grade 1), 1-4 GCSEs (grades A-C), 1-4 O levels, NVQ level 1, Foundation GNVQ
Basic factual knowledge of a field of work or study. 'Poor' lower secondary school qualifications
Level 2 5+O levels, 5+CSEs (grade1), 5+GCSEs (grades A-C) etc., 1 A level, 1-3 AS levels, NVQ level 2, Intermediate GNVQ
Knowledge of facts, principles, processes and general concepts, in a field of work or study. 'Good' lower secondary school or 'poor' upper secondary school qualifications
Level 3 2+ A levels, 4+ AS levels, Higher School Certificate, NVQ level 3, Advanced GNVQ
Factual and theoretical knowledge in broad contexts within a field of work or study. 'Good' upper secondary school qualifications
Level 4/5 First degree, Higher degree, NVQ levels 4-5, HNC, HND. Qualified Teacher status, Qualified Medical Doctor, Qualified Dentist, Qualified Nurse, Midwife, Health Visitor
Comprehensive, specialised, factual and theoretical knowledge within a field of work or study. All higher education degrees including vocational degrees
Other qualifications/ level unknown:
Other qualifications (e.g. City and Guilds, RSA, BTEC, etc.), Other Professional qualifications
Unknown or other qualifications which cannot be classified
Table II: Multinomial logit model predicting highest qualification in 2001 by origin quintile
No Qual Other Level 1 Level 2 Level 3 Level 4/5
Quintile 1 16.588*** 7.829*** 3.704*** 2.251*** 1.399* ref (1.763) (1.063) (0.377) (0.228) (0.205) ref Quintile 2 13.255*** 6.879*** 3.751*** 2.455*** 1.510** ref (1.409) (0.937) (0.374) (0.241) (0.212) ref Quintile 3 7.028*** 5.438*** 2.936*** 2.179*** 1.395* ref (0.729) (0.712) (0.275) (0.196) (0.179) ref Quintile 4 2.910*** 2.199*** 1.597*** 1.476*** 1.023 ref (0.309) (0.307) (0.149) (0.127) (0.127) ref
Quintile 5 ref ref ref ref ref ref
base category ref ref ref ref ref ref
0.583*** 0.454*** 1.252* 1.222* 1.218 ref (0.073) (0.079) (0.104) (0.086) (0.122) ref Quintile 1 1.253 1.214 1.409** 1.126 1.111 ref (0.217) (0.270) (0.180) (0.185) (0.219) ref Quintile 2 1.211 1.241 1.319* 1.343* 0.962 ref (0.193) (0.274) (0.176) (0.150) (0.183) ref Quintile 3 1.270 1.189 1.318* 1.243 1.051 ref (0.201) (0.259) (0.179) (0.154) (0.184) ref Quintile 4 1.114 1.309 1.346* 1.187 1.104 ref (0.183) (0.301) (0.166) (0.139) (0.184) ref
Quintile 5 ref ref ref ref ref ref
base category ref ref ref ref ref ref
Obs Parental Origin dummy variables (CAMSIS Score 1971) 1972 RoSLA dummy Parental Origin dummy variables (CAMSIS Score 1971) x 1972 RoSLA dummy 18262
Dependent variable = Child education outcomes in 2001
Source: ONS-LS limited to those born in 1955, 1956, 1958 and 1959. Coefficients are odds ratios (standard errors in parentheses). Controls include parental age and regional dummies.
Table III: OLS regressions of intergenerational mobility – the effect of 1972 RoSLA Child CAMSIS score in 2001 All Men Women All Men Women Parental CAMSIS score in 1971
Continuous 0.300*** 0.305*** 0.296*** (0.009) (0.012) (0.012) Dummy variables Quintile 1 -11.856*** -11.755*** -11.964*** (0.416) (0.591) (0.584) Quintile 2 -10.406*** -11.171*** -9.737*** (0.416) (0.592) (0.583) Quintile 3 -7.867*** -8.253*** -7.541*** (0.412) (0.585) (0.578) Quintile 4 -3.617*** -3.972*** -3.375*** (0.427) (0.617) (0.591)
Quintile 5 ref ref ref
base category ref ref ref
1972 RoSLA reform 0.691 0.808 0.579 0.326 0.190 0.457 (0.620) (0.885) (0.865) (0.398) (0.561) (0.564) Parental CAMSIS score in 1971 x
1972 RoSLA reform Continuous -0.010 -0.011 -0.009 (0.012) (0.017) (0.017) Dummy variables Quintile 1 -0.204 -0.238 -0.216 (0.573) (0.816) (0.802) Quintile 2 0.433 0.980 -0.013 (0.572) (0.812) (0.803) Quintile 3 0.057 0.097 0.051 (0.568) (0.806) (0.799) Quintile 4 -0.352 -0.288 -0.418 (0.586) (0.839) (0.818)
Quintile 5 ref ref ref
base category ref ref ref
Parent age controls yes yes yes yes yes yes
Regional controls yes yes yes yes yes yes
Constant 15.401*** 9.860* 20.767*** 35.847 31.456 40.243 3.023875 4.267255 4.271663 (3.045) (4.300) (4.300) Observations 22008 10833 11175 22008 10833 11175 R-squared 0.120 0.126 0.117 0.113 0.120 0.110
Standard errors in parenthesis: * p<0.05, ** p<0.01, *** p<0.001. Source: ONS-LS Subsample of 2001 sample members were born in 1955, 1956, 1958 and 1959.
Figure I: The effect of the 1972 RoSLA on qualification attainment by social origin quintile
Source: Office for National Statistics Longitudinal Study
i Some children could leave at age 15 if their birthday was in June, July or August.
ii In Scotland the minimum school leaving age was raised three years later on 1 September 1975. We therefore exclude Scotland from the following analysis and when referring to UK only include England, Wales and Northern Ireland in this definition.
iii The 2011 census has now been linked but does not form a part of this analysis.
iv The National Statistics Socio-Economic Classification (NS-SEC) is not available for the 1971 wave of the LS. A version of NS-SEC is available for subsequent waves, although this is not based on the full set of questions.
v Specification checks show that our results are not sensitive to using 3 or 6 quantile groups.
vi The ONS-LS data does not include month of birth and children born in September have more schooling that those born in August due to school intake laws.
vii Which is represented by a series of five parental CAMSIS origin dummy variables.
viii We tested these results by gender and found no evidence of statistically significant differences
ix As mentioned previously, our CAMSIS measure of occupational prestige is standardised every census with a mean of 50 and standard deviation of 15 and we therefore inherently measure relative intergenerational mobility.