1876-6102 © 2015 The Authors. Published by Elsevier Ltd. This is an open access article under the CC BY-NC-ND license (http://creativecommons.org/licenses/by-nc-nd/4.0/).
Peer-review under responsibility of Applied Energy Innovation Institute doi: 10.1016/j.egypro.2015.07.389
Energy Procedia 75 ( 2015 ) 361 – 366
ScienceDirect
The 7th International Conference on Applied Energy – ICAE2015
Real-Time Efficiency Boosting for PV Systems using MPPT
based on sliding mode
Maissa Farhat
a*,Oscar Barambones
b, Lassaad Sbita
ca,cNational Engineering School of Gabes, University of Gabes, Rue Omar Ibn-Elkhattab, Zrig, Gabès, 6029,Tunisia
bAdvanced Control Group. Universidad del País Vasco, EUI, Nieves Cano 12, 01006 Vitoria, España
Abstract
This paper presents a photovoltaic system with maximum power point tracking (MPPT) facility. The goal of this work is to obtain maximum power from the photovoltaic generator (PVG) by using an MPPT. Therefore the sliding mode controller (SMC) is proposed as MPPT controller. This controller is based on the constant voltage algorithm. In order to meet different requirements of stability and rapidity in different weather condition, we construct a voltage estimator; the estimator output will be the input for the SMC. Simulation results prove that the SMC, under load disturbances, compared to the well-known perturbation and observation (P&O), offers fast and accurate converging to the maximum operating point (MPP). The implementation of the MPPT based SMC hardware setup is done using DSPACE real time control. Experimentation results are provided to demonstrate the validity of the proposed control scheme.
Keywords: BOOST; MPPT; PVG; sliding mode.
1. Introduction
This work analyses the MPP tracking of a stand-alone PV system. The PV system is considered as a non-linear complex one. The maximum power extraction from the PVG is then required. Therefore, using a MPPT controller becomes fundamental operation for a successful PV application. Numerous MPPT methods have been studied, for instance, perturb and observe (P&O), fractional open-circuit voltage and intelligent controllers [1-5]. The cited algorithms have a high tracking accuracy, but still reveal some trade-offs between tracking speed and tracking reliability when load values or weather conditions change. SMC has recently attracted considerable attention of researchers. The SMC present the advantages of being robust, besides it is great performance in different fields such as robotic [6], motor control [7]. In this paper, the interest was focused on the use of SMC in order to obtain the MPP from the PV generator (PVG). The main goal of this controller is to make the system work at the MPP. This goal will be
* Corresponding author. Tel.: +216 22922608;.
E-mail address: [email protected]
© 2015 The Authors. Published by Elsevier Ltd. This is an open access article under the CC BY-NC-ND license (http://creativecommons.org/licenses/by-nc-nd/4.0/).
achieved by generating a command signal, and by using an input voltage reference (VMPP). The VMPPis generated online via a voltage reference estimator. In this paper the SMC algorithm generates directly a pulse width modulation (PWM) signals. This last has the benefit to avoid the need of a high frequency commutation signal (Saw signal) and directly command a converter.
2. MPPT
In this work a new SMC is proposed. The method of control is divided into two steps, the first is to determine the voltage value at which the system operates with its maximum of power (VMPP), and the second is to control the system in order to operate with this voltage value via a Boost converter.
0 5 10 15 20 25 0 10 20 30 40 50 60 70 80 (a) Vp(v) P( W ) G=160W/m²,T=7.053°C G=155W/m²,T=7.05°C G=135W/m²,T=7.056°C G=130W/m²,T=7.058°C G=120W/m²,T=7.058C G=100W/m²,T=7.05°C G=90W/m²,T=7.042°C G=85W/m²,T=7°C G=55 W/m²,T=7°C 0 5 10 15 20 25 0 20 40 60 80 100 120 (b) Vp(v) P( W ) G=820 W/m²,T=37°C G=155W/m²,T=7.05°C
Fig.1.Real P-V characteristics in different irradiation and temperature values
Step1
In this paper, the main objective is to construct an MPP voltage-reference estimator that meets the MPP. Specifically, the estimator is designed in order to on-line compute the optimal voltage value VMPP. So that, if the actual voltage Vp reaches VMPP then, the maximal power is captured and this voltage will be considered as the regulator input. It is easy to see from Fig. 1.a that for almost constant temperature and for different irradiation values, there is a unique couple (Vp, P) that involves the maximum of power. In order to construct the red curve, that is consider as reference voltage, a number of couples (Vp, P) for different irradiation values have been collected and then interpolated to get the suitable function (VMPP= F(P)). This function is created using Matlab Fitting Curve Toolbox. Several tests have been done to choose the right interpolation function of the red curve; we deduced finely that the power function fits more the used PV panel [8]. The constructed function is denoted as F(P) = a Pb +c .Where P is the PV panel power and the a, b, c specific coefficients for the used PV panel. With: a=-8.638; b=-0.1697; c=19.74. Fig.1.b shows that
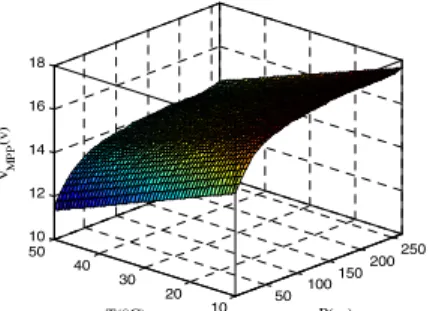
VMPP necessarily depends on the temperature. As consequence we should consider one reference voltage curve for each temperature value. All the points (VMPP, P, T) are treated and interpolated at the MPP for different power values and at different given temperatures. As a result a function VMPP= f (P, T) is obtained, this function provides a computed reference voltage value. This function is created using Matlab fitting curve toolbox. In this work several test has been done using different type of function such as, Fourier, Gaussian, rational, and the polynomial function like the work in [8]. Finely we deduce that the power function present the best fitting. The constructed function is denoted as:
2 3 2 4 3 5 4 00 10 01 20 11 30 21 40 31 50 41 ( , ) * * * * * * * * * * * * * * MPP V =F X Y = +p p X p+ Y p+ X +p X Y p+ X+p X Y p+ X +p X Y p+ X +p X Y (1) ( ) ( ) 00 10 01 20 11 30 21 40 - / , - / , 73.38 , 67.38 ; 29.7 , 13.05 15.29, 0.6488, -1.09, - 0.5132 , 0.01793, 0.4582, - 0.01153, With X P meanX stdX Y T meanY stdY and meanX stdx meanY stdY
p p p p p p p p = = = = = = = = = = = = = = 31 50 41 - 0.2286, -0.001497, 0.04033, 0.001746 p = p = p =
0 50 100 150 200 250 300 350 9 10 11 12 13 14 15 16 17 18 P(W) VMP P (v ) T=10°C T=15°C T=20°C T=25°C T=30°C T=35°C T=40°C T=45°C T=50°C 50 100 150200 250 10 20 30 40 50 10 12 14 16 18 P(w) T(°C) VMP P (v )
Fig. 2. Optimal P-V characteristic Fig. 3. Surface P-T-V characteristic of MPP
Step 1
After determining the VMPP, the proposed SMC gives the PWM signal to the boost converter, and forces the PVG to operate at VMPP and hence reach the MPP. In this sense, the following sliding variable is defined as:
S=e=Vp-VMPP (2) And the sliding mode controller is defined as:
u=½ (1+sign(S)) (3); (4) The stability can be analyzed using the Lyapunov stability method. A positive definite function V is defined as V=½ S²>0
Its time derivative is: ; considering that:
Based on the principle of Lyapunov as S reaches the state S = 0, means that the system reaches the desired voltage value VMPP.Hence, the convergence to the MPP.
When S>0: The switch command is at low level, this implies that the duty cycle (D) will increase. In a continuous conduction mode, the voltage relation of the input /output (Vin /Vout) for the boost is: [4].
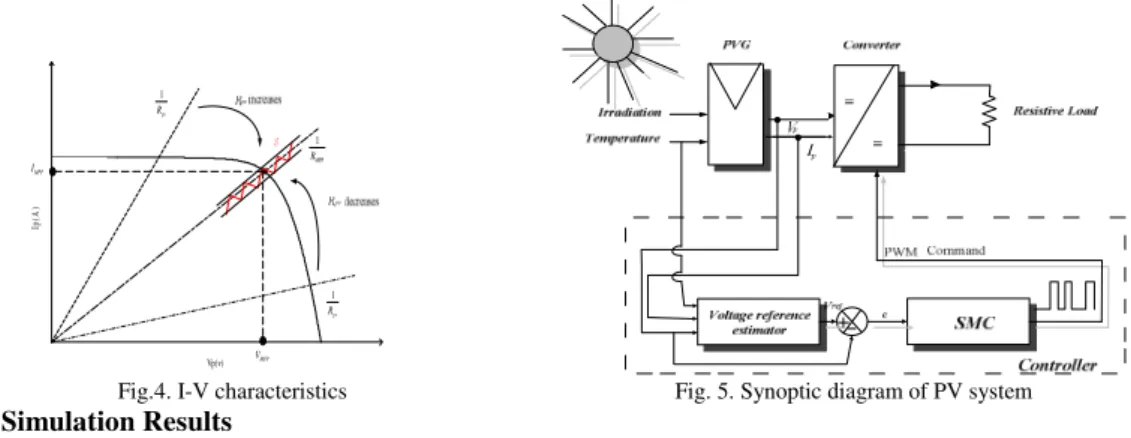
Vout= Vin /(1-D) (5) Based on the assumption where Pin=Pout , it can be deduce that Rpv = (1-D) ² Rout . Where Rpv is the equivalent resistance connected to the PV panel and Routis the one connected the converter. So, based on this equation, we can observe that: - If the duty cycle D increases, then Rpvdecreases. Based on the PV dynamic given by the I-V characteristic shown in Fig.4: when the PV current (Ip) will increase, Vp will decrease. It can be deduced finally that, when the voltage (Vp) increases/decrees the current (Ip) decreases/increases, so, if the resistance connected to the PV panel decreases then (Ip) increases and (Vp) decreases. So As a consequence in this case, this imply that Vp <0 and ܅<0, Finally; S܅<0.
When S<0: Using the same method Vp >0 and ܅>0, finally; S܅<0.
Finally, using the Lyapunov stability theory it can be concluded that S reaches the state S = 0 means that the system reaches the desired voltage value VMPP, and hence the convergence to the MPP.
The Synoptic diagram of PV system explaining the control method is shown in Fig.5. 1 S>0 0 S<0 u= * p MPP S e V V S e Vp = = − ® = = ¯ = dS V S SS dt =
0 5 10 15 20 25 0 0.5 1 1.5 2 2.5 3 3.5 4 4.5 5 Vp(v) Ip (A ) MPP 1 R MPP I MPP V 1 pv R 1 pv R
Fig.4. I-V characteristics Fig. 5. Synoptic diagram of PV system 3. Simulation Results
In this section, the investigated PV system global control shown in Fig.5 is implemented. To highlight the proposed system good performances the proposed SMC must act on the converter by generating directly the PWM, yielding the PVG to work with an optimal voltage VMPP. the simulation work, will be in the standard condition is considered. Four PV panels associated in parallel will be used. In this section SMC is compared to P&O algorithm. Both controllers are tested over an abrupt load perturbation from 30 to 15 . This action is used to prove the controller robustness and the ability to keep extracting the maximum of power within this variation. Fig.6 shows that the PVG power remains constant in spite of the load change. As a result of maintaining the power quantity absorbed from the PVG constant, the operation point of the PV remains constant. Fig.7 shows the load voltage. The obtained simulation results show that both controllers present a good MPPT. However, the SMC presents less oscillation, fast tracking in response to a load variation and stability. Specifications of the used PV system are in table 1. Table 1. PV system Specifications
Specifications of the Atersa PV panel Boost converter parameters
Maximum power[W] 55(± 10%) Schottky Diode 600 V, 15 A, 0.4 V at 10 A, 150ºC
Open Circuit Voltage Voc [V] 20,5 IGBT 600 V, 40 A, 1.5 V at 150ºC
Short circuit Current Isc [A] 3.7 L 560 µH, 7 A, 42 mȍ
Voltage, max power Vmpp [V] 16.2 C 1500 µF, 250 V
Current, max power Impp [A] 3.4 Schottky Diode 600 V, 15 A, 0.4 V at 10 A, 150ºC
Number of cells in series 36
0 1 2 3 4 5 0 50 100 150 200 250 X: 1.141 Y: 222.8 time(s) P( W ) 2 2.5 3 3.5 210 215 220 225 230 0 1 2 3 4 5 20 40 60 80 time(s) VR (V )
4. Experimental Result
In order to prove the SMC efficiency, a practical work has been done, a DSPACE (DSP) layout board was used as logging and control of the dressed platform. The DSP permit the linkage between the MATLAB/SIMULINK and the real hardware. This is done by introducing the DSP DS1104 input-output (I/O) interface [9]. The implementation of the MPPT is done by using DSP 1104 real-time control layout card. Fig. 8 is a photo of the hardware used for the MPPT system. It shows also the components used in this work. In the hardware system, four ATERSA A55 modules are used. The data acquisition and the control system are implemented using DSPACE software and digital signal processor card.
Fig. 9 shows The MPPT control which is constructed on MATLAB/SIMULINK. The MPPT algorithm generates the required duty cycle, this signal is then applied to the DS1104SL DSP PWM block which is used to generate the required PWM switching signal.
In order to start real-time operation, the SIMULINK MPPT control block, must be downloaded to the DSPACE board to generate C code of the MPPT control block. All the obtained results in the next part were taken, in Vitoria Gasteiz-Spain which known to have a cold weather that explains the low value of the cell- temperature. In this work, the cell- temperature is equal to 11.08°C. At a time § 10.7s we change the Load manually from 28.3 to 14.65 in order to test the robustness of the SMC.
Fig. 10, Fig. 11 and Fig.12 show respectively the irradiation and power and the load voltage during recording and varying the load value. After finishing tracking operation we had interest: in localization the operation point of the system without control, by sending a constant command equal to zero (D=0) to the DSP PWM, and second varying the load from 0.1 to 47.2 to get the real characteristic of the panel. Fig. 13 shows respectively the ATERSA P-V characteristics and also the operating point of a resistive load (R§27.1ohm) that’s coupled to the PVG when the duty cycle is null (that is, without any control). From the previous figures it easy to see that the operating point of the resistive load with no control is too far from the MPP.
Fig..8. Hardware setup of system Fig.9. MPPT SIMULINK model
0 2 4 6 8 10 12 14 16 18 20 90 100 110 120 130 140 150 time(s) G( W /m ²) Fig. 10. Irradiation 0 2 4 6 8 10 12 14 16 18 20 10 15 20 25 30 X: 3.289 Y: 23.42 time(s) P( W )
2 4 6 8 10 12 14 16 18 20 0 5 10 15 20 25 30 35 time(s) VR (v)
Fig.12. Load voltage (VR)
0 2 4 6 8 10 12 14 16 18 20 22 0 5 10 15 20 25 X: 16.13 Y: 23.74 Vp(v) P(W ) with no control with SMC Fig.13.P-V curve
From figure 11 it is easy to see that the system is operating with an average power equal to 23W, this values that corresponds to the MPP shown in Fig. 13. This power remains constant under load variation. Therefore, the operation of the system shows, in these figures, the efficiency and robustness tracking of the proposed SMC.
The effectiveness of the system using SMC is clear in this paper as well as its success to operate in the area of maximum power zone as shown in Fig.13. We can say that the SMC succeed to decrease the load seen by the ATERSA panel in order to consume its maximum of power. The SMC MPPT controller brings up the PVG performances, as depicted in PVG outputs tracking curves. The investigations of the Fig.13 confirm the power rate benefit and the overall system performances improvement.
5. Conclusion
In this paper, the MPPT design is achieved using a stable sliding mode controller, this controller improves the performance of the MPPT, eliminated the complexity and ensures the efficiency of the system. The proposed system is investigated under MATLAB/SIMULINK, and then practically implemented all around the acquisition and control system card DSPACE 1104. This SMC, despite its simplicity of implementation, it has obtained good results by successfully and accurately tracking the MPP.
References
[1] Farhat, M., Sbita, L. Advanced ANFIS-MPPT Control Algorithm for Sunshine photovoltaic Pumping Systems. International Conference on Renewable Energies and Vehicular Technology, 2012 :167 - 172.
[2] K. Ishaque, Z.Salam, G. Lauss, The performance of perturb and observe and incremental conductance maximum power point tracking method under dynamic weather conditions, Applied Energy, 2014 ; 119: 228-236
[3] W . Khadmun, W. Subsinghaa, High Voltage Gain Interleaved DC Boost Converter Application for Photovoltaic Generation System, Energy Procedia ,2013 ;34 : 390 – 398
[4] M. Farhat, A. Flah, L. Sbita, Photovoltaic Maximum Power Point Tracking Based on ANN Control,International Review on Modelling and Simulations(IREMOS), 2014 ; 7 : 474-480.
[5] E. Kremers, J. M.G.Durana, O. Barambones, Emergent synchronisation properties of a refrigerator demand side management system, Applied Energy, Vol.101, January 2013, pp 709-717
[6] S.Islam, P.X. Liu, Robust Sliding Mode Control for Robot Manipulators, IEEE Transactions on , Industrial Electronics,2011;58 :2444 - 2453
[7] O.Barambones, P. Alkorta, Position Control of the Induction Motor Using an Adaptive Sliding-Mode Controller and Observers, IEEE Transactions on Industrial Electronics, vol. 61 , no. 12,pp. 6556 – 6565,2014 .
[8] Abderrahim, E.F.; Fouad, G.; Abdelmoinime,.M. Reference Voltage Optimizer for Maximum PowerTracking in Single-Phase Grid-Connected Photovoltaic Systems, Journal of Control and Systems Engineering 2013 ;12 : 57-66.
[9] A. Mendez, A. Belghith, M. A DSP for Sensing the Bladder Volume Through Afferent Neural Pathways, IEEE Transactions on Biomedical Circuits and Systems. 2014;8 :552 - 56