High performance computing simulator for the
performance assessment of trajectory based
operations
Leonardo Camargo-Forero
Ramon Dalmau
Sergio Ruiz
Xavier Prats
Technical University of Catalonia Castelldefels, Barcelona (Spain)
Abstract—High performance computing (HPC), both at hard-ware and softhard-ware level, has demonstrated significant improve-ments in processing large datasets in a timely manner. However, HPC in the field of air traffic management (ATM) can be much more than only a time reducing tool. It could also be used to build an ATM simulator in which distributed scenarios where decentralized elements (airspace users) interact through a centralized manager in order to generate a trajectory-optimized conflict-free scenario. In this work, we introduce an early prototype of an ATM simulator, focusing on air traffic flow management at strategic, pre-tactical and tactical levels, which allows the calculation of safety and efficiency indicators for optimized trajectories, both at individual and network level. The software architecture of the simulator, relying on a HPC cluster of computers, has been preliminary tested with a set of flights whose trajectory vertical profiles have been optimized according to two different concepts of operations: conventional cruise operations (i.e. flying at constant altitudes and according to the flight levels scheme rules) and continuous climb cruise operations (i.e., optimizing the trajectories with no vertical constraints). The novel ATM simulator has been tested to show preliminary benchmarking results between these two concepts of operations. The simulator here presented can contribute as a testbed to evaluate the potential benefits of future Trajectory Based Operations and to understand the complex relationships among the different ATM key performance areas.
I. INTRODUCTION
With the initiatives proposed by the programs SESAR (Single European Sky ATM Research) [1] and NextGen [2] in the United States of America, a series of challenges and new concepts of operations are currently under development. Among them, the implementation of trajectory based op-erations (TBO), allowing airlines to execute their preferred trajectories (subject to minimum constraints) for each of their flights. In this context, each airline will have more flexibility than nowadays to optimize each of their flights based on their own particular business interests (e.g. reducing fuel consumption, reducing trip time, etc.). TBO considers the use of precise four-dimensional (4D) trajectories during flight planning and execution. Thus, it is expected that the traffic will be synchronized and strategically deconflicted across the network, while the airspace capacities adapted dynamically according to the actual traffic predictions. For that purpose, it is important to introduce a de-confliction process for those optimized (user-preferred) trajectories before their execution, aiming at minimizing tactical intervention of ATC once the
flight is airborne.
In this work, an early prototype of an ATM simulator is presented, with a distributed/centralized software architecture based on high performance computing (HPC) components that has been designed and partially implemented for the decen-tralized optimization of the trajectories and the cendecen-tralized detection of conflicts, relaying on a cluster of computers. By using this type of infrastructure and designing a simulator capable (parallelized) to executed upon it, it is possible to provide time efficiency and scalability (in the sense of taking advantage of including more computing capacity to the cluster or dynamically adapt to datasets, independently from its size) for the finding of a conflict-free trajectory-optimized scenario. To test the current version of the simulator, a benchmark of operational efficiency (fuel consumption, trip time, etc.) over a set of optimal trajectories calculated in a distributed manner and the centralized evaluation of conflict detection for an initial negotiation round is presented. Moreover, a comparison between two different profiles, referred here as: Conventional (following the standard flight level allocation scheme) and Continuous flight (trajectories are optimized with direct routing and without the consideration of any ATM constraint leading to continuous cruise climb operations [3]) is used to provide further insight on a global network level.
The simulated scenario consist of real flight plans from one day of air traffic in Europe, where each business development trajectory (BDT) was calculated, in a distributed manner, using an in-house trajectory optimization software [3]. Furthermore, a Conflict Detection and Resolution (CD&R) software [4], capable to evaluate, at network level, the impact of flying such optimized trajectories, has been used to detect emerging conflicts in a centralized approach. Results of the CD&R software (used in this work) were presented in [5] and showed that it is possible to obtain more than one deconflicted global (air traffic network level) solution with a 2.6-GHz 64-bit CPU and 64 GB of RAM for a set of 4010 trajectories. However, looking to scale up the capacity to obtain a conflict-free scenario in a timely manner (approaching real time) given a larger set of shared business trajectories (SBT), after receiving initial BDTs that could be negotiated, it is proposed to use a high performance computing (HPC) cluster of computers.
A cluster of computers is a HPC infrastructure, where dis-tributed elements (computing machines or nodes) can interact
between each other or through the coordination of a centralized element, allowing software being executed upon it to behave in different ways in which communication can be done directly or indirectly via a central unit.
Estimating such scenario could be done in several ways ranging from fully distributed to fully centralized approaches. A fully centralized approach might not be realistic nowadays given the dynamics of ATM, in which airlines don’t share company-sensitive information, being not possible to estimate optimized trajectories. On the other size, a fully distributed or decentralized approach, in which a cooperative mechanism is performed between individual actors (e.g. aircraft), might result into conflicts at a global level [6]. Thus, a hybrid (distributed/centralized) approach it is presented in this work.
II. BACKGROUND
A. Trajectory based operations
As the European ATM system is progressively reaching its capacity limits, a substantial change of the ATM paradigm is on-going through the SESAR and NextGen programmes. The ATM change is performance-driven, focusing primarily on the enhancement of four key performance areas (KPAs): safety, capacity, flight efficiency and ATM cost-efficiency. SESAR is introducing a new concept of operations in order to achieve the future ATM requirements. This concept of operations requires a paradigm in which, flight 4D trajectories are established as the fundamental elements of a new set of operating procedures referred to as trajectory based operations (TBO).
The TBO paradigm is based on the concept of business trajectory, which represents the intentions and flight planning of a flight fully described as a four dimensional trajectory (4DT), i.e., encompassing the geographical location and time for the entire duration of a flight. This paradigm change will allow attaining a higher predictability of the network status. To reach this point, however, a collaborative-decision-making process is need to be implemented among the different aviation stakeholders (e.g. network manager, air traffic control, airports, other airlines, etc.). Keeping this in mind, TBO moves for-ward from the airline business development trajectory (BDT), which consists of preferred flight trajectories estimated based on company intentions, towards shared business trajectories (SBT). SBT become available to other stakeholders via the network operations plan (NOP) [7], which after an iterative negotiation process in which an acceptable (e.g. deconflicted) scenario is found, end as reference business trajectories (RBT): the actual flight trajectories to be flown. The airline agrees to fly the RBT and the ANSPs/airports agree to facilitate it. Yet, during the trajectory execution, RBT might be impacted (e.g., by de-conflicting, real-time queuing, or weather hazards, for instance) and it might be revised, negotiated and updated.
In fact, in the time-period from the inception of the BDT until the actual flight, the trajectory is to be updated and refined with new information, as soon as it becomes available (e.g., trajectory changes due to weather influences, etc.), which is not the case today. The updates are to be shared with all the stakeholders, thus easing the overall planning for the whole air
transportation system (air traffic control, airports, and human resources, among others).
The TBO concept of operations envisions that the early information sharing and continuous updates will enable the early identification of potential problems (i.e. demand-capacity imbalances). In turn, this would invoke the collaborative decision-making processes for the problem resolution through a re-negotiation process. Thus, a software application capable of simulating different scenarios based on TBO operations could provide insight about operational efficiency, both at individual (per trajectory) or total (network) level and also set a computational framework to anticipate technical and conceptual issues that must be understood beforehand the potential implementation of the distributed and collaborative decision-making processes carried out by SESAR or NextGen. B. High performance computing
The use of distributed computing architectures, such as cluster of computers or highly parallel devices in several fields of research and technology has proven to offer many benefits. The most common, among such benefits, is the capacity of processing large datasets in less time that would be possible in a normal computer, leading therefore to the utilization of infrastructures such as a cluster of computers [8].
A cluster of computers can be described as a set of nodes (PCs, servers, etc.), connected through a high speed LAN (local Area Network), where every node can be classified as a Master or a Slave/computing node. For the nodes to behave as a cluster of computers, a set of software layers are installed and configured, accordingly to the node classification, which ultimately allow the user to believe being using a single scalable (node inclusion or subtraction) machine. This layers are: Operating System (OS), normally a Linux-based OS; File System (in particular, this layer allow any software to access the data which is physically located in the master node or a storage server using a network protocol such as Network File System NFS or parallel or distributed File Systems); UserSystem (user replication and authentication); and Batch System (also known as Resource Manager/Job Scheduler). Normally, nodes are accessible via SSH (Secure Shell) and a password-free encryption SSH key is deployed in the infrastructure so any software using this communication protocol does not require constant authentication from the user. The master node is the one in charge of coordinating the computing/slave nodes, monitoring its status (e.g. RAM, processors or computing cores utilization, etc.) and it generally implements a set of policies to optimize the resources utiliza-tion in a multiuser/multipurpose environment. Any software to be executed, upon such infrastructure, must contemplate at some level, some parallel or distributed approach, in order to take full advantage of the available computational power. In contrast, according to Flynns Taxonomy [9], every software can be classified in one of the following types: SISD, MISD, SIMD and MIMD (where S stands for Single, M for Multiple, I for Instruction and D for Data).
SISD represents the sequential software and the last three are considered as parallel software. SIMD refers to software where the same instructions are applied over different data and where data-independence is guaranteed. MISD refers to apply multiple instructions over different data. This classification is commonly applied in avionics, where it is important to guaran-tee that the results of processing data from sensors is correct, therefore, independent computing units process the same data with the objective of testing its correctness. Finally, MIMD represents the fully distributed software, in which multiple instructions are applied over different data. MIMD, however, could contemplate the inclusion of centralized components, as it is the case of the simulator presented here, where BDTs are estimated distributively and conflicts are evaluated in a centralized approach.
III. ATM SIMULATOR BASED ON TBO
A HPC infrastructure is proposed in this paper as a tech-nological baseline to develop a ATM simulator under the concepts of TBO. Depending of the amount of data to be processed, a particular quantity of computing nodes can be selected in order to provide fast calculation, both of the BDTs and the SBTs conflict estimation, scaling freely with regards to data and computing power. Such a large scalability would not be possible on a single machine with limited resources in term of computing capacity or memory. Also, by coupling the simulator with such infrastructure, it is possible to evaluate scenarios where SBTs or RBTs are changed due to weather conditions, airport closing situations, changing of airspace sectors, or other uncertain events. In addition, the simulator can allow the evaluation of communication costs by assuming that each of the computing cores within the cluster represents an aircraft and therefore being able to simulate the expected real latencies between aircraft and ground facilities of the network manager (latencies between cores and the central unit of each core can be set independently).
Such emulator/simulator can therefore be also useful to find hybrid (centralized-decentralized) algorithms in which concur-rent processes may want to have simultaneous access (infor-mation reading/writing) to the NOP. This could contribute to anticipate knowledge and strategies about the potential implementation of TBO concepts, in which information about air traffic management and airspace users’ preferences will be circulating among the main agents of interest through a digital information exchange enabled by system wide information management (SWIM) [10].
On the other hand, due to the powerful scalability available through HPC infrastructures, for managing large datasets, a software-component-based simulator could allow the inclusion of weather APIs (Application Programming Interfaces) based for example on GRIB2 format [11] or even interfacing with SWIM components using the XML standard, such as the Aeronautical Information Exchange (AIXM) format [12]. In this sense, the simulator architecture presented here could contribute also as an HPC gateway for SWIM and the NOP.
In the proposed architecture, the master node represents the Network Operations Plan (NOP), assumed as a service of the network manager and each of the distributed computing cores (within the slave nodes) represent individual flights, which are assumed to calculate its own optimized trajectory and send it to the NOP, as a fundamental task of the collaborative flight planning and traffic synchronization processes. Moreover, the objective for the future architecture developments is to allow the execution of a traffic planner, in which, once a conflict is detected between optimized trajectories, the master node will request the flights (cores) in conflict to recalculate its trajectory under a set of new constraints, following a loop cycle till a conflict-free scenario is found, representing that way the iterative negotiation process, as proposed by SESAR. With all the above characteristics, the simulator will be a powerful workbench to analyze strategic (long term), pre-tactical (mid/short term), and pre-tactical (execution) traffic scenar-ios in real-time, with room for including up-to-date meteoro-logical information, communication latencies, de-centralized trajectory optimization processes, and altogether comple-mented with the assessment of metrics for ATM performance that could bring the TBO concept to a further step in which the negotiated traffic plans obey to some high-level performance goals agreed among all the stakeholders.
A. HPC software architecture
Software architecture describes a set of components and the interactions among them. Its objective is to show, in a clear way; the software operation in general and how will be carried by the different components. In the case of HPC software architecture, the aforementioned is coupled with an underlying infrastructure, describing where the components are being executed, the master or the computing nodes. It is worth mentioning that the master node of a cluster is not necessarily where the master element (in an HPC software) is being executed.
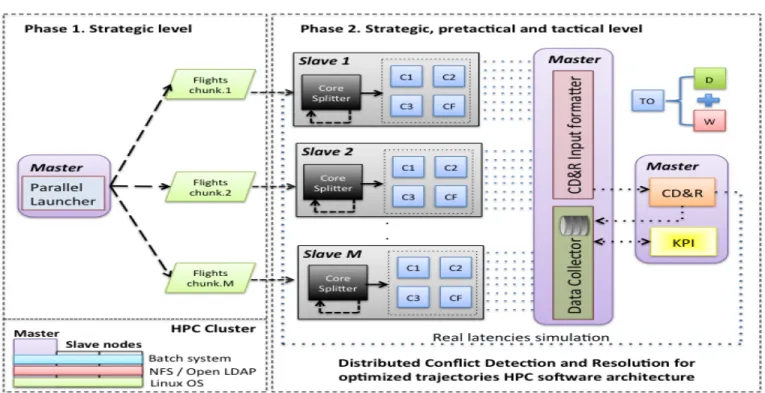
Fig. 1 shows the simulator’s HPC software architecture, which will be the final result of the current version presented in this paper. For the sake of simplicity, the figure does not discriminate the master node from the master component.
In fig. 1, the two main components of the software ar-chitecture are the per-core in-house trajectory-optimization software - TO (blue boxes, where C[1,2,.., F] stands for Core 1 up to F, being F the last core available1 in the particular
machine, which could be different between machines as in a heterogeneous cluster) and the in-house conflict detection and resolution software CD&R (orange box).
The current status of the architecture does not include the resolution part in the CD&R and its general execution is restricted to a first round (initial SBTs), where the optimized trajectories are received by the CD&R component (network manager). Following steps in our research will include the negotiation process (in fig. 1 the blue dotted arrow connecting the CD&R component and the Core Splitter component).
Fig. 1. Proposed general distributed architecture
1) Trajectory Optimisation component: The TO component consists of an in-house software based on optimal control methodologies. An optimal trajectory can be calculated based on input parameters such as different profiles (e.g. conven-tional, continuous), with different aircraft models (e.g. Airbus A320) and with different operational constraints related to speed, flight path angles, takeoff mass, flight levels, etc. Also, a cost index2 (CI) can be specified. For more information on the trajectory optimization algorithms, please refer to [3] and the references therein.
This component represents the decentralized feature of the simulator, in which each airline calculates its own BDT. It receives inputs from two subcomponents: the data subcompo-nent D and the weather subcomposubcompo-nent (medium light green box and red box, respectively, in fig. 1).
The first input consists of the aforementioned parameters. The second input consists of updated meteorological infor-mation (this input is on initial phases of development at the moment). Finally, the light green inputs (Flights chunk.1-M in Fig.1) consist of the total flights to be computed (N) split by the quantity of available nodes in the cluster (i.e. each node process>=N/M flights).
2) Conflict Detection & Resolution component: The CD&R component envisions the centralized feature of the simulator, which stands currently as a prototype of the NOP. In this way, this component, at its current stage, detects conflicts
2The CI expresses the ratio between the cost of the flight time and the cost of fuel. Thus, a CI set to zero means that the cost of fuel is infinitely more important than the cost of the time, and the aircraft will fly at the maximum range speed. On the other hand, higher values give all importance to flight time.
between the SBTs. It receives as input, the output of the CDR Input formatter, to be explained in the following. The current software used for this component can provide much more than only detecting conflicts. By collecting metainformation about each flight trajectory, it proposes a set of individual solutions for each conflicted aircraft, in order to find a global deconflict scenario. For more information on this component please refer to [5].
3) Other components: Other components and its current development status are:
• Parallel launcher: This component takes care of splitting
the flights to be processed in the available machines. It provides scalability by being able of attending any quantity of flights and using any quantity of nodes. This component is fully developed.
• Core splitter: Once a flights chunk is received, this component checks the available computing cores in the node and launch a parallel TO execution assigning one flight to one core (being F the quantity of cores, F flights will be processed in parallel). Successive rounds are performed till the total flights in the chunk are processed. Following architectures will dynamically allocate and release aircraft to cores, once the optimal trajectory is calculated and the CD&R component approve it, creating the illusion of a core being an aircraft. This component is fully developed.
• CD&R Input formatter: This component process the
output from the TO executions in order to generate the inputs of the CD&R component. This component is fully developed
of each per-core TO, the CD&R component and the KPI component are stored. At the moment, such data is stored in a file-based system. Future work will include the implementation of a database system.
• KPI analyzer: The Key Performance Indicator component is the responsible of estimating operational efficiency as fuel consumption, flying time, quantity of conflicts, etc., for each execution round. KPI component interacts, in a bidirectional approach, with the data collector component by receiving data inputs and sending KPIs results to be stored. This component is fully developed but future work contemplates the inclusion of other KPIs.
Both CD&R and KPI analyzer components, currently exe-cuted in the master node, are candidates for parallelization, since their combined processes involve high computational demand (NP-hard problem in the case of the CD&R [13]). Among other strategies, General Purpose Computing on GPUs (GPGPU), specifically using CUDA (compute unified device architecture) technologies [14] and non-relational databases, is being studied.
As mentioned before, one of the software layers, in a cluster of computers, is the file system. For the initial testing of our architecture, we have used NFS (Network File System), a common standard in HPC, but other file systems could be supported in the future. All software components and the data are shared via NFS, which allow the execution to be done locally at each machine, decreasing therefore software installation, configuration and administration costs.
IV. SIMULATED SCENARIO
At the current development stage of the simulator, explained in previous section, an illustrative example is presented, which allow to observe metrics for different operational efficiency KPIs under a test scenario.
A. Experiment setup
The test scenario is composed of 1319 trajectories corre-sponding to flights operated by A320 or similar aircraft3 and
executed over ECAC (European Civil Aviation Conference) airspace on the1 of July of 2011. The dataset was obtained by filtering A320 or similar aircraft from the set used in [4], which was provided by Eurocontrol via the Demand Data Repository 2 (DDR2).
The 1319 optimized trajectories (BDTs) where calculated using the decentralized TO component with two different profiles: conventional (with direct routing in the entire ECAC and based on the current regulations of flying fixed odd and even flight levels depending on the route track4 [15]) and
continuous (direct routes with continuous vertical operations, including continuous cruise climbs). Resulting conflicts were detected using the centralized CD&R component. Finally,
3In this paper we have considered Airbus A320, A318, A319, A321; Boeing B737; and McDonnell Douglas MD-80 and MD-82.
4Odd cruise flight levels are considered for tracks between 0◦and 179◦
and even flight levels for tracks between 180◦and 359◦
the KPIs component was used to calculate the operational efficiency (See subsection B).
For the testing of the HPC simulator, we have used a set of five (5) nodes: one (1) master node and four (4) slaves. Nodes features are: Intel Xeon 5148-2.33 GHz processor with 1Gb RAM. While the machines used for the experiment cannot be classified as state-of-the-art technologies, the simulator is able to perform well under limited technology capacities
For this scenario, among the 1319 trajectories, 672 flew even flight levels, while647odd flight levels. Finally, for both profiles, we have used a cost index of 45 kg/min [16] and accurate drag and engine models from the Airbus A320 were taken from the Airbus PEP (Performance Engineers Program) suite. Instead of using other aircraft performance models, such as Eurocontrols Base of Aircraft Data (BADA), it was decided to use high-fidelity models from Airbus, in order to have a better performance evaluation. In the future, other aircraft models will be integrated to the simulator with the objective of evaluating more realistic scenarios.
B. Benchmarking results of the de-centralized trajectory opti-mization components
In this section, the results obtained with the KPI component for the decentralized TO, are presented. Table I summarizes the flying time, fuel consumption and CO2 emissions for all evaluated flights.
TABLE I
KPISFOR CONVENTIONAL AND CONTINUOUS TRAJECTORIES
KPI Profiles comparison
Conventional Continuous Difference Difference (%) Trip time [hours] 2,279 2,237 42 1.84 Fuel consumption [kg] 5,693,862 5,686,034 7,828 0.14 CO2 emissions [kg/km] 21,961 21,998 37 0.17 Average total cost [kg] 8,975 8,883 92 1.02
As it can be seen in Table I, first row, with a difference of 42hours faster by using continuous profile, an average of1.91 minutes could be saved per flight per day. Also, considering the price of kerosene per gallon of0.86euros in January of 2016 [17] and a density of0.82Kg/liter, the total amount of money potentially saved by operating under continuous profiles (see Table I, second row, difference column) is 2,169 Euro, an average of1.64Euro per flight in one day. It should be noted that, despite it might seem contradictory, continuous cruise climb profiles tend to save fuel and time if compared with conventional operations, since the optimal speed also increases with altitude [3].
In the case of CO2 emissions, its estimation was calculated by dividing the fuel by the horizontal trip distance, scaled by a factor of 2,580 [18] for each flight. Since, in not every individual case, the consumption of fuel is less in continuous that conventional profile, for this KPI, conventional profile generates less CO2 emissions, with a0.17% difference (third row of Table I).
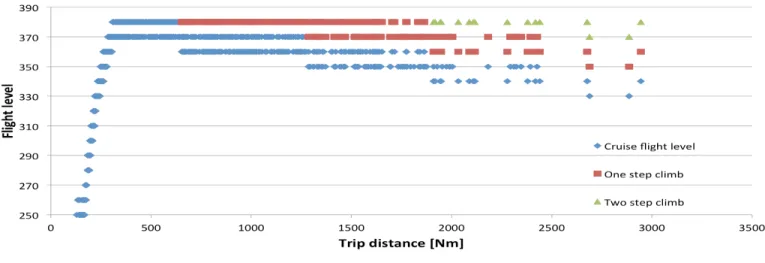
Fig. 2. Flight levels Vs. Distance
Finally, since we have used a cost index of 45 kg/min, representing a tradeoff between fuel and flying time, the following function was used to estimate the total cost:
C=F+CI∗T, (1)
where CI stands for Cost Index, T for flyting time and F for fuel. Total cost units are kg. Table I, last row, shows the average per flight comparison between the two evaluated profiles. With a1,02% difference, continuous profile obtained the total better cost.
Fig. 2 shows the optimal cruise flight level(s) that each simulated trajectory took as a function of the trip distance. In the figure the step climbs in cruise (if any) are also depicted, observing that for distances approximately less that 650NM, aircraft will take only one cruise flight level. For distances grater than this and approximately less than1880NM, aircraft will perform one step climb and two steps climbs for higher distances.
C. Benchmarking results of the centralized CD&R component Using the KPI component and combining output from the TO and the CD&R components, the following results are presented.
Fig. 3. Quantity of flights per Flight Level
TABLE II
CONFLICT DETECTION RESULTS
KPI
Profiles comparison
Conventional Continuous Difference Difference factor Trajectory average
duration [s] 3,709 3,736 27 1.01 Quantity of conflicts
321 746 425 2.32 Average duration per
conflict [s] 60.79 46.87 13.92 0.77 Standard deviation of
duration per conflict [s] 99.76 71.59 28.17 0.72 Quantity of flights
free of conflict 828 560 268 0.68
Fig. 3 shows that, when flying in conventional profile, most optimized SBT chose to use FL370 (odd tracks) and FL380 (even tracks). This figure gives an idea of where the higher amount of conflicts might occur given the optimized trajectories.
Table II shows the results of an evaluation performed in a three-hour window and above FL100. The trajectory average duration (first row) was twenty-seven (27) seconds shorter for the continuous profile, after FL100, suggesting that the total trajectory time is less for continuous profile (see Table II, first row) because below FL100, aircraft performing under continuous profile achieve higher speeds that in conventional profile.
As it is expected, a larger number of conflicts is encoun-tered when simulating the continuous vertical profile with a 2.32 factor (continuos/conventional, second row of table II) . However, with an average duration per conflict (third row), less in continuous profile (factor0.77) and a standard deviation (fourth row), less in continuous profile (factor 0.72), softer
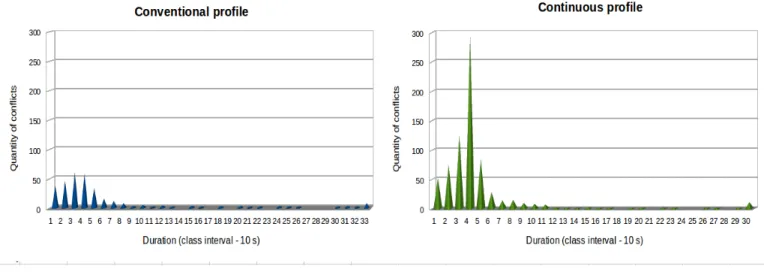
Fig. 4. Quantity of conflicts
resolution maneuvers can be applied.
It is interesting to observe that there are828and560out of 1319 conflict-free trajectories in conventional and continuous profile respectively. This means that in the first calculation of the optimal SBTs, almost 63 and 42 percent of the total SBTs, in conventional and continuous profile respectively are already conflict-free and therefore they would be allowed for execution.
Figure 4 shows a comparison of quantity of conflicts oc-curring in conventional and continuous profiles, classified in ten-second size intervals ( i.e.1=0−9,2=10−19, ... ,335 =
319−839 306=289−779) of conflict duration. In both cases,
the quantity of conflicts behaves as a log-normal distribution. Both curves are very similar, though the amount of conflicts in continuous profile is higher. The larger amount of conflicts (293) in continuous profile occurs in the window 30−39 seconds of duration. Conversely, in the same interval, for conventional profile,59conflicts occurred, the second largest. A conflict represents a separation lost, between two flights, which may occur in one or multiple points along their trajec-tories. Figure 5 shows the conflicts that occur only in conven-tional, only in continuous and in both profiles. The intersection in the figure (152) represents conflicts occurring in both profiles. This is, the same flights entered in conflict(s) in both profiles. Moreover, 1697 conflicts occurring in conventional
profiles didn’t occur in continuous and, as expected, 5948
conflicts not occurring in conventional, occurred in continuous. This is, the conflicts occurring only in one profile versus the other are 3.51 (594/169) times larger in continuous profile.
Finally, for conventional profile, in the last interval (33 = 319−839[s] of duration), eight (8) conflicts occurred and for continuous profile, in the last interval (30= 289−779 [s] of duration), eleven (11) conflicts occurred.
5Conventional profile 6Continuous profile
753 % of the total in conventional profile 880 % of the total in continuous profile
Fig. 5. Comparison of conflicts
V. CONCLUSIONS
A software architecture for high performance computing has been presented as a testbed to simulate and assess ATM sce-narios in a timely fashion and with the potential of operating in real time and with large datasets. By relying in hardware and software techniques, pertaining to the field of High Performance Computing, the architecture/simulator presented can scale up to being able to evaluate scenarios that consist of the total air traffic in Europe represented at microscopic level (i.e., 4D trajectories). In addition, some KPIs have been implemented for the assessment of the airlines operational efficiency (fuel, emissions, flight duration, total cost, among others) and the network safety (number of conflicts and their distribution in FLs).
The ATM simulator has been tested with a particular case study to show the ability to reproduce future de-centralized and centralized decisions, in particular, de-centralized trajectory optimization (e.g., done on-board) and centralized traffic and
conflict analysis (e.g., performed by the Network Manager). The case study consisted of benchmarking the performance of two different concepts of operations that might become real in a future context of a TBO paradigm.
The results of the case study assessment show that in general terms, a continuous vertical profile may impact positively to operational efficiency, in particular to the individual and total fuel consumptions and to flying times in an optimized-trajectory scenario. However, on a network level, the imple-mentation of continuous trajectories might decrease the safety standards because of the notable increase of the number of potential traffic separation conflicts. In terms of total costs, the expected benefits for airlines operating A320 and similar aircraft models in continuous operations is close to 1% with respect the direct routes trajectories constraint vertically with the flight level scheme rules. As a counterpart, the number of conflicts has increased from 321 conflicts in case of conven-tional vertical profiles to 746 conflicts in case of continuous operations, which suggests an increase in the complexity of the traffic that in turn could lead to major safety degradation. The anticipation of the trajectory de-confliction tasks through a collaborative negotiation and with a performance-driven optimization of the traffic operations shall allow to reduce the air traffic complexity and thus to mitigate the actual traffic separation losses. For that purpose, next research steps to build in the ATM simulator will include strategic de-confliction mechanisms and more advanced performance KPIs. This also contemplates the parallelization (with the HPC architecture presented) of some de-confliction tasks to reduce the computational burden of such highly combinatorial problem. A cluster composed of GPGPU nodes and a central master with a non-relational database could be the foundation of speeding up the strategic de-confliction component and providing to it the ability of processing data on a full network level. Finally, a possible integration of the ATM simulator and the HPC software architecture with the SWIM communication network is also contemplated. Such fusion could contribute to the effective implementation of a real-time rolling NOP based on HPC in which the relevant and microscopic ATM information can be shared and centralized from different sources distributed around the world (airborne or on ground) and different actors can participate with heterogeneous data-processing systems and through different data-links into con-structing a trajectory-optimized conflict-free air traffic plan.
ACKNOWLEDGMENT
The authors would like to thank Airbus Industry for the use of PEP (Performance Engineers Program) suite, which allowed us to use a real profile of the Airbus A320 aircraft. Also, we would like to thank the Department of Computer Architecture at the Technical University of Catalonia for providing the computational resources for our simulations. Finally, we thank the Colombian government, in particular to the Colombian Administrative Department of Science, Technology and Inno-vation Colciencias for the founding of the Ph. D studies of the first author, which include the work presented hereby.
REFERENCES
[1] “Single European Sky ATM Research SESAR,” https://www. eurocontrol.int/sesar-researchm.
[2] “FAA NextGen,” https://www.faa.gov/nextgen/.
[3] R. Dalmau and X. Prats, “Fuel and time savings by flying continuous cruise climbs: Estimating the benefit pools for maximum range opera-tions,”Transportation Research - Part D: Transport and Environment, vol. 35, pp. 62–71, Mar 2015.
[4] S. Ruiz and M. Soler, “Conflict pattern analysis under the consideration of optimal trajectories,” inEleventh USA/Europe Air Traffic Management Research and Development Seminar (ATM2015), Lisbon, Portugal, Jun 2015. [Online]. Available: http://www.atmseminar.org/seminarContent/ seminar11/papers/483-Soler 0126150504-Final-Paper-5-8-15.pdf [5] S. Ruiz, M. Piera, J. Nosedal, and A. Ranieri, “Strategic de-confliction in
the presence of a large number of 4d trajectories using a causal modeling approach,” Transportation Research - Part C: Emerging technologies, vol. 39, pp. 129–147, Feb 2014.
[6] N. Durand and N. Barnier, “Does atm need centralized coordination? autonomous conflict resolution analysis in a constrained speed environment,” in Eleventh USA/Europe Air Traffic Management Research and Development Seminar (ATM2015), Lisbon, Portugal, Jun 2015. [Online]. Available: http://www.atmseminar.org/seminarContent/ seminar11/papers/408-Durand 0126150800-Final-Paper-5-13-15.pdf [7] “Network operations plan,” http://www.eurocontrol.int/publications/
european-network-operations-plan-2015-2019.
[8] “Nvidia GPUs social impact,” http://www.nvidia.com/object/ social-impact-gpu.html.
[9] M. Flynn, “Some computer organizations and their effectiveness,” Com-puters, IEEE Transactions on, vol. C-21, no. 9, pp. 948–960, Sept 1972. [10] “Eurocontrol. System Wide Information Management - SWIM,” http:
//www.eurocontrol.int/swim.
[11] “GRIB2 format,” http://www.nco.ncep.noaa.gov/pmb/docs/grib2/grib2 doc.shtml.
[12] “Aeronautical Information Exchange (AIXM),” http://swim.aero/en/ document/aeronautical-information-exchange-aixm.
[13] S. Chaimatanan, D. Delahaye, and M. Mongeau, “Strategic deconfliction of aircraft trajectories,” inISIATM 2013, 2nd International Conference on Interdisciplinary Science for Innovative Air Traffic Management, 2013, pp. p–xxxx.
[14] “Compute Unified Device Architecture - CUDA technologies,” http:// www.nvidia.com/object/cuda home new.html.
[15] ICAO,Annex 2. Convention on international civil aviation, Rules of the air, 9th ed., Jul 1990.
[16] AIRBUS, Getting to grips with cost index. [Online]. Available: http://etaks.free.fr/pdf/getting to grips/The%20Cost%20Index.pdf [17] “Kerosene prices,” http://www.indexmundi.com/es/precios-de-mercado/
?mercancia=gasolina-de-aviacion&meses=12&moneda=eur, [Online; accessed January-2016].
[18] “U.S. Energy Information Administration EIA. Carbon Dioxide Emis-sions Coefficients by Fuel,” https://www.eia.gov/environment/emisEmis-sions/ co2 vol mass.cfm, [Online; accessed January-2016].