Glasgow Theses Service http://theses.gla.ac.uk/
Saleem, Gulbeena (2013)
Necrotic enteritis, disease induction,
predisposing factors and novel biochemical markers in broilers chickens.
PhD thesis.
http://theses.gla.ac.uk/4372/
Copyright and moral rights for this thesis are retained by the author
A copy can be downloaded for personal non-commercial research or
study, without prior permission or charge
This thesis cannot be reproduced or quoted extensively from without first
obtaining permission in writing from the Author
The content must not be changed in any way or sold commercially in any
format or medium without the formal permission of the Author
When referring to this work, full bibliographic details including the
author, title, awarding institution and date of the thesis must be given
Necrotic Enteritis, disease induction, predisposing factors
and novel biochemical markers in broiler chickens
BY
GULBEENA SALEEM
Doctor of Veterinary Medicine (DVM)
M.Sc. (with honours) Veterinary Pathology
A thesis is submitted for the degree of Doctor of Philosophy, at the
College of Medical, Veterinary and Life Sciences, University of Glasgow
Research conducted at the Avian Science Research Centre
Scottish Agricultural College, Ayr
November 2012
© Gulbeena Saleem
2
ABSTRACT
Necrotic enteritis (NE) is an important enteric disease in poultry production that has re-emerged as a major problem following an EU wide ban on the use of in-feed antimicrobials. Although the primary aetiological agent of disease is Clostridium perfringens type A, a commensal in the gastrointestinal tract (GIT) of chickens, numerous additional influential factors have been reported that can predispose chickens to NE. These precipitating factors mainly include diet, co-infection with other pathogens particularly coccidia, as well as environmental and management factors. Despite being first described almost more than 50 years ago, a reliable, consistently reproducible experimental model for NE induction is still lacking. Here, a series of experiments were conducted to investigate the importance of the various potential predisposing factors, in isolation and in combination, that are believed to play a role in sub-clinical NE development: feed withdrawal, dietary protein sources, co- infection with coccidia, C. perfringens dose and contact with reused litter. In addition, chicken breed sensitivity to NE was assessed, and last, but not least, blood and gut tissue samples were used to identify novel biochemical markers for sub-clinical NE.
Chapter 3 reports an experiment showing that feed withdrawal up to 24 hrs in experimentally challenged birds did not result in NE specific lesions. Chapter 4 shows that replacing dietary soyabean meal with potato protein concentrate or canola meal or adding synthetic trypsin inhibitor to the soyabean meal control diet did not induce sub-clinical NE in birds housed on reused litter, a natural source of C. perfringens challenge. Chapter 5 describes that in vitro growth of C. perfringens on in vitro digested grower diets was prolonged following the addition of fishmeal, suggesting that the role of fish meal as a predisposing factor for in vivo sub-clinical NE cannot be excluded. All subsequent diets therefore contained high levels of fish meal. When this was used in combination with high dose of coccidial vaccine, a repeated in-feed challenge for three days at 102 colony forming units (cfu) C. perfringens per g feed did not result in sub-clinical NE, though at 109 cfu/g resulted in 10% of challenged birds (3 out of 30) showing NE-specific lesions (Chapter 6). Further study is needed to determine if the two Ross birds with gross NE lesions compared to the one Hubbard bird (out of 15 birds each) was due to a lower level of NE resistance.
The failure to significantly induce sub-clinical NE in the previous experiments suggests that challenging the birds with C. perfringens in the isolated presence of suspected predisposing factors may not provide a suitable experimental model. Indeed, when birds were dosed twice daily with 108 cfu C. perfringens for three days in the presence of high levels of fishmeal, canola meal as main protein source, coccidial and IBD vaccinations, and feed withdrawal prior to challenge, 40.6% of the challenged birds developed lesions of sub-clinical NE without inducing mortality (Chapter 7). This concurred with reduced growth performance relative to the sham-infected control birds, and thus is a successful model for induction of sub-clinical NE.
Finally this work has, for the first time provided novel information on potential biomarkers (Chapter 8). Whilst challenge did not impact on the expression of genes previously shown to be differentially expressed upon C. perfringens toxin exposure, the serum ceruloplasmin concentration increased, suggesting that monitoring this acute phase protein may indicate the presence of C. perfringens infection in poultry. However, as such markers generally lack specificity, further research confirming its role in response to sub-clinical NE is needed to provide a fully effective diagnostic and prognostic marker for flock health and welfare, as well as ultimately helping to gain better understanding of the pathophysiology of sub-clinical NE.
Improved knowledge of the effect of different dietary components on the growth of C. perfringens may help in the formulation of broiler diets to assist in further reducing the incidence of NE particularly in the absence of antimicrobial growth promoters. It is hoped that host responses in terms of acute phase proteins, and possibley gene expression, will also provide greater insight into the pathogenesis of NE. Provided that the developed experimental sub-clinical NE model is reproducible, this will benefit the understanding of this billion dollar disease and enable further investigation of various chemical and non-chemical interventions to reduce its severity and impact on poultry production.
4
DECLARATION
This thesis has been composed by myself and is a record of work carried out in an original line of research, except where due reference is made to the contribution of others. All such sources of information are again listed in the reference section. All help provided during my work is sincerely appreciated and appropriately acknowledged.
None of the work has been presented in any previous degree application.
Gulbeena Saleem
PUBLICATION
Part of the work reported in this thesis has been communicated in different conference meetings:
Saleem G., N. Sparks, J. Houdijk and V. Pirgozliev (2012) Interactive effects of diet composition and litter quality on growth performance and incidence of sub-clinical necrotic enteritis in broiler chickens British Poultry Abstracts pp 7, Vol 8, Number 1, August, 2012.
Saleem G., N. Sparks, J. Houdijk and V. Pirgozliev (2012) Effect of canola meal and litter condition on gut health. British Poultry Abstracts pp 18, Vol 8, Number 1, August, 2012.
Saleem G., N. Sparks, J. Houdijk and V. Pirgozliev (2011) Experimental induction of sub-clinical necrotic enteritis in broiler chickens. British Poultry Abstracts pp 58, Vol 7, Number 1, August, 2012.
Saleem G., N. Sparks, J. Houdijk and V. Pirgozliev (2011) Proliferation of Clostridium
perfringens on in vitro digested poultry feed with and without fish meal Proceedings of 18th
European Symposium on Poultry Nutrition, pp. 778-780, Turkey.
Saleem G., N. Sparks., J. Houdijk., T. Acamovic and V. Pirgozliev (2011) Does feed withdrawal assist experimental induction of sub-clinical necrotic enteritis in broiler chickens? British Poultry Abstracts pp 4, Vol 7, Number 1, August, 2011.
Publication that does not form an integral part of the thesis per se, but is related to the main subject of the thesis is mentioned below as evidence of additional work:
Saleem G., N. Sparks, V. Pirgozliev, T. Acamovic, J. Houdijk, J. Wiseman, A. Peron, J. Snape (2010) “Effect of wheat cultivar, type and xylanase supplementation on growth performance and gut microflora of broilers” Book of Abstracts, XIIIth European Poultry Conference, pp 375.
AWARDS
During my PhD studies, I have received the following awards and travel grants:
Travel grant to present an oral paper at 18th European Poultry Conference, 2011 Izmir Turkey.
Highly commended in British Council Shine International Student Awards.
Represented SAC at Science for Life Inter-institute Competition (2011).
Internal SAC award for best presentation at SAC post- graduate conference, Edinburgh (2011).
Invitation, by the organizing committee, to attend EPC 2010 in Tours, France as well as to participate in the Youth Programme of conference.
Overseas research student Award (ORSAS), University of Glasgow, Scotland, UK.
ACKNOWLEDGEMENT
All praises and thanks to Almighty Allah and beloved prophet Hazrat Muhammad (PBUH).
I wish to acknowledge many people who have made this thesis an achievable reality. Dr Jos. Houdijk for his precious supervision, endless support, kind understanding and moral encouragement. I am grateful for the opportunity both to learn how to improve my scientific writing and presentation skills. His contributions and advice to my thesis have been invaluable.
Professor Dr. Nicholas Sparks for his endless patience and understanding with the numerous problems encountered throughout my research. I am truly grateful for his support, guidance and insight during my tenure at SAC’s Avian Science Research Centre (ASRC). Professor Dr. David Eckersall for all the support provided during acute phase protein analysis and for assistance with Glasgow University matters.
The late Dr. Tom Acamovic was a naturally joyful human being whose contact with others extended his joy to their lives. He is surely missed as a joyful, supportive and ultimate professional human being.
Dr. Spiridoula Athanasiadou for all the help and kind guidance with gene work both practical and theoretical, that enabled me to do gene expression analysis. Dr. Tombermont from University of Ghent for kindly providing the strain 56 of C. perfringens without which this research would not have been possible. Dr. Tom Pennycott for the knowledge and expertise he shared with me on post-mortem and histopathological examination.
I am greatly acknowledged to Higher Education Commission Pakistan for the PhD Scholarship.
I am truly grateful to Dr. Oluyinka Olukosi for all the help, kindness and technical support throughout these years. I would like to thank all the members of ASRC, Dr. Victoria Sandilands, Dr. Visil Pirgozliev and Dr. Sarah Brocklehurst for their friendly
8
advice and invaluable assistance. Dr. Farina Malik Khattak for being an excellent friend and colleague, who encouraged and enabled my survival during the initial days of PhD and settling in UK. To technical support staff at the Microbiology Laboratory and Veterinary Services; Libby Deans, Fraser White and Emily O'Reilly for the support provided during sample analysis. To fellow graduate students of ASRC, Waseem Mirza, Laura Beeson, Rita, Adekunle Adebiyi, Nanung Dono, Naser Asheen, and all in post-graduate office, who helped me in many different ways throughout the years.
I would like to express my sincere gratitude to my parents, Muhammad Saleem and Majeeda Saleem: for their unconditional love. I cannot express the depth of my love and gratitude for their nurturing and belief in me and for teaching me the importance of learning and for making me who I am.
My deepest and cardinal thanks goes to my sister, Samina Aslam for her love, care and being with me through the thick and thin of my life. None of these would have been possible had it not been for the guidance and inspiration of my sister Samina Aslam. Heartfelt thanks to my brothers, Muhammad Tariq Saleem, Muhammad Babar Saleem and my sister Rizwana who all pray for me everyday, and to my mother-in-law and sisters-in-law for extending their support and praying for me and my family. A lovely thank to Suaad Walker for her peaceful company.
Last and most importantly, I owe much to my husband, Jawwad Shabbir Yousafi, for his patience, support and encouragement in the long journey of achieving this degree. To my special angels: my son, Abdullah Jawwad Yousafi and my lovely daughter Nabiha Fatima Yousafi for their innocent understanding and love. It is their love that makes my life enjoyable and worth living. I owe you big time! To my whole family again, thank you for being such magnificent people. I love you all!!
Alhamdulillah for everything in these thesis years!
LIST OF ABBREVIATION
AFLP Amplified fragment length polymorphism AGPs Antimicrobial growth promoter
APP Acute phase proteins APR Acute phase reaction BHI Brain heart infusion agar
BW Body Weight
Cp Ceruloplasmin
CFU Colony forming unit
CM Canola meal
C. perfringens Clostridium perfringens
CFU Colony forming unit
CM Canola meal
CNS Central nervous system
CPH C. perfringens associated hepatitis DGGE Denaturing gradient gel electrolysis
E. Coli Eschericia coli
ELISA Enzyme Linked Immunosorbent Assay FCR Feed Conversion Ratio
FI Feed intake
GIT Gastro-intestinal tract
GOI Gene of interest
Hrs Hours
IBD Infectious bursal disease
MHC Major Histocompatibility complex MRD Maximum Recovery Diluent NE Necrotic entertitis
OD Optical density
OVT Ovotransferrin
PBS Phosphate buffer saline PCR Polymerase chain reaction PFGE Pulsed- field gel electrophoresis PPC Potato Protein concentrate
PPD p-phenylenediamine
qPCR Quantitative Polymerase chain reaction RCA Reinforced Clostridial agar
SBM Soybean meal
SFPA Shahidi Ferguson Perfringens agar
TG Thioglycollate
TI Trypsin inhibitor
TIA Trypsin inhibitor activity
TSC Tryptose Sulphite Cycloserine agar
10
TABLE OF CONTENTS
ABSTRACT ... 2 DECLARATION ... 4 PUBLICATION ... 5 AWARDS ... 6 ACKNOWLEDGEMENT ... 7 LIST OF ABBREVIATION ... 9 TABLE OF CONTENTS ... 10 LIST OF TABLES ... 15 LIST OF FIGURES ... 17 1 GENERAL INTRODUCTION ... 20 2 LITERATURE REVIEW... 22STRUCTURE AND FUNCTION OF THE GASTROINTESTINAL 2.1 TRACT OF POULTRY ... 22
Different components of Gastrointestinal Tract: ... 22
2.2 2.2.1 Mouth and Oesophagus ... 22
2.2.2 Crop ... 23
2.2.3 Proventriculus ... 23
2.2.4 Gizzard (Muscular stomach or ventriculus) ... 24
2.2.5 Small intestine ... 24
2.2.6 Caeca ... 25
2.2.7 Large Intestine or Colon... 25
2.2.8 Cloaca and Accessary organs ... 25
HISTOMORPHOLOGY OF THE SMALL INTESTINE ... 26
2.3 2.3.1 Intestinal Mucosa ... 26
MICROBIAL ECOLOGY OF THE DIGESTIVE TRACT ... 30
2.4 2.4.1 The crop ... 31
2.4.2 The proventriculus and ventriculus (Gizzard)... 32
2.4.3 Small intestine ... 32 2.4.4 The ceca ... 33 NECROTIC ENTERITIS ... 34 2.5 2.5.1 Epidemiology ... 35 2.5.2 Aetiology ... 36 CLOSTRIDIUM PERFRINGENS ... 36 2.6 2.6.1 Morphology ... 36 2.6.2 Growth characteristics ... 37
2.6.3 Toxins of Clostridium perfringens ... 38
2.6.4 Pathogenesis of necrotic enteritis and associated toxins ... 40
2.6.4.1 Αlpha -toxin ... 40
2.6.4.2 NetB Toxin ... 43
2.6.5 Disease transmission ... 44
2.6.6 Types of necrotic enteritis ... 45
2.6.7 Clinical signs ... 45
2.6.8 Gross lesions ... 46
2.6.9 Histopathological changes ... 47
EXPERIMENTAL MODELS OF NECROTIC ENTERITIS ... 48
2.7 PREDISPOSING FACTORS FOR NECROTIC ENTERITIS ... 51
2.8 2.8.1 Infectious predisposing factors for NE ... 52
2.8.1.1 Coccidiosis ... 52
2.8.1.2 Viral disease / immunosuppression ... 54
2.8.2.1 Nutrition and dietary factors ... 55 2.8.2.2 Anti-nutritional factors ... 57 2.8.3 Management ... 57 2.8.3.1 Litter ... 57 PhD OBJECTIVES ... 59 EXPERIMENTS ... 61 3 EXPERIMENT ONE: ... 61
CAN FEED WITHDRAWAL ASSIST EXPERIMENTAL INDUCTION OF SUB-CLINICAL NECROTIC ENTERITIS? ... 61
Introduction ... 62
3.1 Materials and Methods ... 63
3.2 3.2.1 Treatment Groups and Experimental design ... 63
3.2.2 Bacterial Culture & Administration (Challenge) ... 66
3.2.3 Growth performance ... 67 3.2.4 Vaccinations ... 68 3.2.5 Data Collection... 68 3.2.5.1 Sampling of birds ... 68 3.2.5.2 Lesion scoring ... 69 3.2.5.3 Histopathology ... 69
3.2.5.4 Enumeration of C. perfringens, total coliforms and lactobacilli ... 70
3.2.5.5 Quantification of α-toxin in intestinal digesta... 71
3.2.5.6 Growth parameters ... 72 3.2.6 Statistical Analysis ... 72 Results ... 73 3.3 3.3.1 Lesion score ... 73 3.3.2 Histopathology ... 73
3.3.3 Quantification of different bacteria and α-toxin in ileal digesta ... 74
3.3.4 Growth performance ... 76 Discussion ... 79 3.4 Conclusion ... 83 3.5 4 EXPERIMENT TWO: ... 84
INTERACTIVE EFFECTS OF DIET COMPOSITION AND LITTER CHALLENGE ON THE INCIDENCE OF SUB-CLINICAL NECROTIC ENTERITIS IN BROILER CHICKENS ... 84
Introduction ... 85
4.1 Materials and Methods ... 88
4.2 4.2.1 Treatment Groups and Experimental Design ... 88
4.2.2 Feeding treatments ... 88
4.2.3 Litter treatment (Challenge procedure) ... 89
4.2.4 Experimental design ... 91
4.2.5 Sampling and data recording ... 91
4.2.5.1 Clinical signs and lesion scoring ... 91
4.2.5.2 Histopathology ... 92
4.2.5.3 Quantification of C. perfringens and α-toxin in digesta ... 93
4.2.5.4 Growth performance ... 93 4.2.5.5 Analysis of litter ... 93 4.2.5.6 Feed Analysis ... 95 Statistical analysis ... 95 4.3 Results ... 96 4.4 4.4.1 Gross lesions ... 97 4.4.2 Histopathology ... 99
4.4.3 Quantification of C. perfringens and α-toxin in ileal digesta ... 99
12 4.4.5 Growth performance ... 104 Discussion ... 110 4.5 Conclusion ... 115 4.6 5 EXPERIMENT THREE: ... 116
EFFECTS OF ADDING FISH MEAL TO GROWER BROILER DIETS ON PROLIFERATION OF CLOSTRIDIUM PERFRINGENS ON IN VITRO DIGESTED DIETS ... 116
Introduction ... 117
5.1 Materials and Methods ... 118
5.2 5.2.1 Experimental diets ... 118
5.2.2 In-vitro Digestion of Diets ... 119
5.2.3 Preparation of inoculum ... 119
5.2.4 Proliferation of C. perfringens on in vitro digested diets ... 120
Statistical Analysis ... 121 5.3 Results: ... 121 5.4 Discussion ... 124 5.5 Conclusion ... 126 5.6 6 EXPERIMENT FOUR: ... 127
INDUCTION OF SUB-CLINICAL NECROTIC ENTERITIS THROUGH IN-FEED CHALLENGE WITH LOW AND HIGH DOSES OF CLOSTRIDIUM PERFRINGENS ... 127
6.1 Introduction ... 128
6.2 Materials and Methods ... 129
6.1.1 Treatment groups and Experimental Design ... 129
6.1.1.1 Experiment 4a ... 129
6.1.1.2 Experiment 4b ... 129
6.1.2 Diet and feed mixing: ... 131
6.1.3 Preparation of inoculum and challenge procedure ... 133
6.1.4 Coccidial Vaccination ... 134
6.1.5 Sampling and data recording ... 134
6.1.5.1 Enumeration of C. perfringens in BHI and feed ... 134
6.1.5.2 Clinical signs and lesion scoring ... 134
6.1.5.3 Histopathology ... 135
6.1.5.4 Quantification of C. perfringens and α-toxin in digesta ... 135
6.1.5.5 Growth performance ... 136 6.1.5.6 Feed analysis ... 136 Statistical Analysis ... 136 6.2 Results ... 137 6.3 6.3.1 Enumeration of C. perfringens in feed ... 137
6.3.2 Lesions score ... 137
6.3.3 Histopathology ... 140
6.3.4 Quantification of C. perfringens and α-toxin in the ileal digesta ... 142
6.3.5 Growth performance ... 142 Discussion ... 145 6.4 Conclusion ... 149 6.5 7 EXPERIMENT FIVE: ... 150
INDUCTION OF SUB-CLINICAL NECROTIC ENTERITIS WITH HIGH DOSES OF CLOSTRIDIUM PERFRINGENS THROUGH GAVAGE CHALLENGE IN THE PRESENCE OF A COMBINATION OF PREDISPOSING FACTORS ... 150
7.1 Introduction ... 151
7.2 Materials and Methods ... 152
7.2.1 Treatment groups and Experimental Design ... 152
7.2.3 Preparation of inoculum and challenge procedure ... 154
7.2.4 Infectious Bursal disease vaccination ... 155
7.2.5 Coccidial vaccination ... 155
7.3 Sampling and data recording ... 155
7.3.1 Enumeration of C. perfringens in BHI and feed ... 155
7.3.2 Clinical signs and lesion scoring ... 156
7.3.3 Histopathology ... 156
7.3.4 Quantification of C. perfringens and α-toxin in digesta ... 157
7.3.5 Growth performance ... 158
7.3.6 Feed analysis ... 158
7.4 Statistical Analysis ... 158
7.5 Results ... 159
7.5.1 Enumeration of C. perfringens in BHI ... 159
7.5.2 Lesions score ... 159
7.5.3 Histopathology ... 165
7.5.4 Quantification of C. perfringens and α-toxin in the ileal digesta ... 167
7.5.5 Growth performance ... 169
7.6 Discussion ... 171
7.7 Conclusion ... 176
8 SIX: ... 178
IDENTIFICATION OF BIOCHEMICAL MARKERS FOR SUB-CLINICAL NECROTIC ENTERITIS IN BROILER CHICKENS ... 178
8.1 Introduction ... 179
8a: Acute Phase Protein ... 182
Materials and Methods ... 182
8.2 8.2.1 Determination of ceruloplasmin in blood serum ... 183
8.2.2 Determination of PIT54 in blood serum ... 183
8.2.3 Determination of ovotransferrin in blood serum ... 184
8.3 APP: Statistical analysis ... 185
APP: Results ... 185
8.3 8.3.1 Serum Ceruloplasmin concentration ... 185
8.3.2 Serum PIT54 concentration... 186
8.3.3 Serum ovotransferrin concentration ... 186
8.5 APP: Discussion ... 190
8.6 APP: Conclusion ... 192
8b: Gene expression ... 193
Materials and Methods ... 193
8.7 8.7.1 Tissue collection... 193
8.7.2 Tissue disruption and RNA Isolation ... 194
8.7.3 Conversion of RNA into cDNA ... 195
8.7.4 Quantitative reverse transcriptase polymerase chain reaction (qPCR) ... 195
Gene expression: Statistical analysis... 198
8.8 Gene expression: Results ... 198
8.9 8.9.1 Expression of fas ... 198
8.9.2 Expression of BL-A ... 199
8.9.3 Expression of NBL1 ... 199
8.9.4 Expression of GIMAP8 ... 200
Gene expression: Discussion ... 202
8.10 Gene expression: Conclusion ... 205
8.11 9 GENERAL DISCUSSION... 206
Introduction ... 207
9.1 Responses of broiler chickens to various predisposing factors used in 9.2 various experiments of this PhD project ... 208
14
9.2.1 Feed withdrawal /Fasting ... 208
9.2.2 Vegetable protein source ... 209
9.2.3 Trypsin inhibitor ... 210
9.2.4 Fish meal ... 210
9.2.5 Effect of combination of predisposing factors on experimental induction of sub-clinical NE ... 211
9.2.6 Coccidiosis ... 213
9.2.7 Dietary amino acids... 213
Impact of low and high doses of C. perfringens through in feed challenge on 9.3 experimental induction of sub-clinical NE ... 219
Experimental disease model for sub-clinical NE ... 220
9.4 Biochemical markers of sub-clinical NE ... 221
9.5 9.5.1 Acute phase proteins response to sub-clinical NE ... 221
9.5.2 Expression pattern of host gene in response to C. perfringens challenge . 223 10 CONCLUSION ... 226
11 FUTURE WORK /RECOMENDATIONS ... 227
12 REFERENCES ... 229 13 APPENDICES: ... 257 Appendix A ... 257 13.1 Appendix B ... 258 13.2 Appendix C ... 259 13.3 Appendix D ... 261 13.4 13.4.1 RLT BUFFER ... 261 13.4.2 70% ETHANOL... 261
LIST OF TABLES
Table 2.1: Different types of media used for diagnosis of Clostridium perfringens ... 38
Table 2.2: Major toxins used for typing C. perfringens as well as the enterotoxin and their genetic location ... 39
Table 2.3: Different methods for molecular diagnosis and/or Genetic diversity of clostridium perfringens ... 40
Table 2.4: Experimental reproduction of disease ... 50
Table 2.5 : Various predisposing factors for NE ... 54
Table 3.1: Experimental design ... 64
Table 3.2: Ingredients and calculated composition (g/kg) of starter (days 0-10) and grower (days 10-28) experimental diets in experiment one ... 65
Table 3.3: Average feed intake and feed conversion ratio of groups of broilers on different days in different treatment groups ... 77
Table 3.4: Average body weight and weight gain of groups of broilers on different days in different treatment groups ... 78
Table 4.1: Feed ingredients and calculated chemical composition (g/kg) of the experimental grower diets. ... 90
Table 4.2: Experimental treatments used in the experiment ... 91
Table 4.3: Litter analysis (day 30) of different dietary treatment groups ... 103
Table 4.4: Growth performance, C. perfringens counts in ileal digesta and litter and litter pH (on day 21) of male broiler chickens fed canola meal with clean and reused litter. ... 109
Table 5.1: Feed ingredients and calculated chemical composition (g/kg) of the basal grower diet ... 118
Table 6.1 : Experimental design for experiment 4a and 4b showing the days of age at which the challenges and vaccines were given and the days for lesion scored ... 130
Table 6.2: Ingredients and calculated composition (g/kg) of starter and grower diets used in experiments 4a and 4b ... 132
Table 6.3: Occurrence of lesions of sub-clinical NE in the small intestine of broiler chickens on day 21 in experiments 4a and 4b ... 138
Table 6.4: The growth performance and C. perfringens counts (day 21) in ileal digesta of broilers chickens in challenge and control treatment groups in experiment 4a ... 143
Table 6.5: The growth performance and counts of C. perfringens (day 21) in ileal digesta of broiler chickens in control and challenge treatment groups in experiment-4b. ... 144
16
Table 7.1: Feed ingredients and calculated chemical composition (g/kg) of the experimental diets ... 153 Table 7.2: Occurrence of lesions (sub-clinical NE and coccidiosis) in small intestine of broiler chickens on different days (pre-challenge and post-challenge). ... 161 Table 7.3: Occurrence of coccidial lesions in small intestine of broiler chickens on different days (pre-challenge and post-challenge with C. perfringens gavage). ... 161 Table 7.4 : Counts of C. perfringens in ileal digesta of control and challenged broiler chickens on different post-challenge days ... 168 Table 7.5: The growth performance of broiler chickens in challenge and control treatment group ... 170 Table 8.1: Sequence of oligonucleotide primers used in quantitative real-time PCR .. 197
LIST OF FIGURES
Figure 2.1: The general structure of Chickens digestive tract. ... 23
Figure 2.2: Cross section of intestinal wall showing four different layers. ... 26
Figure 2.3 : Epithelial layer of intestine (columnar epithelium). ... 27
Figure 2.4 : Goblet cells. ... 28
Figure 2.5: Mode of action of α-toxin. ... 42
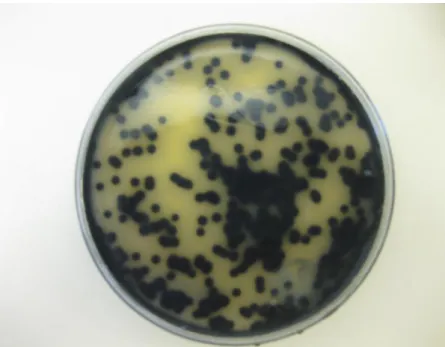
Figure 3.1: Black colonies of C. perfringens on Tryptose Sulphite Cycloserine (TSC) agar medium. ... 67
Figure 3.2: Gavaging birds with Clostridium perfringens broth. ... 68
Figure 3.3: Photomicrograph of the intestine of broilers, showing presence of coccidial macrogamete (arrow), the overall architecture of villi are preserved. Haematoxylin and Eosin (x40). ... 74
Figure 3.4: Ileal digesta microflora of broilers chickens on day 28 post hatch subjected to different period of feed withdrawal: Group 1: full fed control; Group 2: 8 and 15 hrs feed withdrawal on days 10 and 18, respectively; Group 3: 15 and 24 hrs feed withdrawal on days 10 and 18, respectively. The error bar is the standard error of the mean (SEM). ... 75
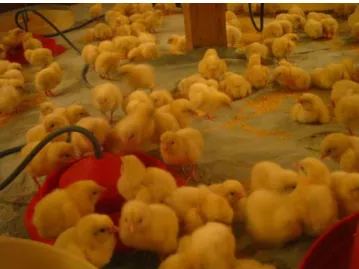
Figure 4.1: Broiler chickens reared as single flock during 0-16 days of experiment. .... 87
Figure 4.2: Addition of reused litter. ... 87
Figure 4.3 : Broiler chickens reared in different experimental pens with clean and reused litter. ... 87
Figure 4.4: Bird showing signs of depression fed canola meal dietary treatment with litter challenge. ... 96
Figure 4.5: Mucosal surface of intestines of broiler chickens fed canola meal dietary treatment group with challenged litter (a) Duodenum (b) Ileum, arrows showing white lesions of coccidiosis (c) caeca, circle showing haemorrhages. ... 98
Figure 4.6: photomicrography of intestine of broiler chicken fed canola meal diet with litter challenge showing presence of shizonts of Eimeria acervulina (arrow) H and E (x40). ... 99
Figure 4.7: Concentrations of C. perfringens in ileal digesta of broiler chickens (on days 30-32 post hatch) subjected to different dietary treatments (SBM: soybean meal; SBM + TI: soybean meal with added synthetic trypsin inhibitor and PPC: potato protein) with and without litter challenge (clean and reused)... 101
Figure 4.8: Body weight of broiler chickens (on day 30 post hatch) subjected to different dietary treatments (SBM: soybean meal; SBM + TI: soybean meal with added synthetic trypsin inhibitor and PPC: potato protein) with and without litter challenge (clean and reused). ... 105
18
Figure 4.9: Weight gain of broiler chickens (on days 16-30 post hatch) subjected to different dietary treatments (SBM: soybean meal; SBM + TI: soybean meal with added synthetic trypsin inhibitor and PPC: potato protein) with and without litter challenge (clean and reused). ... 106 Figure 4.10: Feed intake of broiler chickens (on days 16-30 post hatch) subjected to different dietary treatments (SBM: soybean meal; SBM + TI: soybean meal with added synthetic trypsin inhibitor and PPC: potato protein) with and without litter challenge (clean and reused). ... 107 Figure 4.11: FCR of broiler chickens (on days 16-30 post hatch) subjected to different dietary treatments (SBM: soybean meal; SBM + TI: soybean meal with added synthetic trypsin inhibitor and PPC: potato protein) with and without litter challenge (clean and reused). ... 108 Figure 5.1: Proliferation of C. perfringens in controls, supernatants from grower diet with and without 30% fish meal. TG: Thioglycollate; +30% Fish meal: supernatant from grower diet with added 30% fish meal; Grower: supernatant from simple grower diet. ... 123 Figure 6.1: Focal necrosis (black circles)in the mucosa of intestine of broiler chickens receiving higher concentration of C. perfringens (approximately 109) and higher dose of coccidial vaccine with high fishmeal diets (experiment 4b). ... 139 Figure 6.2: Photomicrography of the intestine of broilers exhibited gross lesions of sub-clinical NE in experiment 4b (a) necrotic villi and presence of fibrin like material in the lumen, Gram stain (x10) Figure 2 (b) same section showing aggregation of Gram positive bacilli (arrow) thickly clustered around necrotic villi, Gram stain (x40). ... 141 Figure 6.3: Counts of C. perfringens (cfu/g) in feed and ileal digesta of different treatment groups. ... 147 Figure 7.1: Evaluation of sub-clinical NE lesion score (percentage) in broilers subjected to different treatments (control and challenge) on different days of age (21, 25, and 26). ... 160 Figure 7.2: Focal necrosis in the mucosa of jejunum of broiler chickens receiving a challenge with C. perfringens through gavage ... 162 Figure 7.3: Focal ulceration on mucosal surface of small intestine of broiler chickens coalesced to form discrete patches ... 163 Figure 7.4: Extensive diffuse mucosal necrosis on mucosal surface of small intestine of broiler chicken. Note the appearance of pseudo membrane ... 164 Figure 7.5: Intestine of broiler chickens showing (a) epithelial detachment (b) separation of epithelial cell layer from underlying lamina propria (c) note base of normal intact cells at base separated from necrotic tissue by clusters of bacteria (H & E; 40x). ... 166 Figure 7.6: Gram stained C. perfringens on tip of villi (black arrow). ... 166 Figure 7.7: Formation of pseudo-membrane on villous surface. Note the presence of C. perfringens (black arrows) on desquamated villi (x 10). ... 167
Figure 7.8: Alpha toxin level (optical density unit, OD450) in the ileal digesta of broilers chickens in control and C. perfringens challenged treatment groups. a-b values within treatment groups with different superscripts are significantly different (P<0.001). ... 169 Figure 8.1: Biochemical auto analyser used to determine ceruloplasmin and PIT 54 concentrations in the serum of broiler chickens. ... 184 Figure 8.2: Serum ceruloplasmin concentration of male and female in challenged and unchallenged control treatment groups on days 16 (pre-challenge), 21,25, and 26 (post challenge). ... 187 Figure 8.3 : Serum PIT54 concentration of male and female in challenged and unchallenged control treatment groups on days 16 (pre-challenge), 21,25, and 26 (post challenge). ... 188 Figure 8.4: Serum Ovotransferrin concentration of male and female in challenged and unchallenged control treatment groups on days 16 (pre-challenge), 21,25, and 26 (post challenge). ... 189 Figure 8.5: Effect of experimental challenge with C. perfringens on relative expression of fas in intestine of broiler chickens. ... 198 Figure 8.6: Effect of experimental challenge with C. perfringens on relative expression of BL-A in intestine of broiler chickens. ... 199 Figure 8.7: Effect of experimental challenge with C. perfringens on relative expression of NBL1 in intestine of broiler chickens. ... 200 Figure 8.8: Effect of experimental challenge with C. perfringens on relative expression of GIMAP8 in intestine of broiler chickens. ... 201
Figure 9.1: Indispensable (essential) amino acid composition of different grower diets used in experiment 2. ... 215 Figure 9.2 : Dispensable (non-essential) amino acid composition of different grower diets used in experiment 2. ... 216 Figure 9.3: Indispensable (essential) amino acid composition of grower diets used in experiment 4 and experiment 5. ... 217 Figure 9.4: Dispensable (Non-essential) amino acid composition of grower diets used in experiment 4 and experiment 5. ... 218 Figure 13.1: Growth of C. perfringens in different media. BHI: Brain heart infusion broth; TG, thioglycolate at different intervals of time. ... 260
Chapter 1 20
1
GENERAL INTRODUCTION
Necrotic enteritis (NE) remains a major problem in the modern poultry industry, although in the past, it has been controlled by in-feed microbials, and ionophore anti-coccidials (Collier et al., 2003). However it has re-emerged as a significant problem, causing reduced growth performance together with increased feed costs, following an EU wide ban on in-feed growth promoters. The sub-clinical form of NE is more disastrous since it can be more pervasive within the flock and mostly goes un-noticed and therefore undetected because of absence of evident clinical signs and/or symptoms (Kaldhusdal et al., 2001; Hofacre et al., 2003; Skinner et al., 2010; Timbermont et al., 2009a). This usually results in condemnation of carcasses at time of slaughter (Kaldhusdal & Hofshagen, 1992). Although it is becoming progressively more apparent, the economic impact of sub-clinical NE has not been formally investigated (Skinner et al., 2010). Overall the main feature of the disease is the occurrence of necrotic lesions in the small intestine mostly in the jejunum and ileum but occasionally in the duodenum (Alsheikhly & Truscott, 1977b; Ficken & Wages, 1997). Decreased digestion and absorption, reduced weight gain and an increased feed conversion ratio are a direct result of the damage to intestinal mucosa caused by the sub-clinical form of the disease (Kaldhusdal et al., 2001). Poultry farms cannot afford to ignore the economic losses caused by this disease, despite its sporadic nature in developing countries as it is still causing large scale outbreaks in chicken production units. However, the total impact of fully developed NE on chicken production is difficult to determine accurately due to the nature of sub-clinical NE.
The primary causative organism is a gram positive, anaerobic, spore forming bacterium, Clostridium perfringens, a commensal in the gastrointestinal tract (GIT) of poultry (Ficken & Wages, 1997) that has been isolated from feed, litter, dust, and faeces (Wages & Opengart, 2003). Despite identification of numerous factors that promote the development of sub-clinical NE, the exact field conditions that precipitate the out breaks of NE are still ambiguous. Together with a degree of co-infection with Eimeria, the predisposing factors are mainly dietary in nature. Currently, the only way to assess the degree of host response is by scoring gross pathological lesions within the intestine.
Under experimental conditions it has proved difficult to induce sub-clinical NE, although C. perfringens has been identified as the disease’s primary etiological agent.
There is currently some understanding of the disease’s progression, but is still unclear as to the predisposing factor(s) that lead to the induction of NE following an overgrowth
of C. perfringens in the GIT. Contradictory results from experiments have left the
numerous predisposing factors still ill defined (Kaldhusdal et al., 1999). It is therefore essential to develop a reproducible experimental model for induction of sub-clinical NE in order to achieve more effective control of this costly disease as financial cost of NE has been estimated to be £1.6 billion per year to the world’s poultry industry (Van der Sluis, 2000). This will enable control of strategies and exploration of new methods to allow testing of a variety of factors, such as feed additives, vaccines and a range of new approaches. The focus of this thesis is:
1) To clarify the role of the different, conflicting predisposing factors, in order to develop a model for induction of sub-clinical NE. The predisposing factors being considered are: feed withdrawal, diet, contact with reused litter, genotype of chickens and co-infection with other pathogens in isolation and/ or in combination as well as testing breed sensitivity to disease induction.
2) To identify novel biochemical markers for sub-clinical NE in broiler chickens. It is anticipated that such additional markers will help to identify the presence of sub-clinical NE, and to increase our understanding of the nature of host responses to C. perfringens infection.
The major focus of the work described in this thesis is to prioritize the risk factors that purportedly expose birds to an increased risk of sub-clinical NE whilst also contributing to an advance in new preventative strategies to enable control of this billion dollar disease in a post anti-biotic era. This will be through developing a model for induction of sub-clinical NE based on an improved understanding of the involvement and relevance of the many anecdotal and research identified potential risk factors for NE both in isolation and/or in combination.
Chapter 2 22
2
LITERATURE REVIEW
Necrotic enteritis (NE) is an enteric disease caused by overgrowth of a commensal
C. perfringens. This overgrowth also results in changes not only of the digestive tract
environment, but also its bacterial ecology and histopathology. In order to adequately understand (sub-clinical) NE itself, it is therefore essential to briefly review the anatomy of a chicken’s digestive tract, its histomorphology and microbial ecology.
STRUCTURE
AND
FUNCTION
OF
THE
2.1
GASTROINTESTINAL TRACT OF POULTRY
The GIT acts as a gateway for various nutrients to gain access to the circulatory system. The major function of the digestive system is to assimilate nutrients that are required for maintenance, growth, and reproduction of the organism. Intake of feed is accompanied by quick development of the GIT and its associated organs (Uni et al., 1998). Early development of the digestive tract is crucial for achieving better growth and performance in chickens (Tako et al., 2004).
Different components of Gastrointestinal Tract:
2.2
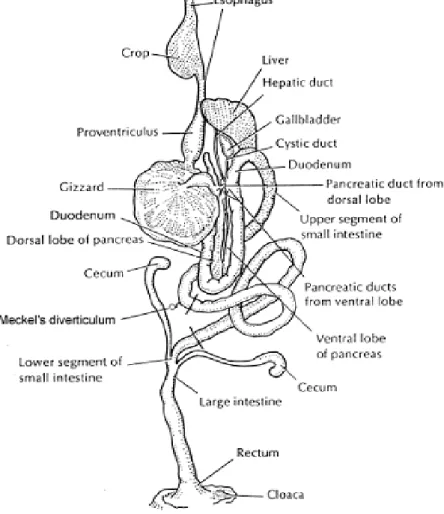
The anatomy of the chicken GIT is unique. Main components of digestive system of birds are beak, mouth, oesophagus, crop, proventriculus or glandular stomach, Gizzard or muscular stomach, small intestine and large intestine (North & Bell, 1990). The general structure of the digestive tract of fowl is illustrated in Figure 2.1.
2.2.1
Mouth and Oesophagus
Chickens have no lips, soft palate, cheeks or teeth, but there are an upper and lower horny mandible referred to as beak (also known as rostrum) to enclose the mouth (Turk, 1982). The oesophagus starts from mouth along the neck enters thoracic cavity and into the glandular stomach (Bradley & Grahame, 1960). The oesophagus acts as passage for food from the mouth to the glandular stomach.
2.2.2
Crop
The crop is a thin-walled storage pouch on the ventral end of the oesophagus (Hill, 1976). While the crop is well known for its storage function, along with some bacterial fermentation (Turk, 1982). Although the crop is a non-secretary organ, it contains enzymes and secretions from saliva, feed and microbes. Bacterial fermentation in the crop results in lactic acid production (Fuller & Brooker, 1974).
Figure 2.1: The general structure of Chickens digestive tract.
(Sturkie, 1976).
2.2.3
Proventriculus
The crop enters the proventriculus, sometimes called the “glandular stomach” or “true stomach”, that is lined with a glandular mucus membrane. Gastric juices like pepsin (the enzyme for protein digestion) and hydrochloric acid are secreted by
Chapter 2 24
glandular cells of the proventriculus. Ingested feed passes quickly through the proventriculus so there is little digestion of ingested particles here. However, most digestive enzyme action takes place in the next portion of the GIT, “the gizzard”, (North & Bell, 1990).
2.2.4
Gizzard (Muscular stomach or ventriculus)
The gizzard lies between the proventriculus and the upper limit of the small intestine (duodenum). In the gizzard larger food particles are ground and reduced to small particles capable of being taken into the intestinal tract for further digestion and absorption (North & Bell, 1990).
2.2.5
Small intestine
The small intestine starts from the posterior end of the gizzard and ends at the ileo-caecal junction. The small intestine is about 62 inches long in the average adult chicken and is divided into the duodenum, jejunum, and ileum. The duodenum is the proximal portion of the intestine, extending from the gizzard to the pancreatic and biliary ducts, and encloses the pancreas to form a U-shaped structure also known as the “duodenal loop”. The duodenum is the principal site of nutrient absorption in the chicken (Duke, 1986). Next to the duodenum lies the jejunum, the segment extending from the pancreatic ducts to the Meckel’s diverticulum or yolk sac diverticulum (sometimes also known as the yolk stalk). Meckel’s diverticulum is used as a land mark to separate the jejunum and ileum (Denbow, 2000). The ileum extends from Meckel’s diverticulum to the ileo-caecal junction. Quantitatively, most digestion and absorption takes place in the small intestine (Turk, 1982), where chemical action by pancreatic enzymes aids digestion, also helped by bile, intestinal secretions and various microbes harbouring gut lumen (Darel and Duke, 2004).
The small intestine of newly hatched chickens is relatively immature and undergoes significant morphological development during the first few days of life (Uni & Argov, 2006). The intestine of a newly hatched chicken increases in weight more rapidly than its body mass during the first 10 days (Noy & Sklan, 1999) with the highest growth rate at 5-7 days of age (Dibner et al., 1996; Uni et al., 1999; Uni & Argov, 2006). A two to four fold increase in intestinal length has been observed up to 12 days
of age, while the weight of three intestinal segments (duodenum jejunum and ileum) increased seven to ten fold
2.2.6
Caeca
At the junction of the small and large intestine there are two blind pouches known as caeca (Denbow, 2000). Each caecum is about 6 inches long, it is the largest part of the large intestine and is the main site of bacterial fermentation in poultry. Caeca are also assumed to have a role in the mixing of digesta and absorption of nutrients as well as fermentation (Ewing, 2008). The majority of obligatory anaerobes such as clostridia are present in the caeca (Barnes et al., 1972).
2.2.7
Large Intestine or Colon
The large intestine is relatively short in the chicken, being only 4 inches. It extends from the end of the small intestine to the cloaca. The main function of the large intestine is water re-absorption (North & Bell, 1990).
2.2.8
Cloaca and Accessary organs
At the end of the digestive tract of birds there is the cloaca that serves as a common pathway for excretory, reproductive and digestive wastes (Denbow, 2000). The Bursa of Fabricious, one of the main lymphoid organs in poultry is located in the cloaca.
Certain organs, such as the pancreas, liver and gall bladder are directly associated with digestion as their secretions empty into the intestinal tract and aid the digestion of ingested food material (North & Bell, 1990).
Digestion consists of a number of physical and chemical processes. Feed is ingested, broken down into smaller particles, acted upon by digestive secretions, and propelled through the GIT by the muscular activities of the tract. Salivary, gastric, pancreatic, biliary, and intestinal secretions collectively provide mucus for protection and lubrication of the tract. Enzymes from the GIT and its associated organs aid in the hydrolysis of carbohydrates, protein, and lipids into smaller compounds for absorption.
Chapter 2 26
Commensal microflora ferment and break down certain complex carbohydrates that are not digested by endogenous enzymes, thus providing additional nutrients. The microflora of the GIT also synthesizes some amino acids and vitamins essential to the host animal. Bacterial enzymes not only help in digestion of carbohydrates but also encourage digestion of protein and lipids that ultimately contribute to the nutrition of the host (North & Bell, 1990).
HISTOMORPHOLOGY OF THE SMALL INTESTINE
2.3
The whole GIT consists of four layers or tunics as does the intestinal wall. As such, the intestine is a multi-layered tube containing a serosal layer, a longitudinal muscular layer, a sub mucosal layer and a mucosal layer (Turk, 1982; Denbow, 2000).
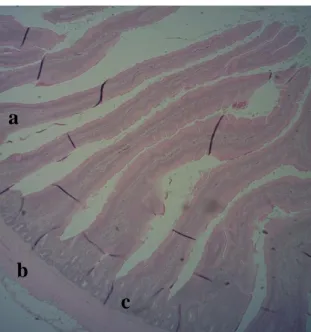
Figure 2.2: Photomicrograph of duodenum showing different layers. (a) Villi (b) Muscular layer (c) crypt. Haematoxylin and Eosin (x4).
2.3.1
Intestinal Mucosa
The mucosa of the GIT is a functional boundary between the environment and the internal physiological compartments of any organism. Intestinal mucosa consist of three layers: epithelium, lamina propria and a muscular layer (Denbow, 2000). The epithelium of the intestine is not only a highly specialized site for absorption but it also provides a good environment for various microbes harboured in the gut (Figure 2.3). Absorption takes place principally through the mucosa of the small intestine. Within the
a
b
mucosa the main site of nutrient digestion and absorption is the epithelial layer (Turk, 1982).
Figure 2.3 : Epithelial layer of intestine (columnar epithelium).
The interior surface of an avian intestine lacks the macroscopic mucous membrane folds that are usually seen in large mammals although it is folded into numerous structures called villi (Figure 2.2; Turk, 1982). Villi increase in size and number as progress down to duodenum giving them a greater absorptive surface per unit of intestine. The duration of villous growth varies: duodenal villous growth is almost complete by day 7, although jejunum and ileum villi development continues beyond 14 days of age (Uni et al., 1995; Uni et al., 1999). Villi are present throughout the length of both the small and large intestines, but length is not consistent between the small and large intestines. There is a steady decrease in the height along the way, being longer in the duodenum at 1.5mm but decreasing in length to 0.4-0.6 mm in the ileum and rectum (Denbow, 2000). Over time, the number of villi increases in both the duodenum and jejunum but not in the ileum (Geyra et al., 2001a).
Between the villi are the Crypts of Lieberkhuhn (Figure 2.2), in which there is a continuous renewal of cell populations called stem cells (crypt cells). These cells have a life cycle of 48 to 96 hours under normal conditions (Uni et al., 1998). Stem cells proliferate by mitosis and then migrate to the top of the villi (Turk, 1982). During this migration process, the enterocytes (intestinal epithelial cells) differentiate into principal (absorptive), or goblet (secretory) cells. Upon reaching the tip of the villus these cells are sloughed into the lumen of the intestine. In this way epithelial cells are continuously replaced by new epithelial cells (Turk, 1982; Uni & Argov, 2006). The crypts contain the undifferentiated cells, goblet cells, endocrine cells and lymphocytes. Paneth’s cells and globular leukocytes are present at the base of the crypts (Denbow, 2000). Enterocytes migrate from the crypt up the villi until they are exfoliated into the lumen and are sloughed into the lumen from the villi tip (Turk, 1982). An increase in the total
Chapter 2 28
number of enterocytes is observed with age, due to a dramatic increase in villi length (Uni et al., 1998).
The surface of the villi is covered by enterocytes that have tiny cylindrical projections on their luminal borders. These microvilli further increase the surface area available for absorption. In the inner wall of the villi, just underneath the epithelial cells, is the lamina propria. The lamina propria consists of connective tissue, capillaries, smooth muscle, and nerve fibres. The capillaries bring the blood stream to the base of the epithelial cells so that only one cell layer separates the lumen of the intestine from the blood (Turk, 1982). This facilitates the absorption of nutrients from the lumen of the intestine and their release into the blood stream.
Goblet cells are highly exocrine cells that produce acidic and neutral mucins in similar proportions. There are many goblet cells present between the columnar cells of the surface epithelium and in the superficial parts of the simple glands (Figure 2.4). The goblet cells are scattered over the surface of villi interspersed with absorptive cells. Goblet cells are distributed along the villi (Uni et al., 2003). Goblet cells are short lived and continuously undergo replacement (Uni et al., 2003). They are produced from pluripotent stem cells at the base of the crypt from where they migrate towards the villi tip where they are sloughed off into the lumen. This process takes 2-3 days (Geyra et al., 2001b), and the number of goblet cells increases with chicken age in all regions of the intestine.
Figure 2.4 : Goblet cells.
The goblet cells synthesize and secrete a mucopolysaccharide called mucin (Turk, 1982). Upon secretion, the mucin hydrates and gels, which generates a protective
mucus layer over the epithelial surface. This layer undergoes continuous degradation and renewal. Other components that reside within the mucus layer include water, electrolytes, sloughed epithelial cells and secreted immunoglobins. This produces a physical and chemical barrier that protects the epithelium from luminal agents such as enteric bacteria, bacterial and environmental toxins and some dietary components that pose a threat to the mucosa (Uni, 2006). The mucus layer also plays a crucial role in nutrient transport between the lumen and brush border membrane (Uni et al., 2003).
It has long been believed that mucin, which is the major component of the mucus layer, has a function that is largely associated with lubrication of bolus movement (Moran, 1985). This mucin layer is also believed to be capable of aggregating several bacterial species and modulating their adherence to the intestinal epithelium, and thus plays an important role in the maintenance of normal microflora. Additional protective factors provided by the mucin are accumulation of bactericidal and bacteriostatic compounds, and secretary immunoglobulin A, all compounds capable of neutralizing or killing toxic bacteria (Robert et al., 1991; Thompson & Applegate, 2005). However, mucin also serves a protective function by discouraging the translocation of harmful micro organisms, binding chemical irritants, establishing the unstirred water layer, protecting the underlying epithelial cells, providing a medium for the colonization of favourable microflora, and interacting with the intestinal immune system (Ferket et al., 2005; Thompson & Applegate, 2005). Thus, it is generally agreed that the mucin layer is an important factor in maintaining a strong intestinal barrier against pathogen invasion (Thompson and Applegate, 2005).
Early functionality of the GIT is vital for the growth performance of chickens, making it crucial to achieve optimal intestinal development and functional capacity. The small intestine of a newly hatched chicken is immature and undergoes dramatic changes during the first few days post-hatch. The extensive changes in the morphological development of the small intestine close to immediate-post-hatch includes the differentiation of enterocytes and the definition of crypts as well as the multi- fold enlargement of the intestinal absorptive surface (Uni & Argov, 2006).
Most of the digestion in a bird’s intestinal tract occurs in the lumen of the intestine under the influence of the digestive enzymes secreted by the pancreas and intestinal wall as well as the bile secreted by the liver. Digestion of sugars and peptides
Chapter 2 30
into absorbable monomers, however, takes place within the brush border by the enterocytes, facilitated by membrane bound enzymes (Turk, 1982).
MICROBIAL ECOLOGY OF THE DIGESTIVE TRACT
2.4
The GIT supports an ecosystem that harbours a large and diverse population of bacteria, which create symbiotic relationships with the host (Apajalahti, 2005). There are more bacterial cells residing within the intestinal tract than there are cells of the host organism (Mead, 2000). The microflora of the intestinal tract of broiler chickens influences digestion, gut morphology, immune responses and health. The gut flora is also believed to both protect against intestinal colonization of pathogens and to stimulate the immune response (Mead, 2000). The microbes in the intestinal tract can become attached to mucosal surfaces or food particles, or remain free-living in the lumen (Gabriel et al., 2006). The major sites of microbial activity in the GIT are those in which conditions are relatively stable and the digesta is retained long enough for significant microbial growth to occur (Mead, 2000).
Most of the work on avian gut flora has been done using domestic chickens rather than the commercial poultry currently used in the industry (Fuller, 1984). Intestinal bacteria evolve with age; at hatch, the GIT is a sterile environment after which the flora grows rapidly (Gabriel et al., 2006) and maximum densities of bacteria are reached within the first 5 days post hatch (Apajalahti et al., 2004). During the following weeks the composition of flora changes rapidly, taking 30 or more days in the caeca to develop a stable and dynamic population (Barnes et al., 1972; Lu et al., 2003). Many factors can affect the compositionof the avian gut flora, including species, strain, age, diet, sex; environmental stressors, performance enhancers, antibiotic administration and infection withpathogenic organisms (Smith, 1965a; Knarreborg et al., 2002; Hume et al., 2003; Pedroso et al., 2006).
The intestinal microflora is an integral part of the digestive system of all animals, and in common with all living organisms they have nutritional and environmental requirements. Microflora harbouring the gut derives most of its energy for reproduction and growth from dietary compounds that are either resistant to digestion or absorbed too slow (Apajalahti et al., 2004). Since bacterial species differ from each other in relation to their substrate preferences and growth requirements, the
chemical composition and structure of the digesta largely determines the species distribution of the microbial community in the GIT. Therefore, microflora size, composition and activity can be altered by changes in diet (Hume et al., 2003). The structure and function of the digestive tract determines the sites of the intestine in which physiochemical and nutritional requirements for bacterial growth are fulfilled. Despite variations there are no sites in the GIT in which bacterial growth is entirely missing with over-all activity varying in different GIT sections (Apajalahti, 2005). Not surprisingly, different species of bacteria are harboured by different GIT sections on the basis of their preferred predilection sites as various intestinal segments function differently. There are several factors that restrict bacterial growth in the proximal GIT, including chemical inhibition (e.g. acid and bile), highly competitive rate of nutrient absorption (large absorptive surface and active transport), passage rate of digesta, continuous sloughing of both epithelial cells and mucus, and immunological defence mechanisms.
The microbiota residing in the GIT consist of approximately 400 known species, of which 20 - 40 % can be cultured. There are different methods for determining and quantifying the bacteria in digesta or on the epithelial lining. Basic knowledge of intestinal bacterial populations is based on culture-based techniques. Since Muzyer et al. (1993) first used denaturing gradient gel electrophoresis (DGGE) to study complex microbial populations, it has become an attractive alternative to culture-based techniques. Many studies have used DGGE as a tool to investigate intestinal microbiota (Hume et al., 2003; Lu et al., 2003; Pedroso et al., 2006). The availability of molecular techniques for identifying non-culturable species has opened new avenues of research into the factors that affect this complex mix of organisms and offers new opportunities for analysing the structure and species composition of intestinal microbial communities (Lu et al., 2003; Apajalahti et al., 2004; Dibner et al., 2007).
2.4.1
The crop
Lactobacilli, enterococci and coliforms are dominant species in the crop, and
Lactobacillus salivarius is the dominant species during the first week of life.
Lactobacilli are attached to epithelium and form an almost continuous layer (Fuller, 1978; Dibner et al., 2008). Lactobacillus spp is the major species of bacteria that
Chapter 2 32
produces lactic acid, reducing the crop lumen pH to about 5.0 once feeding begins (Fuller, 1977).
2.4.2
The proventriculus and ventriculus (Gizzard)
Both the proventriculus and gizzard appear to be unfavourable for the growth of various bacteria resulting in a bacterial population that is lower than that found in other parts of the GIT (Smith, 1965a; Smith, 1965b). This is likely due to a low pH (range 1 to 4), requiring any surviving microorganisms to show a high degree of acid tolerance (Gabriel et al., 2006). Despite this unfavourable environment, earlier studies have observed bacterial populations in the ventriculus: Lactobacillus at (up to 108 cfu/g of ventricular contents) and low numbers of E. coli, Streptococcus/Enterococcus and yeasts have also been found in the gizzard (Smith, 1965a; Smith, 1965b).
2.4.3
Small intestine
Large and diverse populations of bacteria inhabit the lumen of the proximal part of the small intestine. In the duodenum microflora are relatively sparse compared to the lower small intestine (Smith, 1965a). The environment of the ileum is more favourable to bacterial growth because of the lower oxygen pressure, and lower enzyme and bile salt concentrations (Gabriel et al., 2006).
The majority of organisms isolated from the duodenum and ileum are gram positive (Salanitro et al., 1978). The predominant organisms in the small intestine are E.
coli and Streptococcus spp, Enterococcus spp, Staphylococcus spp and Lactobacillus
spp at about 109cfu/g of ingesta. Lu et al. (2003) and Gong et al. (2002b) used the molecular analysis technique on 16S rRNA amplification to corroborated the previous culture-based results with lactobacilli predominating in the small intestine as well as smaller numbers ofstreptococci and enterobacteria.
Anaerobes comprised 39% of the total number of isolates obtained with the greatest range of types occurring in the duodenum (Salanitro et al., 1978). Obligate anaerobes including anaerobic cocci and species of Eubacterium, Propionibacterium,
the ileum Apajalahti et al. (1998) found bacterial numbers were typically between 107
and 109per gram of digesta.
2.4.4
The ceca
In simple stomach animals, bacterial fermentation is concentrated in the upper large intestine. The bacteria in these sections of the GIT utilize dietary compounds that have escaped pre-caecal host digestion and absorption, so these bacteria do not compete with the host when they ferment the entering substrate. In poultry, the most intense bacterial fermentation occurs in the caeca (Apajalahti, 2005). The caeca are evacuated only 1-2 times per day, thus providing relatively stable conditions for microbial proliferation (Gabriel et al., 2006). As a result of these favourable conditions, the resultant microbial community tends to be both large and diverse (Gong et al., 2002a; Lu et al., 2003).
The bacterial population in the caeca is significantly more diverse than that in the ileum, although the bacterial population in both regions is predominantly Gram-positive. This difference between caeca and ileum bacterial distribution is likely to due to the variation of their functional and environmental properties. The main function of the ileum is purely nutrient absorption, while that of the caecum is extensive bacterial fermentation, resulting in further nutrient absorption as well as detoxification of substances harmful to the host (Gong et al., 2002a; Gong et al., 2002b).
At least 38 different types of anaerobic bacteria of different strains have been isolated from chicken caeca (Barnes et al., 1972; Mead, 1989). Using culture based techniques Barnes et al. (1972) found strict/obligatory anaerobes such as
Bacteroidaceae, Gemmiger formicilis, Fusobacterium and Bifidobacterium gallinarum,
all of which are highly sensitive to oxygen, at levels of ~1011 cfu/g of caecal content and are predominantly culturable bacteria. Mead (1989) found that 28% of the total caecal culturable bacteria consisted of gram-positive cocci such as Peptostreptococcus spp. Other bacteria included Bacteroidaceae (20%), Eubacterium spp. (16%),
Bifidobacteriumspp. (9%), cocci (6%), Gemmiger formicilis (5%), andClostridium spp.
(5%). Facultative anaerobes such as Streptococci and Peptostreptococci spp occur in lower numbers with yeasts, moulds and protozoa generally at low levels or absent (Barnes et al., 1972; Salanitro et al., 1974).
Chapter 2 34
Using new molecular methodologies, based on 16S rRNA bacterial genes analysis, Gong et al. (2002a; 2002b) observed that butyrate-producing bacteria (including those related to Fusobacterium prausnitzii), ruminococci, Clostridia spp and
E. cecorum were the predominant groups of bacteria on the caecal mucosa. 25% of the
sequences cloned from the caecal samples studied were found to be un-reported species, closely related to unidentified butyrate-producing bacteria from the human caecum and bovine rumen (Gong et al., 2002b). Using the same technique, Lu et al. (2003) reported that 65% of sequences were related to Clostridia spp, Fusobacterium spp (14%),
Lactobacillus spp (8%) and Bacteriodes spp (5%). Apajalahti et al. (2001) analysed
diet-related differences in the caecal intestinal microbial communities using G+C% profiling of 16S ribosomal DNA (rDNA) sequences and found most of the genes detected were not from well-known bacterial species. This finding was later confirmed by Gong et al. (2002a) who found that many of the 16S rDNA sequences retrievedfrom a caecal library exhibited low sequence similarity to the genes of known bacterial genera.
Caecal flora changes from simple to a more complex and increasingly diverse population with the age of the chicken. Hume et al. (2003) examined changes in digestive microbial communities by using DGGE and found that caecal amplicon profiles changed from 8 major bands in chicks of 2 days of age to more complex mixtures of 26 major bands in chicks of 32 days of age. The composition of caecal microflora can vary between flocks, between birds within a single flock, and even within an individual bird examined at different times (Salanitro et al., 1974). During the development of chickens and turkeys, microbial populations take longer to develop in the caeca than they do in other parts of the GIT, and may take up to six weeks after hatching to fully develop (Barnes et al., 1972).
It must be noted that variation in the composition of intestinal microbial communities in different published reports may be partly due to the large diversity of gut flora as well as the method being used for enumeration.
NECROTIC ENTERITIS
2.5
One of the most clinically dramatic disease amongst enteric bacterial diseases is necrotic enteritis (NE), first described in broiler chickens by Parish more than fifty