Theses, Dissertations, and Other Capstone Projects
2013
Prevent-Teach-Reinforce for Function-based
Behavior Intervention Planning in Positive
Behavior Support
Brett William DeJager
Minnesota State University - Mankato
Follow this and additional works at:http://cornerstone.lib.mnsu.edu/etds Part of theEducational Psychology Commons, and thePsychology Commons
This Dissertation is brought to you for free and open access by Cornerstone: A Collection of Scholarly and Creative Works for Minnesota State University, Mankato. It has been accepted for inclusion in Theses, Dissertations, and Other Capstone Projects by an authorized administrator of Cornerstone: A Collection of Scholarly and Creative Works for Minnesota State University, Mankato.
Recommended Citation
DeJager, Brett William, "Prevent-Teach-Reinforce for Function-based Behavior Intervention Planning in Positive Behavior Support" (2013).Theses, Dissertations, and Other Capstone Projects.Paper 230.
Prevent-Teach-Reinforce for Function-based Behavior Intervention Planning in Positive Behavior Support
Brett De Jager
A Dissertation Submitted in Partial Fulfillment of the Requirements for the Degree of
Doctor of Psychology School Psychology
Minnesota State University, Mankato Mankato, Minnesota
Prevent-Teach-Reinforce for Function-based Behavior Intervention Planning in Positive Behavior Support
Brett W. De Jager
This dissertation has been examined and approved by the following members of the dissertation committee.
Kevin J. Filter, Ph.D., Advisor Daniel Houlihan, Ph.D., Committee Member Kathy Bertsch, Ph.D., Committee Member Teresa Wallace, Ph.D., Committee Member
Copyright
Copyright © Brett W. De Jager 2013 All Rights Reserved
Dedication
This dissertation is dedicated to my incredibly brave and patient fiancé, Britta, who has shown me that I can accomplish anything in this world and that it’s okay to ask for help when things get difficult.
To my family who have provided me with not only financial stability as I embarked on this long journey but also moral support. They never gave up on me and for that I am forever thankful.
To my advisor, Dr. Kevin Filter, and the rest of the Psychology Department at Minnesota State University, Mankato for providing me with an amazing education and an excellent opportunity to succeed in life.
Table of Contents
List of Figures ... viii
Abstract of the Dissertation ... ix
Chapter 1 Introduction and Literature Review ... 1
Functional Behavior Assessments in Schools ... 2
FBA Procedures ... 4
Challenges Implementing FBAs ... 6
Positive Behavior Interventions and Support ... 7
Prevent-Teach-Reinforce (P-T-R) ... 9
P-T-R procedure 1: Team building ... 12
P-T-R procedure 2: Goal setting ... 12
P-T-R procedure 3: Assessment ... 14
P-T-R procedure 4: Intervention selection ... 14
P-T-R procedure 5: Evaluation ... 15
Empirical Support for P-T-R... 16
Purpose of the Current Study ... 18
Chapter 2 Methods... 19
Participants and Setting ... 19
Measurement ... 21
Problem behaviors. ... 22
Academic engaged time. ... 23
P-T-R self-evaluation: Social validity. ... 24
Treatment fidelity ... 24
Interobserver agreement. ... 26
Procedures. ... 26
Team building ... 27
Goal setting and data collection ... 27
P-T-R assessment ... 29
P-T-R intervention ... 30
Evaluation ... 35
Design and Analysis ... 35
Chapter 3 Results... 36
P-T-R Functional Behavior Assessment ... 36
P-T-R interventions... 36 Charlie ... 37 Gary ... 38 Hank ... 40 BRS Data ... 42 Social Validity ... 43 Chapter 4 Discussion ... 45
Implications for Future Research ... 49
Limitations ... 50
Conclusion ... 51
Appendix A ... Consent and Assent Forms ... 53 Appendix B...
Observation Forms ... 65 Appendix C ...
P-T-R Data Collection Forms ... 68 Appendix D ...
List of Figures
Figure 1: Percent of intervals during which Charlie was engaged in disruptive behaviors and was academically engaged during baseline and intervention conditions………37 Figure 2: Percent of intervals during which Gary was engaged in disruptive behaviors and was academically engaged during baseline and intervention conditions………...39 Figure 3: Percent of intervals during which Hank was engaged in disruptive behaviors and was academically engaged during baseline and intervention conditions………41
Abstract of the Dissertation
Prevent-Teach-Reinforce for Function-based Behavior Intervention Planning in Positive Behavior Support
by Brett W. De Jager
Doctor of Psychology in School Psychology Graduate School of Psychology Minnesota State University, Mankato, 2013
Daniel Houlihan, Ph.D., Chair
The present study assessed the effectiveness of Prevent-Teach-Reinforce (P-T-R), an assessment-based model for students with behavior problems, using an A-B-A-B design with follow-up. Participants included three students in grades kindergarten, fourth, and fifth in a rural Midwestern school district. Results indicated that PTR was effective in reducing disruptive behaviors and increasing academic engaged time across all three participants. The results also indicated that the teacher participants were able to implement the behavior interventions with fidelity and with high levels of perceived social validity.
CHAPTER I
INTRODUCTION AND LITERATURE REVIEW
With an increasing demographic shift in school-age students, educators have been forced to face increasingly heterogeneous student populations. This heterogeneity has required educators to implement educational supports and interventions that may or may not be conducive to learning. Furthermore, schools and educators must not only meet the needs of general mainstream students but also meet the needs of those with disabilities that may be struggling because of behavior, social, and/or cognitive impairments. Dunlap and Fox (2009) listed three reasons why there is an increased attention towards
challenging behavior in schools. First, research is beginning to reveal an alarming prevalence of inappropriate and persistent behaviors. Lavigne and colleagues (1996) reported that 21% of preschool children had been determined to have a diagnosable psychiatric disorder. Additionally, Campbell (1995) found that 10-15% of young children exhibited significant behavior problems. Second, Dunlap and Fox noted the general public is starting to realize challenging behaviors do not simply fade away but can persist into adulthood. Finally, the general public and government have been demanding that schools increase their focus on social-emotional development of children as a
preventative measure. In an effort to meet the needs of such a heterogeneous population, schools must provide and maintain an environment that not only facilitates learning within an academic domain but also fosters positive life experiences and skills.
This heightened awareness to meet the needs of such a diverse student population led to cornerstone legislation with the 1997 reauthorization of P.L. 94-142 into P.L. 105-17, also known as the Individuals with Disabilities Education Act (IDEA 1997). One important element of this legislation is that it mandated functional behavior assessments (FBAs) for individualized behavior plans. Educators are now required to implement some form of an FBA and develop behavior plans based on that data for students experiencing behavior problems within a school setting (Weber, Killu, Derby, & Barretto, 2005). The requirements for completing FBAs during disciplinary procedures was maintained in the 2004 re-authorization of the bill, now known as the Individuals with Disabilities Education Improvement Act (Von Ravensburg & Tobin, 2006).
Functional Behavior Assessments in Schools
FBAs are based on the principles of applied behavior analysis and more than a half century of experimental research demonstrating the relationship between
environment and behavior (McIntosh, Brown, & Borgmeier, 2008). FBAs inform interventions that are aimed towards eliminating any reinforcers that a student may be receiving from the environment by exhibiting the target behaviors and, instead, changing or eliminating the target behavior by teaching and reinforcing appropriate alternative behaviors. Sugai and colleagues (2000) define FBA as a systematic process of identifying problem behaviors and the antecedent and consequence events that reliably predict
occurrence and nonoccurrence of problem behaviors across time. Additionally, Sugai, Lewis-Palmer, and Hagan (1998) stated that FBAs are designed to help educators understand the function of behaviors, focusing on the necessity of obtaining a visual
picture of what the target behavior looks like (operational definitions) in a variety of settings. Subsequently, educators should use FBAs to determine possible setting events, triggers (antecedents), and factors that maintain the behavior (consequences). With the focus trending towards accountability and evidence based interventions, schools have no choice but to employ a powerful playbook of function-based interventions that are derived from the data found in FBAs. Educators develop behavior intervention plans (BIPs) by siphoning the FBA data and then modifying the contextual variables that serve to maintain and support challenging behaviors (Dunlap, 1993; Gresham, 1991).
The idea of conducting systematic and data-driven assessments and interventions can be seen as daunting, time-consuming, and complex, however, it is likely that school personnel might already be partaking in certain aspects of FBAs, such as direct
observations and conducting interviews. School personnel can use FBAs to help their understanding of a student’s behavior in a multitude of settings and domains, to develop setting event strategies, antecedent strategies, behavior-teaching strategies, and
consequence strategies. By identifying target behaviors, settings events, antecedents, and consequences, educators can modify the classroom/school environment in a multitude of ways that will reduce problem behavior occurrences and foster positive behaviors
(Horner, 1994; Sugai et al., 2000). Sugai and colleagues state, “FBA is a best and
preferred practice for all challenging behavior, not just for behavioral events that result in suspensions or other disciplinary actions” (p.137). Recent research has provided
additional and ample evidence for the support of FBA as an effective approach to
2006; Filter & Horner, 2010; Hoff, Ervin, & Friman, 2005; Kern, Gallagher, Starosta, Hickman, & George, 2006; March & Horner, 2002; McIntosh et al., 2008; Stage et al., 2006).
FBA Procedures
While FBA is a highly supported research based practice and mandated by IDEA during disciplinary procedures, IDEA and the United States Department of Education (USDOE) have not identified specific assessment practices regarding FBA. The legal mandates regarding FBA forces schools to rely on external perspectives for FBA procedures. The federal government and the USDOE (1999) released subjective and rather incomplete sets of FBA procedures, which have caused inconsistencies with assessment interpretation. Although OSEP and USDOE do not provide a standard practice, it is likely that practitioners will agree that while conducting an FBA, it is important to (a) collect information regarding conditions under which problem behavior is and is not observed and more appropriate behavior is required (b) develop testable and malleable hypothesis and (c) collect direct observation information.
There have been multiple FBA procedures/models commonly cited in the
literature. O’Neil and colleagues (1997) state five procedural steps to functional behavior assessment: (1) problem identification, (2) identification of the circumstances and setting events that are consistently associated with the behavior, (3) identification of the factors that maintain the target behavior, (4) development of summary statements and/or hypotheses in relation to the function of the behavior, and (5) data collection through direct measures to support hypotheses. Sugai and colleagues (2000) described a six step
model of functional behavior assessment: (1) collect contextual information about target behavior/s, (2) develop testable and malleable hypotheses, (3) collect direct observation data, (4) design behavior support plans, (5) develop an implementation script, and (6) evaluate BIPs through data collection. Although it appears that there are small
differences within these two FBA procedures, the underlying concepts such as problem identification, development of a hypothesis, data collection, and evaluation are similar and necessary components. It is important to note that the purpose of FBA is to develop a behavior intervention plan that is most likely to be effective and therefore, FBAs and BIPs go hand in hand and serve as a basis for effective interventions.
The FBA process utilizes a wide variety of sources that are crucial to the reliability and validity of the process. Data sources include (a) indirect data collection sources such as student records, interviews, rating scales, checklists, and/or permanent product; and (b) direct data collection sources such as non-systematic direct observation and systematic direct observation on teacher/peer behavior across multiple settings and groups. Indirect data collection techniques obtain information through subjective reports from individuals whereas direct data collection techniques provide information from data that is collected during observations (Johnston & O’Neill, 2001). Van Acker, Boreson, Gable, and Potterton (2005) conducted a study that examined FBAs and BIPs that were developed by school teams across Wisconsin and found that indirect data collection techniques (i.e., semi-structured interviews, rating scales, checklists) were found to be utilized in 90% of the FBAs with interviews and student history (record) as the most common. Additionally, they found that direct observation was the most common method
of direct data collection found in 49% of the FBAs. An additional major component of functional behavior assessment is a functional analysis, which is a brief-experiment to test out each of the possible functions of the target behavior (Iwata, Dorsey, Slifer, Bauman, & Richman, 1982/1994). Although this is an effective and reliable method, it is rarely used in the schools because of its difficulty to implement in the classroom and lack of ecological validity (Solnick & Ardoin, 2010).
Challenges Implementing FBAs
With OSEP and USDOE not providing a clear standard of practice in regards to FBA, it forced schools to rely purely on interpretation of regulations as required in IDEA, which indicate when an FBA must be completed, but not what it must entail.
Subsequently,most schools were caught off guard and unequipped to handle the complexity of FBAs (Conroy, Katsiyannis, Clark, Gable, & Fox, 2002; Van Acker, Boreson, Gable, & Potterton, 2005). Consequently, each state educational agency
developed their own FBA procedures to meet federal requirements (Weber, Killu, Derby, & Barretto, 2005). With unique FBA procedures and guidelines for each state, it becomes pertinent for schools to be consistent with their assessments and measures in order to develop standardized, valid, and reliable interventions (Department of Education, 1999).
Many of the studies conducted on the validity and efficacy of function-based interventions and FBAs have been plagued by a magnitude of extraneous variables such as lack of treatment fidelity, lack of training, and lack of teacher buy-in. It appears that the limitations do not lie within the actual FBA, but rather those who conduct them. Van Acker and colleagues (2005) examined the quality of FBAs/BIPs submitted by various
schools in Wisconsin and found that the majority of school-based teams that submitted FBA/BIPS for critical review failed to clearly operationally define the target behavior. Additionally, there was a general failure to identify or verify the hypothesized function of the behavior before attempting the chosen intervention, and an alarming number of school-based teams did not take the function of the behavior into consideration during the development of the behavioral intervention. Benazzi, Horner, and Good (2006) found that having an individual with knowledge of behavioral theory on school-based teams has a significant impact on the perceived technical adequacy of behavior support plans. The results showed that behavior support teams would be more successful at using FBA results to design behavior support plans when there was at least one person trained in behavioral assessment. What does this mean for the future of FBAs within the schools? Ultimately, it means that although the empirical support for function-based approaches is well established, it is crucial for school-based teams to be knowledgeable in the field of applied behavior analysis, knowledgeable about the student in question, and
knowledgeable about available resources.
Positive Behavior Interventions and Support
The United States educational system is in the midst of comprehensive system-change initiatives and it is imperative that educators face the current challenges by emphasizing identification, adoption, and sustained use of empirically supported principles and practices. There is a growing shift towards school accountability and additional focus on schools to establish broad social, culture, and individual three-tiered behavior supports needed to promote both academic success and prosocial behavior for
students (Blonigen et al., 2008). This perspective change has identified school-wide positive behavioral interventions and support (PBIS) as an approach that will meet the needs of students in a three-tiered model. PBIS is the school-wide application of positive behavior support, which was developed as an alternative approach for working with individuals with severe disabilities in the mid-1980s (Durand & Carr, 1985; Meyer & Evans, 1989). PBIS has emerged as an approach that allows schools and educators to meet the challenges of the continually increasing heterogeneous student population including students with and without disabilities (Colvin, Kame’1enui, & Sugai, 1993; Todd, Horner, Sugai, & Spraque, 1999). Horner (2009) estimated that school-wide PBIS was being implemented by more than 9,000 schools across the United States in at least 44 states. This is a considerable increase from the report by the U.S. Department of
Education in 2005 that estimated 5,000 schools across 40 states had adopted the PBIS approach.
The PBIS process uses data-driven problem solving and individualized planning processes to establish appropriate interventions for all students across three levels: (1) Primary (Universal), (2) Secondary (Targeted), and (3) Tertiary (Intensive). PBIS has been built and shaped around the empirically sound principles and features of behavioral theory and applied behavior analysis (Carr et al., 2002) as well as (a) behavioral sciences, (b) practical interventions, (c) social values, and (d) a systems perspective (Sugai et al., 2000). As a result, PBIS uses behavior principles to reach a wider-range of students, regardless of their current academic or behavior placements by combing comprehensive, logical, and collaborative frameworks. PBIS has been proven time after time to be an
effective and established school-wide approach for addressing the needs of children who have been identified as having challenging behaviors (Bradshaw, Mitchell, & Leaf, 2010; Marquis et al., 2000; Carr et al., 1999; Clarke, Worcester, Dunlap, Murray, & Bradley-Klug, 2002).
Until recently, the primary focus of interventions and PBIS has been on decreasing problem behaviors. However, there is a trending shift in PBIS. This shift focuses on enhancing student quality of life as a primary goal of PBIS and decreasing challenging behaviors as a secondary priority. While a focus on increasing student lifestyle may provide a set of core expectations for positive social skills, it has become clear that there needs to be additional reform within the PBIS model that will continue to effectively deal with more persistent challenging behaviors, not just lifestyle
improvements. The emergence of the Prevent-Teach-Reinforce (P-T-R) model appears to be a promising development in terms of increasing the quality of FBA and tertiary PBIS interventions that supports the difficult issues inherent in the expansion of PBIS into dealing with quality of life issues.
Prevent-Teach-Reinforce (P-T-R)
Most of the “evidence-based” interventions that schools are implementing to meet the needs of individuals exhibiting behavioral problems are non-function-based, reactive techniques that rely on punishment, reprimands, and other various implicit verbal
redirects (Blood & Neel, 2007). Although the law requires schools to utilize FBAs in the development of BIPs for students with disabilities facing disciplinary action, schools find themselves struggling to effectively integrate this component into their assessment
repertoire due to a lack of a clear, definite standard of practice. The result is a large portion of interventions having poor outcomes. Tilly, Reschly, and Grimes (1998) note that assessments that explain behavior but do not indicate effective interventions are generally useless and potentially harmful to educators and students looking for improved outcomes, and although many state educational agencies have developed their own FBA procedures to meet federal guidelines, there is room for improvement (Weber, Killu, Derby, & Barretto, 2005). The benefits and need for standardized, function-based, and explicit behavior assessments that lead to empirically supported interventions are evident. One such strategy is P-T-R, a standardized, function-based model of PBIS for students with persistent and challenging behavioral problems such as screaming, hitting, talking out, chronic daydreaming, lack of responsiveness, and withdrawal. P-T-R is a data-driven, manual-guided process designed for school-based teams who are working on developing and implementing behavior support plans for individual students. Dunlap and colleagues (2010) describe the P-T-R strategy as:
A standardized approach to the development and implementation of
individualized, school-based positive behavior support. . . . The P-T-R model was created in response to the critical need for a standardized and manualized
approach that is effective and feasible in addressing serious behavior problems in typical school circumstances. (Foreward p. x)
The P-T-R strategy relies heavily on FBAs and behavior support plans by combining the principles and procedures of applied behavior analysis and PBIS (Bambara & Kern, 2005; Carr et al., 2002). P-T-R fits into the tertiary level of PBIS,
wherein students with intensive behavioral needs are supported using function-based, individualized interventions. Additionally, the P-T-R approach focuses on manipulating and changing both the learning environment and the way educators teach their students in order to maximize positive outcomes through three pivotal components: (a) Prevent, (b) Teach, and (c) Reinforce. Each component consists of its own assessment protocol that is included in the student’s behavior support plan (Dunlap, Iovannone, Wilson, Kincaid, & Strain, 2010).
The “Prevent” component of P-T-R focuses on antecedent manipulations. During the Prevent component of the FBA, data collected will help identify the environmental circumstances associated with the occurrence of the target behavior and guide in
redesigning both the teaching and learning environments to decrease the development of problem behaviors. Additionally, the Prevent component emphasizes the importance of educators being proactive in their assessments and interventions.
The “Teach” component focuses on instructional strategies for teaching students as well as directly and clearly providing ample opportunities for students to learn
appropriate behaviors that can replaced problem behaviors. The Teach component of the FBA will provide information that will help educators identify the function of the
problem behavior and guide the school-based team in selecting appropriate alternative behaviors to teach.
The “Reinforce” component of P-T-R focuses on the identification of
reinforcement contingencies. This component hinges on effectively shaping behavior that is appropriate and generalizable. The Reinforce component of the FBA provides data that
will help identify why the student may continue to engage in the target behavior and help the school-based team eliminate the reinforcing properties of such behavior and deliver reinforcement contingent on appropriate/positive behaviors (Dunlap et al., 2010a).
Implementing the P-T-R model is an extensive process and requires effective collaboration within the school-based team. All team members involved need to know the steps and become committed to following through with the recommended steps and frequent team meetings. The P-T-R model manual released in 2010 provides explicit directions for the P-T-R process along with user-friendly forms and self-assessments. The P-T-R process as set forth by Dunlap and colleagues (2010) is explained below.
P-T-R procedure 1: Team building. At minimum, school-based P-T-R teams should include the student’s primary education teacher and a R consultant. The P-T-R consultant can be anybody trained in the P-T-P-T-R process or a university-based research consultant. Team building establishes the core-members of the team and sets forth the responsibilities of each team member. Additionally, it is desirable for the team to consist of as many professionals as possible such as school administrators, school psychologists, para-educators, and or counselors and social workers. Parents and family members are also encouraged to become a part of the P-T-R team. During the team building process, a schedule of four to five team meetings are arranged to allow team members to prepare and become trained in the P-T-R process (Dunlap et al., 2010a).
P-T-R procedure 2: Goal setting. The primary focus and purpose of the goal setting step is to identify the student’s target behaviors of which the team members consider to be the most important to address. Additionally, team members will agree on
the team’s “vision” and develop both long term and short term goals for the team as well as for the student. If the student is already receiving special education services and has an individualized education plan then the P-T-R goals may be similar to that of the student’s individualized education plan. Ideally, the student should have three broad goals. The idea behind this P-T-R step is to focus on behavior outcomes, and social relationships as well as academic achievement. Furthermore, team-members must have well-established operational definitions of not only the target behaviors but for each of the goals. By doing so, communication and implementation of the intervention will prove to be a lot easier and more effective. The team will be able to more effectively monitor the student’s progress towards those goals and determine whether or not the challenging behavior is actually decreasing and if the appropriate behavior is being exhibited adequately. The goal-setting step of the P-T-R also includes establishing data collection techniques. Dunlap and colleagues provide the Behavior Rating Scale (BRS; Kohler & Strain, 1992), which is a 5-point Likert-type scale, to aide in the daily data collection of the student’s target behavior. It is crucial for the P-T-R team to have established operational definitions of the target behaviors in order to maximize the efficacy of the BRS. Finally, the P-T-R team needs to determine how they will measure the target behaviors on the BRS such as frequency, duration, latency, or intensity. To end the goal-setting and data collection step, the team must establish appropriate anchor points for the BRS in order to determine if the student’s behavior improves or deteriorates throughout the week/intervention (Dunlap et al., 2010a).
P-T-R procedure 3: P-T-R assessment. The P-T-R Assessment is akin to a FBA and serves to identify specific information regarding the student’s target behaviors and ultimately determine the function of the behavior. It is during this step that the
antecedents, setting events, and consequences of the student’s challenging behavior are identified. Subsequently, the function of the behavior will be the foundation of the upcoming intervention selection. The P-T-R Assessment is in a checklist format consisting of three categories relating to the Prevent component (antecedents and triggers), the Teach component (determining function of the behavior and appropriate alternative behaviors), and the Reinforce component (consequences). Each component of the P-T-R strategy has its own protocol and tools designed specifically to collect data on that particular area. Once the P-T-R assessment has been completed for each of the student’s target behaviors, the P-T-R team organizes the information onto the P-T-R Summary form provided in the manual, which will allow the team to develop a
hypothesis statement. Additionally, the team develops a hypothesis for the appropriate alternative behavior that matches the hypothesized function of the target behavior. It is at this time that the team-members can start using the P-T-R Assessment data to rank possible interventions (Dunlap et al., 2010a).
P-T-R procedure 4: Intervention selection. After the P-T-R Assessment team completes the FBA for each P-T-R component along with developing a hypothesis statement, the team focuses on developing the student’s BIP. A student’s behavior intervention plan consists of three components based on the FBA developed from the P-T-R Assessment: (a) a Prevent intervention, (b) a Teach intervention, and (c) a Reinforce
intervention. When selecting a Prevent intervention, it is pertinent that the team reviews the Prevent data from the FBA and identifies the environmental circumstances associated with the occurrence of the student’s target behavior. By evaluating the Prevent data, the team can effectively select a prevent intervention from a wide variety of choices as provided in the T-R manual that best fits the function of the student’s behavior. The P-T-R should follow the same procedures (evaluating the FBA) and select a Teach
intervention as well as one Reinforce intervention. One way for the team to come up with one intervention for each component is to have each team member rank order at least three possible interventions for each component and select the intervention that is ranked the highest on average. This allows all team members to share in the process. Once the P-T-R interventions have been selected, implementation should begin. Any coaching or training should be done during this step for team members that will be implementing the interventions. It is crucial that each team member knows and understands each of the steps to ensure adequate fidelity and treatment reliability (Dunlap et al., 2010a).
P-T-R procedure 5: Evaluation. Evaluation of the P-T-R interventions selected should be frequent and as objective as possible. Daily measures of the target behavior should be taken through the BRS as described in step 2 of the P-T-R process.
Additionally, team members should be meeting as regularly as possible throughout the school year to ensure that everybody is maintaining their responsibilities and keeping up to date with any intervention changes. If the interventions are providing successful and positive outcomes, then the team must consider the possibility to expanding and generalize these outcomes into other settings. Additionally, teachers should complete a
social validity rating scale that will measure the extent of the intervention acceptability within the classroom. The BRS outcome data combined with the P-T-R Fidelity of Implementation and Teach Social Validity Scale scores provide the team with adequate information to assist them in making appropriate data-based decisions regarding the future of the student’s behavior intervention plan (Dunlap et al., 2010a).
Empirical Support for P-T-R
PBIS and applied behavior analysis can be seen as effective approaches for decreasing problem behaviors and increasing socially appropriate tendencies. P-T-R has integrated and developed the widely supported components of these approaches into a manualized function-based process. To date, four studies have evaluated the efficacy and treatment validity of the P-T-R strategy. Iovannone et al. (2009) conducted a
randomized, controlled trial investigating the efficacy of Prevent-Teach-Reinforce. Iovannone and colleagues wanted to determine if students receiving the P-T-R interventions would see significantly greater improvements in social skills, academic engagement, and problem behaviors compared to those who did not receive the P-T-R interventions. The study consisted of 245 students in grades K-8 that were selected from five public school districts from Colorado and Florida that were randomly assigned to either a control group or an experimental group. In the control group students received the usual interventions and processes the schools normally provided to students with behavioral problems and students in the experimental group received P-T-R. Results showed that students who received P-T-R interventions had significantly lower problem behaviors, and significantly higher social skills and academic engaged time in
comparison to students in the control group. Students receiving P-T-R interventions saw significantly higher decreases in problem behaviors on average (as reported by the Problem Behaviors subscale on the SSRS) compared to the comparison group who saw average decreases corresponding to an effect size of 0.44. Students receiving P-T-R interventions had significantly higher increases in academic engaged time compared to their counterparts corresponding to a main effect of 0.51. Students in the P-T-R group increased in standard scores from baseline to post-treatment in regards to social skills versus the comparison group corresponding to an effect size of 0.52. Additionally, data collected on the social validity of the P-T-R process indicated that teachers accepted the strategy and thought very highly of it (Iovannone et al., 2009).
Dunlap and colleagues (2010b) illustrated two case studies selected from within the large-scale evaluation and found that the students who received interventions from within the P-T-R strategy had significantly lower occurrences of problem behavior and increased occurrences of prosocial behaviors. Strain, Wilson, and Dunlap (2011) evaluated the efficacy of P-T-R interventions on three elementary school students with autism spectrum disorders (ASD) and serious problem behaviors using a multiple baseline across participants design. Results of the study showed reductions in problem behaviors and increases in academic engagement across all participants. A recent study in 2012 (Sears, Blair, Iovannone, & Crosland) reported similar findings when they
examined the feasibility and effectiveness of a modified family-centered P-T-R strategy. Using a multiple baseline design across conditions, the researchers examined changes in target behavior for two young males with ASD. Findings from the study showed a
reduction in child problem behavior and increases in appropriate alternative behavior in both target and non-target routines. In addition, the researchers found that parent
participants were able to implement the behavior intervention plan with high levels of fidelity, and both families rated the P-T-R intervention as having high levels of social validity
Purpose of the Current Study
Although there is a solid research examining the effectiveness of function-based interventions, there is very limited research that evaluates the standardized and
manualized approach of P-T-R. Furthermore, the current research examining the overall effectiveness of P-T-R is in its infancy with only three studies having evaluated the strategy. Therefore, the purpose of the current study was to assess the overall
effectiveness of interventions developed using the manualized P-T-R strategy on children who were exhibiting challenging behavior problems in general education classrooms using a single-subject experimental research design. In addition, the study assessed whether or not teachers perceived the P-T-R strategy and interventions as effective and practical within the confines of their classrooms. The following research questions were investigated:
1. Do students show improvement in the areas of problem behaviors and academic
engaged time as a result of the P-T-R interventions?
2. Do classroom teachers consider the implementation of P-T-R to be teacher-friendly and easy to use?
CHAPTER II METHODS
Participants & Setting
A total of three students were selected from two rural public schools located in north central Minnesota. Student participants were nominated by their teachers on the basis of problem behavior and not on their disability status, response to lower level interventions, or any additional demographic variable. Students engaging in self-injurious behaviors and who are considered to be a danger to others were excluded from the study.
Three teachers were recruited on a voluntary basis by the special education
director to participate in the study. Once the teachers were selected, the special education director provided the principal investigator with their contact information, at which time the student selection process began.
The teachers participating in the study nominated students who were engaging in persistent disruptive behaviors in the classroom environment through the use of the Systematic Screening for Behavior Disorders (SSBD; Walker & Severson, 1990). The SSBD is a multiple gating screening procedure designed to identify children who are at risk for serious behavior disorders as well as improve the quality of in-class referrals.
The first gate of SSBD required the participating teachers to rank order five students who were exhibiting problem behaviors in their classroom. The top three students ranked in Gate 1 moved onto the next gate. Gate 2 required the teachers to complete the Critical Events Inventory (CEI; Walker & Severson, 1990), which is a behavioral events checklist that reports adaptive and maladaptive behaviors that have
been exhibited during the past 6 months. The students obtained a score ranging from zero (i.e., no observable problematic behaviors) to 35 (i.e., 35 types of observable
problematic behaviors). The teachers were required to answer the following questions on a supplemental form:
1. What is the frequency of the problem behavior?
2. How long has the problem behavior been occurring?
3. How often does the student miss school per week?
Student participants were considered eligible for the study if they had (a) a minimum of five critical events on the CEI of the SSBD, (b) behavior that has persisted for at least two months, and (c) behavior that is exhibited at least once a week. The caregivers of the top ranked student from across all participating classrooms were contacted by the
student’s teacher to determine if they would be interested in allowing their child to participate in the study. Interested parents and caregivers were contacted by the principal investigator and briefed on the details of the study and were asked to provide informed consent.
After the nomination and consent process, three students were included and participated in all phases of the study. Charlie was a kindergarten boy who had been identified by his classroom teacher as being severely disruptive during large group classroom activities. Information collected through the SSBD indicated that Charlie frequently challenged teacher-imposed limits such as classroom rules, frequently created a disturbance during class activities, and was frequently overly-affectionate with both peers and adults. Charlie only sometimes complied with teacher requests and commands.
He had no identified disabilities and attended kindergarten in the general education setting two to three days a week. Gary was a fifth grade boy who had been identified by his classroom teacher as being disruptive during independent work time and math. Information collected through the SSBD indicated that Gary exhibited sad affect, depression, and feelings of worthlessness to such an extent as to interfere with normal peer and classroom activities as well as demonstrated obsessive-compulsive behaviors, particularly pulling out his eyelashes and hair. Additionally, Gary was reported as frequently arguing with teachers after re-direction and needing punishment before
terminating inappropriate behavior. He had no identified disabilities and attended school full time in the general education setting. Hank was a fourth grade boy who had been similarly identified by his classroom teacher as exhibiting persistent and challenging behaviors throughout the day in a variety of settings. Information collected through the SSBD indicated that Hank demonstrated obsessive-compulsive behaviors, frequently ignored teacher warnings or reprimands, frequently required punishment before he terminated inappropriate behavior, and frequently created a disturbance during classroom activities. He had no identified disabilities and attended school full time in the general education setting.
Measurement
Dependent measures for this study focused on both student and teacher outcomes. Student outcomes measured two main dependent variables: (a) problem behavior and (b) academic engaged time. Treatment fidelity and social validity were also measured.
Problem behaviors. Prior to data collection, each teacher identified the problem behaviors exhibited by their student that was most concerning through the use of the SSBD (Walker & Severson, 1991). Operational definitions were then refined during the P-T-R interview process.
All three participants were exhibiting similar problem behaviors that were considered disruptive by their teacher. Charlie’s most challenging problem behaviors were off-task, wrecking peers work, making distracting audible vocalizations, and being out-of-seat at inappropriate times. Gary engaged in problem behaviors such as being off-task, arguing, responding inappropriately, blurting out, and walking away from the teacher. Hank’s problem behaviors were similar to that of Charlie and Gary with off-task, disruptive audible vocalizations, and purposely distracting his peers by making faces being the most concerning for the teacher. Since target behaviors were similar across all three participants, it was determined that one operational definition of disruptive behavior would be appropriate. Disruptive Behavior was operationally defined as “Student is exhibiting any behaviors or audible vocalizations that are disruptive, interfering with learning, or impeding instructional delivery.” Specific examples included fidgeting, drawing on body parts of self or peers, talking out, disruptive interaction with peer(s) that interferes with learning, leaving the assigned instructional area, and making audible vocalizations not related to the instructional task such as singing, humming, or talking back.
Problem behaviors were measured using a 10-second partial-interval direct observation procedure. Direct observations occurred on a daily basis during baseline and
intervention phases in 20-minute sessions. Data from each observation session was summarized as percent of intervals with problem behavior.
Academic engaged time. The operational definition of academic engaged time (AET) was (a) student is looking at instructional materials, (b) student is raising hand, (c) student is working on tasks that the teacher specified, and/or (d) student is engaged in communication with his/her peers or teacher that is relevant to the task at hand.
AET was measured daily using a 10-second whole-interval, direct observation procedure during baseline and intervention phases in 20-minute sessions. AET was measured concurrently with the direct observation of problem behavior.
Behavior Rating Scale (BRS). In conjunction with daily direct observations by the researchers, the BRS was used by the teachers as a supplemental data collection measure.The BRS is a five-point daily rating scale designed specifically for the P-T-R model that measures the frequency, duration, severity, and/or latency of the target behavior based on the goals of the P-T-R team and that of the student(s) (Dunlap et al., 2010a). For this particular study, frequency was used across all three participants. The BRS consisted of behavior anchors (problem behaviors v. appropriate behaviors) that allowed each teacher to avoid having to use a stop-watch to directly count/tally behavior. Since the BRS uses anchor points, which are only estimates or approximations of how often the student engaged in each behavior, it was used as a supplemental data collection measure. Teachers were taught how to use the BRS before baseline and their daily use of the measure was monitored by the primary investigator throughout the study.
P-T-R self-evaluation: Social validity. The P-T-R Social Validity Form, a 15-item scale based on the Treatment Acceptability Rating Form (TARF-Revised; Reimers & Wacker, 1988), was used to measure social validity. This form identified the teachers’ perceptions regarding the effectiveness and acceptability of the intervention plan
developed by the team. The form contained 15 questions using a 5-point Likert-type scale (e.g., 1 = not at all acceptable and 5 = very acceptable) with an additional section for any comments the teacher may have had.
Examples of items on the P-T-R Social Validity Form are, (1) Given this student’s behavior problems, how acceptable do you find the P-T-R behavior plan? (e.g., 1 = not at
all acceptable and 5 = very acceptable) (2) How well will carrying out this behavior plan
fit into the existing routine? (1 = not well at all and 5 = very well) (3) How willing are you to carry out this behavior plan? (1 = not at all willing and 5 = very willing). The P-T-R Self-Evaluation: Social Validity Form (see Appendix 2.1) was completed by the teachers at the conclusion of the study.
Treatment fidelity. Treatment fidelity was assessed using the P-T-R Fidelity of Implementation Guide after the teacher had been trained to 90% integrity on each of the interventions or had received 12 hours of coaching support from the principal investigator (see appendix 5.6; Dunlap et al., 2010a). A limit to the amount of coaching a teacher could receive was put into place to control for interference that a large amount of
coaching may have had on student outcomes and to keep the amount of coaching similar across teacher participants. Fidelity checks were conducted by the principle investigator directly observing the teachers during implementation of the interventions. Fidelity
checks ensured that teachers were implementing the strategies as intended as well as to evaluate the behavior plan’s effectiveness and contextual fit. Teachers were scored on adherence to the intervention steps (completeness) and the quality of the implementation (competence).
Treatment fidelity was measured in 50% of sessions across all participants. Fidelity checks were conducted periodically throughout all phases of the study to ensure that the intervention(s) or components of the intervention(s) were not being implemented during baseline phases. Treatment fidelity was 0% across all three participants in all baseline phases and 100% across participants in all intervention phases when measured during observation sessions. Treatment fidelity was 100% for Charlie’s teacher during the follow-up session. Treatment fidelity was 20% for Hank’s teacher during follow-up session; however it should be noted that the teacher was no longer implementing the P-T-R interventions but still had a visual cue poster hanging on the classroom wall. A fidelity check for Gary’s teacher during a up session was not possible because no follow-up session was conducted.
General Observation Procedures for Problem Behavior and AET
Observers were a school psychologist assigned to the school and school
psychology graduate students selected on a voluntary basis. Observers were trained as described below in the section “Interobserver Agreement” and used a stopwatch and observation form to conduct observations. Observers positioned themselves as unobtrusively as possible in the back of the room such that they were a minimal
Observers made every effort to avoid identifying which student was being observed by scanning the room during observations.
Interobserver agreement. Interobserver agreement for problem behavior and AET was calculated using the total agreement formula. The formula used to calculate total agreement was: divide the number of agreements by the number of agreements plus disagreements and multiply by 100%. The definition of “agreement” used to calculate total agreement was defined as ‘agreement on occurrence or non-occurrence’ for both problem behavior and academic engaged time.
Prior to data collection, observers were trained to 90% total agreement on problem behavior and academic engaged time using verbal instruction (i.e., operational definitions, examples, and non-examples) in the classroom on the student participants. Interobserver agreement was collected during 40% of the sessions throughout baseline and intervention phases across all participants.
The mean total agreement during all data collection on Charlie was 98.4%, ranging from 96.7% to 100%. The mean total agreement during all data collection on Gary was 98.34%, ranging from 95.8% to 99.2%. The mean total agreement during all data collection on Hank was 98.7%, ranging from 97.5% to 100%.
Procedures
The procedures of the current study followed the five manualized steps of the P-T-R process (1) Team Building, (2) Goal Setting and Data Collection, (3) P-P-T-R
Assessment, (4) P-T-R Intervention, and (5) Evaluation with follow-up. The effectiveness of the interventions developed during P-T-R were evaluated using a multiple baseline
design across subjects. The following sections provide a detailed description of each step as described in the P-T-R manual (Dunlap et al., 2010a).
Team building. The P-T-R assistance team consisted of the students’ primary teacher, the P-T-R consultant, which for the purpose of the study, was the principle investigator, the school psychologist, and a school psychology graduate student. The teacher and P-T-R consultant met between once and twice a week to review all available and relevant data, brainstorm ideas, discuss and make data-based decisions, and gain consensus on what interventions to utilize and the steps of those interventions.
Goal setting and data collection. The P-T-R Goal-Setting Form (see appendix 1.1; Dunlap et al., 2010a) was used by the P-T-R assistance team in developing student goals. The first step of the P-T-R assistance team was to develop broad goals for the student in the areas of behavior, social, and academics, even though for the purpose of this study only changes in behavior was recorded. The broad goals included (a)
behavioral outcomes, (b) social interactions or relationships, and (c) necessary behavior changes to achieve positive changes in achievement. An example of a broad behavior goal was, “Charlie will sit in his seat without being disruptive during large group activities.”
Next, the P-T-R assistance team developed short-term goals for the student in the areas of behavior, social, and academics. The short-term goals addressed two specific areas, (1) the specific problem behaviors that the team would like to see decrease, and (2) the appropriate behaviors the team would like the student to exhibit in place of the
that were observable, measurable, and significant. For example, Hank’s short-term goal for a behavior the team would like to see decreased was “Hank will decrease audible vocalizations that disrupt the classroom such as blurting inappropriate comments and making noises.” (See Appendix D for long-term and short-term goals developed for each participant).
Once the P-T-R assistance team developed broad goals and short-term goals for each participant, the team completed the BRS (see Appendix 1.2; Dunlap et al., 2010a), which was the data collection tool by teachers. The first step in developing the BRS was determining appropriate operational definitions of each target behavior. The team utilized the short-term goals previously established in order to construct the BRS. Once the behaviors were clearly defined, the team determined the method of measurement, which for this study was frequency across all three participants. Once the most
appropriate method of measurement was determined the team developed anchor points for each BRS. Anchor points were goals along a continuum (Anchor 1 – Anchor 5) that the team wanted to achieve by the end of the intervention and were established for both challenging behaviors and for appropriate behaviors. For example, when setting the first anchor point for Hank’s problem behaviors, the team estimated the behavior’s occurrence on a normal day. It was estimated that Hank’s problem behaviors occurred an average of 8-9 times per day, which then became Anchor 4. Anchor 1 was where the team wanted the occurrence of the problem behaviors to be on an extremely good day (e.g., 0-2 times per day). Anchors 2, 3, and 4 were set for intermediate problem behavior occurrences (e.g., Anchor 2 = between 3 and 5 times per day). Anchor 5 was defined as the worst
case scenario of daily problem behavior occurrences (e.g., 10 or more times per day – extremely bad day).
Once the P-T-R assistance team determined goals, developed the BRS, and established anchor points for each student participant, the team selected a start date for collecting data. At this point, the researchers began collecting baseline data via direct classroom observations, and the teachers started using the BRS at the end of each
day/routine/observational period by circling the number that best corresponded with their perception of their student’s behavior during that measurement period.
P-T-R assessment.At this step in the P-T-R process, theP-T-R assistance team completed functional behavior assessments (FBAs) using the P-T-R FBA Checklist (see Appendix 1.3; Dunlap et al., 2010a) for each participant. The team completed each component (Prevent, Teach, Reinforce) of the FBA Checklist for each of the student’s target behaviors. The Prevent component of the FBA identified setting events and antecedents that may be triggering the target behaviors. The Prevent component helped the team determine environmental events and circumstances that were associated with more desired prosocial behaviors for each of the participants. Examples of items on the Prevent component are, “Are there times of the school day when problem behavior is most likely to occur?” and “Are there specific activities when problem behavior is very likely to occur?” The Teach component helped the team determine the function of the students’ target behaviors. Examples of items on the Teach component are, “Does the problem behavior seem to be exhibited in order to gain attention from peers?” and “Does the problem behavior seem to be exhibited in order to get away from a non-preferred
classmate or adult?” The Reinforce component of the FBA helped the team identify consequences that were occurring after the problem behavior that could thus be used to increase more appropriate alternative behaviors. Examples of items on the Reinforce component are, “What is the likelihood of the student’s problem behavior resulting in acknowledgement (e.g., reprimands, corrections) from teachers or other school staff?” and “Does the student enjoy praise from teachers and other school staff? Does the student enjoy praise from some teachers more than others?” Direct systematic classroom
observations are not explicitly built into the P-T-R process, as such; none were conducted during this portion.
Once the P-T-R assistance team completed the FBA Checklist, the data was summarized using the FBA Summary Table (see appendix 1.4; Dunlap et al., 2010a). The team listed each problem behavior as well as prosocial behavior on the summary table and listed setting events, antecedents, and consequences. At this point, the team looked for patterns that could explain when a specific behavior may occur and why. The team recorded possible hypotheses and then selected specific replacement behaviors for each participant.
P-T-R intervention. During this step of the study, the P-T-R assistance team reviewed all of the Prevent interventions, Teach interventions, and Reinforce
interventions listed and described in the P-T-R manual. Upon reviewing the
interventions, the team completed the P-T-R Intervention Checklist (see Appendix 1.5; Dunlap et al., 2010a) to select possible interventions/strategies that not only best fit the team’s hypotheses but also were feasible for the teacher to implement. Using the
intervention checklist, the team rank ordered two to four interventions from each component that were considered best suited for the student. After the team selected at least three strategies (one from each component) across participants, a step-by-step behavior plan using the P-T-R Behavior Intervention Plan Hypothesis form (see Appendix 1.7; Dunlap, et al.) and the P-T-R Behavior Intervention Plan form (see Appendix 1.8; Dunlap, et al.) was developed, which outlined how each intervention was to be implemented. After the team developed a detailed behavior plan, the P-T-R consultant provided training and technical assistance to the classroom teachers using the P-T-R Training Checklist (see Appendix 1.9; Dunlap, et al.). Technical assistance was provided until the teacher implementing the interventions demonstrated accurate implementation of the plan to 90% accuracy. At this point in the study, the teachers began implementing the interventions.
The development of the interventions for each participant was based on the results obtained throughout the P-T-R process. One intervention from each component (Prevent, Teach, Reinforce) was selected and then combined to form each of the participant’s P-T-R intervention plan. Since the interventions were individualized, descriptions of the interventions and implementation procedures will be provided separately for each participant.
Charlie’s Interventions. Charlie’s P-T-R Behavior Intervention Plan consisted of
one intervention from each of the P-T-R components (Prevent, Teach, Reinforce). The intervention plan developed by the team was to provide Charlie with environmental supports, which was boundary identification during whole-class floor activities and visual
cues (Prevent), teaching Charlie an appropriate alternative behavior that was physically incompatible with his problem behaviors (Teach), and reinforce the replacement behavior while simultaneously extinguishing problem behavior (Reinforce). Extinction of target behaviors was attempted by no longer allowing Charlie to escape or avoid tasks
contingent on him exhibiting disruptive behaviors.
The team integrated the three selected P-T-R interventions into one intervention plan, which was called the “5-Star Listener” intervention. The first step of the
intervention provided Charlie with a taped off section on the floor, which indicated clear a clear boundary for him since he consistently moving and distracting his peers during floor-time activities. Second, the teacher provided Charlie with a hand-held 5-star listener cue card that he subsequently would have with him during large group activities. A larger version of the cue card was also posted on the classroom wall. While the environmental supports were provided, the teacher taught Charlie and the rest of the classroom the five steps of being a 5-star listener 1.) Eyes are watching 2.) Ears are listening 3.) Lips are closed 4.) Hands are still, and 5.) Feet are quiet. Prior to each large group activity, the teacher reminded the whole class to be 5-star listeners and briefly reviewed each part. The last part of the intervention plan (Reinforce component) was aimed at increasing the likelihood that Charlie would be a 5-star listener. The teacher met with him privately and immediately after each large group activity. At which time, the teacher provided Charlie with explicit feedback on whether or not he was a 5-star listener. When Charlie exhibited all five parts of being a 5-star listener, the teacher provided him with verbal praise and a
sticker for his progress sheet. At the end of the day if he met his daily goal he was immediately awarded a graham cracker or other treat of his choice.
Gary’s Interventions. The same intervention process was used as described above.
At least one intervention was selected from each of the P-T-R components (Prevent, Teach, Reinforce). Gary’s intervention plan consisted of providing him with
environmental support and increase non-contingent reinforcement (Prevent), teaching him an alternative appropriate behavior that is functionally equivalent to his problem behaviors (Teach), and reinforcing the replacement behavior in a functionally equivalent manner (Reinforce). Extinction of target behaviors was attempted by no longer allowing Gary to escape or avoid activities and tasks contingent on him exhibiting disruptive behaviors.
The team integrated the selected P-T-R interventions into one intervention plan, which was called the “Red-Green Card” intervention. The first step of the intervention consisted of the teacher providing Gary with a laminated card that was red on one side and green on the other side. The card was fastened to his class desk with VELCRO®. The teacher explained the reasoning behind the red-green card and the rules for using it. Gary was taught that the card would initially be showing green and when he became frustrated or started feeling like he may become frustrated, he could turn the card over to show red. At which point the teacher would come over to his desk and provide him with support, depending on his needs at that time. From that point on, the teacher would increase non-contingent reinforcement. If Gary continued to be frustrated and left the card red, he was taught to raise his hand and ask for a break. As a result of exhibiting the appropriate
alternative behavior (raising hand), the teacher reinforced the behavior by allowing him to escape the task for a short period of time and verbally praising him for exhibiting the replacement behavior. After the brief break, the teacher would prompt Gary to return to his desk and/or activity. The length of the break varied, depending on the current classroom activity, ranging from 1-3 minutes.
Hank’s Interventions. Hank’s intervention plan consisted of providing him with
opportunities for prosocial behavior and environmental supports (Prevent), teaching him alternative appropriate behaviors that were functionally equivalent to his problem
behaviors (Teach), and reinforcing the replacement behavior in a functionally equivalent manner (Reinforce). Extinction of target behaviors was attempted by no longer providing Hank with opportunities for peer attention contingent on him exhibiting disruptive
behaviors. During the intervention phases, students were instructed to ignore their peers who were being off-task or disruptive.
The team integrated the P-T-R interventions into one intervention plan, which was called the “Modified Tootling” intervention. The goal of Hank’s intervention plan was to assist him in obtaining peer and/or adult attention in an appropriate way. To accomplish this goal, the teacher first introduced the concept of tootling to the classroom using a script provided by the researchers. The procedural script described what tootling was, examples of tootling behaviors, and how to tootle. For the purpose of the study, tootling was defined as, “providing social reinforcement and praise contingent on positive appropriate behavior for that activity or setting (opposite of tattling)”. In previous research, tootling consisted of having students report peers' prosocial behaviors (i.e.,
tootle) to teachers (Skinner, Cashwell, & Skinner, 2000). Examples included but weren’t limited to: following directions, paying attention to the teacher, working quietly on assignment, sharing, and using materials appropriately. Once the teacher taught the classroom the rules of tootling, the examples were posted on large posters on a wall in the classroom to serve as visual cues and reminders. Hank, as well as his peers, was
provided tootling progress sheets so he could keep track of the number of times he was tootled on. Once the teacher introduced the concept of tootling and specific examples, the teacher provided tootling opportunities throughout the day simply by saying “Tootle”. At which point, each student looked to his or her partner, who changed throughout the day, and if the peer was exhibiting tootle worthy behaviors, they would reinforce one another by giving verbal praise. Every time Hank or any student got tootled on, he marked it down on his tootling progress sheet. At the end of the day, the student with the most tootles earned a tangible reward, usually a piece of candy.
Evaluation. Evaluation of the P-T-R interventions were done using the daily data collected by the teacher using the BRS and visual analysis of direct observation data collected by the researchers. The team reviewed the baseline data and compared it with the data collected during the intervention phases of the study.
Design and Analysis
The study examined the effectiveness of P-T-R on children with problem behaviors using an A-B-A-B design with follow-up; Component A being baseline with normal classroom services and component B being P-T-R interventions. Follow-up sessions were conducted at varying times after the last intervention phase for each
participant. A follow-up session was conducted at one week for Charlie and four weeks for Hank. Due to time constraints, no follow-up session was conducted for Gary. Visual analysis of level, trend, overlapping data points, and immediacy of effect was used to determine the effectiveness of the P-T-R strategy for each participant.
CHAPTER III RESULTS
P-T-R Functional Behavior Assessment
Interviews with the three teacher participants using the P-T-R Functional Behavior Assessment Checklist produced the following target behavior hypotheses. To exemplify the information summarized below see the corresponding FBA Summary Table for each participant in Appendix D as developed by the team.
When Charlie is instructed to stay on-task during large group activities, he will move around, talk to peers, fidget, and engage in audible vocalizations that are disruptive. As a result, he is able to temporarily escape the task/activity. It was hypothesized that Charlie’s problem behaviors were escape-maintained.
When Gary becomes frustrated, re-directed, or reprimanded, he will roll his eyes, argue, blur out, or walk away. As a result, Gary is temporarily allowed to escape the task/activity. The behaviors were occurring throughout the day but happened at a higher rate during math and group-work. It was hypothesized the Gary’s behaviors were escape-maintained.
When Hank is in large or small group activities or settings, he will make audible vocalizations and/or engage in other behaviors that disrupt others around him. As a result, Hank obtains attention via re-direct, verbal reprimands, and/or peer or adult attention. It was hypothesized that Hank’s disruptive behaviors were attention-maintained.
Charlie. Figure 1 depicts the results of the baseline and intervention phases for Charlie. During the first baseline phase Charlie engaged in disruptive behaviors a mean of 16% of the time and academically engaged a mean of 65%. Both dependent variables were stable when the first intervention phase began.
Figure 1. Percent of intervals during which Charlie was engaged in disruptive behaviors and was academically engaged during baseline and intervention conditions.
During the first intervention phase, Charlie engaged in disruptive behaviors an average of 6% of the time and academically engaged an average of 88%. Percentage of intervals with disruptive behavior and academic engagement were very stable throughout
0 20 40 60 80 100 1 2 3 4 5 6 7 8 9 10 11 12 13 14 15 16 17 Per ce n tage o f In te rv al s Academic Engagement Disruptive Behavior Baseline Treatment Baseline Treatment Follow up
the first intervention phase. Both dependent variables were stable when the second baseline phase began.
When the second baseline phase began, Charlie’s disruptive behaviors more than doubled from 6% to 14%. Academic engagement saw a decrease from 88% to 73%. During the second baseline phase he engaged in disruptive behaviors a mean of 16% and was academically engaged a mean of 61%. Charlie’s academic engagement was in a downward trend at the end of the second baseline phase, having dropped 33% from the previous data point.
During the second intervention phase, Charlie’s disruptive behaviors decreased from the previous baseline mean of 16% to a mean of 7%. Academic engagement increased from the previous baseline mean of 61% to a mean of 85%.
A follow-up session was conducted a week after the second intervention phase was concluded. Disruptive behaviors were observed a total of 3% of intervals and academic engagement was observed a total of 75% of intervals. The 5-star listener intervention was still being implemented by the teacher during the follow-up session.
In summary, a visual analysis shows that the intervention phases decreased
Charlie’s disruptive behaviors and increased his academic engagement. In addition, phase changes produced immediate effects on both dependent variables as was evident in Figure 1.
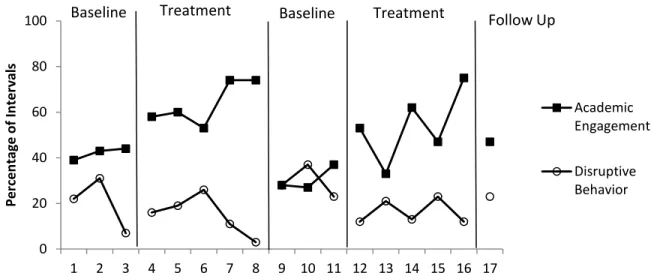
Gary. Figure 2 depicts the results of the baseline and intervention conditions for Gary. Throughout the first baseline condition, he was observed engaging in disruptive behaviors a mean of 7% of intervals and was academically engaged a mean of 54% of