GROWTH AND DEVELOPMENT IN THE IBERIAN PENINSULA: THREE ESSAYS
by
EMANUEL CASTRO DE OLIVEIRA
Licenciatura, Universidade de Coimbra, 1999 M.B.A., Kansas State University, 2001
AN ABSTRACT OF A DISSERTATION
submitted in partial fulfillment of the requirements for the degree
DOCTOR OF PHILOSOPHY
Department of Economics College of Arts and Sciences
KANSAS STATE UNIVERSITY Manhattan, Kansas
Abstract
Although geographic proximity is not enough to imply similar social, political and economic outcomes, the Portuguese and Spanish development experiences have been quite alike since the 15th century and in particular during the post-WWII period. Since 1950, both countries went through significant market transformations, ranging from democratization to market liberalization and adhesion to the European Union. However, even today, these economies, and in particular Portugal, do not rival those of the more developed European countries. This dissertation contributes to the growing body of literature on the Iberian economies by presenting three essays that employ modern macroeconomics tools to further our understanding about the growth and development experiences of these countries. The first essay provides a detailed growth accounting exercise and reconciles the results with the political and socioeconomic context of the 1950-2004 period. Since Total Factor Productivity is identified as the main engine of growth, the second essay explores a quantitative measure for the level of barriers that each country faced in the process of adopting new technologies. The numerical experiments suggest that Spain had consistently lower barriers than Portugal and that the gap has been increasing since the establishment of the European Single Market. The last essay investigates the role of fiscal policy and, specifically, if distortionary taxes on capital and labor income may have been a key factor behind the observed volatility for factor inputs. The simulation results derived from several potential scenarios support this conjuncture. Additionally, the last essay contributes by offering a time series for the levels of effective tax rates on labor and capital income in the Iberian economies over the 1975-2004 period.
JEL classification: E20, E62, O11, 033, O47.
Keywords: Economic development, Growth accounting, Technology barriers, Effective tax rates, Portugal, Spain.
GROWTH AND DEVELOPMENT IN THE IBERIAN PENINSULA: THREE ESSAYS
by
EMANUEL CASTRO DE OLIVEIRA
Licenciatura, Universidade de Coimbra, 1999 M.B.A., Kansas State University, 2001
A DISSERTATION
submitted in partial fulfillment of the requirements for the degree
DOCTOR OF PHILOSOPHY
Department of Economics College of Arts and Sciences
KANSAS STATE UNIVERSITY Manhattan, Kansas
2009
Approved by:
Major Professor Dr. Steven P. Cassou
Abstract
Although geographic proximity is not enough to imply similar social, political and economic outcomes, the Portuguese and Spanish development experiences have been quite alike since the 15th century and in particular during the post-WWII period. Since 1950, both countries went through significant market transformations, ranging from democratization to market liberalization and adhesion to the European Union. However, even today, these economies, and in particular Portugal, do not rival those of the more developed European countries. This dissertation contributes to the growing body of literature on the Iberian economies by presenting three essays that employ modern macroeconomics tools to further our understanding about the growth and development experiences of these countries. The first essay provides a detailed growth accounting exercise and reconciles the results with the political and socioeconomic context of the 1950-2004 period. Since Total Factor Productivity is identified as the main engine of growth, the second essay explores a quantitative measure for the level of barriers that each country faced in the process of adopting new technologies. The numerical experiments suggest that Spain had consistently lower barriers than Portugal and that the gap has been increasing since the establishment of the European Single Market. The last essay investigates the role of fiscal policy and, specifically, if distortionary taxes on capital and labor income may have been a key factor behind the observed volatility for factor inputs. The simulation results derived from several potential scenarios support this conjuncture. Additionally, the last essay contributes by offering a time series for the levels of effective tax rates on labor and capital income in the Iberian economies over the 1975-2004 period.
JEL classification: E20, E62, O11, 033, O47.
Keywords: Economic development, Growth accounting, Technology barriers, Effective tax rates, Portugal, Spain.
Table of Contents
List of Figures ... vii
List of Tables ... viii
Acknowledgements... ix
Dedication ... x
ESSAY 1 - Growth Accounting in the Iberian Political and Socioeconomic Context after World War II... 1
1.1. Introduction... 2
1.2. Growth Accounting Methodology ... 4
1.3. Data and Calibration ... 6
1.4. Iberian Experiences in the Post-WWII Period... 7
1.4.1. The Political and Socioeconomic Context ... 8
1.4.2. Macroeconomic Indicators... 13
1.4.2.1. Output per Capita... 14
1.4.2.2. The Employment Rate ... 17
1.4.2.3. Consumption and Investment ... 19
1.4.2.4. Capital-Output Ratio... 22
1.4.2.5. Total Factor Productivity ... 25
1.5. Growth Accounting Results... 28
1.5.1. Regime Changes ... 29
1.5.2. Growth Accounting Results with Linear Capital Accumulation ... 31
1.5.3. Growth Accounting Results with Exponential Capital Accumulation ... 36
1.6. Conclusion ... 40
ESSAY 2 - Iberian Barriers to Technological Adoption ... 42
2.1. Introduction... 43
2.2. Modelling Barriers to Technological Adoption... 46
2.2.1. The Corporate Sector ... 46
2.2.2. The Consumer Sector... 48
2.2.4. Decision Rules ... 50
2.3. Calibration ... 51
2.4. Iberian Development Experiences ... 53
2.4.1. Background ... 53
2.4.2. Spain ... 57
2.4.3. Portugal ... 59
2.4.4. Recent Evidence of Barriers ... 61
2.5. Conclusion ... 63
ESSAY 3 - Effective Tax Rates on Capital and Labor Income in the Post-dictatorship Iberian Economies... 65
3.1. Introduction... 66
3.2. Model with only Capital Income Taxes... 68
3.2.1. Calibration... 71
3.2.2. The Implied Capital Tax Rates ... 73
3.3. Model with both Capital and Labor Income Taxes ... 75
3.3.1. The Implied Capital and Labor Tax Rates ... 77
3.4. Exploiting the Conjuncture of Annual Tax Rates... 79
3.4.1. The Implied Annual Capital and Labor Tax Rates ... 80
3.4.1.1. Testing for Unit Roots and Structural Breaks in the Simulated Tax Series... 82
3.4.2. The Case of an Overestimated Employment Rate ... 92
3.4.3. The Case of Underestimated Consumption Preferences... 94
3.5. The Iberian Fiscal Experiences... 96
3.5.1. The Portuguese Fiscal Experience ... 97
3.5.2. The Spanish Fiscal Experience ... 100
3.6. Conclusion ... 103
Bibliography ... 105
Appendix A - Chronology of Political and Socioeconomic Events ... 112
Appendix B - Mathematical Appendix ... 113
Appendix C - Stata Code and Results for the Portuguese Tax Series ... 116
List of Figures
Figure 1.A Output per Capita... 14
Figure 1.B Employment Rate ... 18
Figure 1.C Consumption and Investment per Capita... 20
Figure 1.D Average Propensities to Consume and Save ... 21
Figure 1.E Capital-output Ratio with Linear Accumulation Process ... 23
Figure 1.F Capital-output Ratio with Exponential Accumulation Process... 24
Figure 1.G Total Factor Productivity with Linear Capital Accumulation ... 26
Figure 1.H Total Factor Productivity with Exponential Capital Accumulation ... 27
Figure 2.A GDP per capita relative to U.S. level... 54
Figure 2.B Spain: Model’s Fit ... 58
Figure 2.C Portugal: Model’s Fit ... 60
Figure 3.A Simulation Results for the Model with only Capital Income Taxes... 74
Figure 3.B Simulation Results for the Model with Capital and Labor Income Taxes... 77
Figure 3.C Simulation Results for the Model with Annual Capital and Labor Income Taxes.... 81
Figure 3.D Annual Effective Income Taxes in Portugal... 86
Figure 3.E Annual Effective Income Taxes in Spain ... 91
Figure 3.F The Portuguese Effective Tax Series on Capital Income (all scenarios) ... 97
Figure 3.G The Portuguese Effective Tax Series on Labor Income (all scenarios) ... 99
Figure 3.H The Spanish Effective Tax Series on Capital Income (all scenarios)... 101
List of Tables
Table 1.A Growth Accounting Estimates (δ = 5%; linear capital accumulation)... 31
Table 1.B Growth Accounting (δ = 10%; linear investment function)... 34
Table 1.C Correlations with Linear Capital Accumulation ... 35
Table 1.D Growth Accounting (δ = 5%; exponential capital accumulation)... 37
Table 1.E Growth Accounting (δ = 10%; exponential investment function) ... 38
Table 1.F Correlations with Exponential Capital Accumulation... 39
Table 2.A Calibrated Values... 52
Table 2.B Level of Barriers in Spain ... 58
Table 2.C Level of Barriers in Portugal... 60
Table 3.A Effective Tax Rates on Capital Income ... 74
Table 3.B Effective Tax Rates on Capital and Labor Income ... 78
Table 3.C Annual Effective Tax Rates on Capital and Labor Income ... 82
Table 3.D Annual Effective Tax Rates with Overestimated Employment Rate... 93
Acknowledgements
My deepest gratitude goes for my major advisor, Professor Cassou, for sharing his knowledge with me, his philanthropic nature, advices, patience and guidance throughout the doctoral program and elaboration of this dissertation. I also would like to thank you and your lovely family for allowing me to enjoy your company as well as the peace and inspiration surrounding your castle (and the Steinway) - I will always feel indebted to you.
My heartfelt appreciation also goes to Professors Blankenau, Chang, Bachmeier and Nafziger for their teachings, advices, and direct and indirect contributions to this work. I also would like to thank Professors Kisangani and Pickering for sharing with me the indispensable insights of political scientists. Another word of deep gratitude goes to Professor Poggi-Corradini for teaching me calculus so well that immensely eased my understanding of economic models. I am also grateful for those long discussions about the Austrian school of thought, economics in general, and prosciutto.
I also would like to thank Professor Lloyd Thomas for his availability, advices, and for masterfully improving the quality of the economics department. My sincere appreciation continues to Susan, Kristi, and Jamie for their indispensable and prompt assistance throughout these years. Another sincere thank you goes to all my friends and colleagues in the economics and agricultural economics departments for all those long hours of exciting and rich debates about economics. I have learned a lot with you too. I am also very grateful to the Department of Economics and Kansas State University for the graduate teaching assistantship during my doctoral studies, and to Dean Shanklin and Mrs. Pfizenmaier in the Graduate School for their cooperation and understanding.
At last but not the least, my heartfelt gratitude to my family and Dominika, without whom my doctoral studies in economics would not have been more than a dream.
Dedication
ESSAY 1 - Growth Accounting in the Iberian Political and
Socioeconomic Context after World War II
1.1. Introduction
During the 15th and 16th centuries, Spain and Portugal were the major economic, political and cultural powers of Europe, sharing the world according to the 1492 Treaty of Tordesillas. Alas, leadership proved difficult to maintain and between the 17th and 19th centuries. The balance of power moved toward northern European states and the Iberian nations became relatively backward. The early 20th century saw further stagnation and lengthy periods of dictatorship rule. However, after WWII and in particular during the 1960s, the reconstruction of Europe led to an extraordinary period of growth in the old continent. Portugal and Spain were no exception, experiencing their golden years during the 1960-1973 period.
The worldwide effects of the 1973 oil shock along with a long and costly colonial war fostered the Portuguese discontent with the dictatorial regime. The increasing social and economic unrest culminated in the Carnation Revolution of April 25th, 1974, and initiated the so-called third wave of democratization in the world (Huntington, 1997). Coincidentally, Francisco Franco died in November 1975 and Spain initiated a similar democratization process, despite restoring to King Juan Carlos, who in the meantime had been exiled in Portugal, the role of Chief of State.
Not surprisingly, the young democracies had a checkered start. The striving for power by newly established political parties along with weakened institutions resulted in a period of political and economic instability. In the first two years after the revolution there were six provisional governments in Portugal, followed by eight constitutional governments during the 1976-1983 period.
Spain, on the other hand, was able to manage the transition in a relatively less turbulent manner. More specifically, in their attempt to end hostilities between the new and the old politics, Spain followed a negotiated model of transition to democracy where, according to Colomer (1991), negotiations and pacts among political elites and consensus among citizenry avoided acts of revenge, violent confrontations, and civil war. Despite relative stability during the early years, Tejero’s failed coup d’état in 1981 uncovered the political and social fragilities of a young democracy.
Currency crises in the early 1980s shattered both economies and shortly after a sluggish and mild recovery came the joint adhesion to the European Community in 1986. The favorable oil shock and the massive inflow of European structural funds prompted economic performance until the 1992 widespread recession. At this time, in addition to the already challenging economic conditions, the Maastricht treaty imposed severe fiscal and monetary policy constraints to meet the criteria for adopting the euro currency a decade later.
The dynamic of economic transformations did not stop. In 1994, the establishment of the European Single Market and resulting free mobility of goods, services, capital and labor, marked the beginning of an era characterized by increasing exposure to international competition.
Most recently, between 2000 and 2004, a series of international developments impacted the Iberian Economies. These events included, for example, the international stock market crash in March of 2000, and a gradual increase in oil prices along with worsening terms of trade.
Based on the above, each Iberian country seems to routinely experience what the other does. However, even today, these economies, and in particular Portugal, do not rival those of the more developed members of the European Union.
The purpose of this essay is to present a detailed examination of the post-WWII Iberian development experiences and to identify the main drivers and deterrents of growth. With this goal in mind, a standard growth accounting framework will be employed and the quantitative results consolidated with the political and socioeconomic context.
To our knowledge, this essay contributes to the literature by offering a comprehensive growth accounting exercise for the Iberian countries that contemplates two potential capital accumulation processes (linear and exponential) along with two different capital depreciation regimes. Consequently, we examine four different capital construction scenarios and assess the sensitivity of the growth accounting results for the entire 1950-2004 period.
The text is structured as follows. Section 1.2. derives the growth accounting methodology. Section 1.3. describes the data and the calibration procedure. Section 1.4. provides a detailed assessment of the Iberian political and socioeconomic context, and macroeconomic indicators. Section 1.5. discusses the growth accounting results and Section 1.6 concludes.
1.2. Growth Accounting Methodology
The usefulness of growth accounting is to identify the main sources and deterrents of growth for a given economy during a specific time interval. Like most of the economic techniques, it oversimplifies the number of variables that could impact a country’s performance, mainly due to constraints in data collection and availability. The accounting exercise presented in this study focuses on assessing whether differences in growth performance between Portugal and Spain arise mostly due to differences in paths for factor inputs or total factor productivity.
Notwithstanding, it provides valuable quantitative insights about potential growth related issues and a coherent methodology to perform cross-country comparisons.
This essay adopts the framework used by Bergoeing et al. (2002) and Hayashi and Prescott (2002) to perform similar growth accounting exercises for other countries. Real Gross Domestic Product (GDP) is assumed to follow a relationship quantified by the standard Cobb-Douglas production function, Yt = AtKtαL1t−α, where at any time t, the quantity of output available (Yt) depends on employed levels of labor (Lt) and capital (Kt), the marginal contribution of each factor input (α for capital), as well as on total factor productivity (At). In this set up, the latter component, also known as the Solow residual, captures technological progress and other elements that contribute toward output which are not accounted for as capital or labor. Another noteworthy aspect of this output formulation is that it exhibits constant returns to scale because the marginal contributions of the factor inputs add up to one, meaning that if each input changes by a scalar, z, then output changes by an equal proportion, and vice-versa.
As commonly agreed, when performing country comparisons it is appropriate to use per capita measures. Here, the number of hours available for work by working age persons (Nt) is used as a proxy for the population and Lt is redefined as the number of hours actually worked. To express output in per capita terms, the Cobb-Douglas production has been rearranged as follows. ⇔ = ⇔ = ⇔ = − − − − − t t t t t t t t t t t t t t t t L Y K A Y L Y K A Y L Y Y K A Y α α α α α α α α 1 1 1 1 1 1 t t t t t t t N L Y K A N Y α α α − − = 1 1 1 . (1.1)
In addition, to decompose the growth rate of output per capita in terms of changes in the capital-output ratio and the employment rate it is convenient to express the above relationship in logarithmic form (Hayashi and Prescott, 2002).
+ − + − = t t t t t t t N L Y K A N Y ln ln 1 ln 1 1 ln
α
α
α
(1.2)Equation (1.2) is the key formula for growth accounting exercises since it allows one to estimate the contributions of each factor input and Total Factor Productivity (TFP) on the growth rate of output per capita.
1.3. Data and Calibration
Aggregate levels for real GDP, Yt, investment, It, during the 1950-2004 period were computed based on data from Penn World Table version 6.2 (Heston et al., 2006) for real GDP per capita, population and the percentage of real GDP per capita allocated toward investment.1 Values for aggregate consumption, Ct, were calibrated using Ct =Yt −It. Data on Nt and Lt and α are from the Groningen Growth and Development Centre’s Total Economy Database (2008). Hence, α is set at 0.3 based on historical averages for both countries.2 The depreciation rate, , is set initially at a 5 percent rate, similar to Bergoing et al. (2002), and later at 10 percent δ in order to assess the results’ sensitivity to the depreciation rate assumptions.
The next step involved generating a series for the capital stock following the standard capital motion equation (Bergoing et al., 2002), Kt+1 =(1t −
δ
)Kt −It, where K1950 was set at
1
Using Penn World Table version 6.2 data, aggregate output per year was computed by multiplying the annual values of GDP per capita with total population. Similarly, aggregate investment was set equal to the product of GDP per capita times the percentage allocated toward investment and total population.
the value mentioned in Nehru and Dhareshwar (1993) for Spain and Portugal, respectively. The robustness of the accounting exercise is also tested under an exponential capital accumulation function, Kt+1 = AkKt1−δItδ (Lucas and Prescott, 1971), where Ak was set at 1.305 based on the procedure outlined in Parente and Prescott (2000) and discussed in detailed in Essay 2. Succinctly, the value is calibrated assuming the principle of common technology in factor inputs across countries, otherwise there would be no discipline in the analysis.3 Consequently, the accounting results will be tested under four possible time series for capital stock, derived from the set of assumptions for its capital accumulation process and depreciation rates. Given
α
,t
K , Lt, and Yt, four different series for TFP were computed, using = α 1−α
t t t t L K Y A and the
assumptions mentioned above regarding the depreciation rate and the motion of capital formulation.
1.4. Iberian Experiences in the Post-WWII Period
Before engaging the growth accounting exercises, it is useful to understand the main social, political and economic events that may also had an impact on the growth and development experiences of Portugal and Spain during the post-WWII period. This assessment begins with the characterization of the political and socioeconomic context and then proceeds by reconciling this history with the observed path of output per capita, the unemployment rate, consumption, investment, capital-output ratios, and TFP.
3
1.4.1. The Political and Socioeconomic Context
In 1950, both Portugal and Spain were under consolidated dictatorship regimes. António de Oliveira Salazar had been the prime minister of Portugal since 1932 and had complete control over governmental policies. Similarly, Francisco Franco, another right-wing dictator, had been the Spanish head of state since October 1936.
The roots of these dictatorships followed similar routes. Salazar started his political career as finance minister of the “Ditadura Nacional”, instituted after the 1926 coup d’etat that ousted the First Portuguese Republic. This regime change was followed by Spain a decade later, though in a more turbulent manner. In July 1936, Franco participated in a failed coup d’ etat that ousted the Second Spanish Republic and led the country back into civil war. In the midst of this conflict, Franco emerged as the leader of the Nationalists and achieved victory by April 1939 with the support of Hitler, Mussolini, and Salazar.4
Until the 1950s both dictatorships pursued similar economic policies, primarily driven by import substitution and transformation of the industrial sector. Alas, the turmoil of the 1930s along with WWII inhibited the potential success of these policies and economic performance.
In the 1960s, the Iberian countries decided to engage in significantly different trade policies. Portugal joined the European Free Trade Agreement (EFTA) and progressively opened its economy to the world while Spain remained focused on autarky policies. Notwithstanding different views about international trade, both countries continued to pursue industrial policies
4
The Iberian Pact, signed in March 1939, is another example of the long lived complicity between Portugal and Spain. This pact conveyed a treaty of friendship and nonaggression between Franco and Salazar and insurance
and experienced an unprecedented period of growth from early 1960s until the international energy crisis of 1973.5 This period became known as the Iberian golden years (Lopes, 2004a).
A cursory look at Appendix A reveals that Spanish growth was mainly driven by the massive and profound transformation of the industrial sector and dramatic increases in productivity. Industrial productivity increased by 100 percent between 1964 and 1973. Particularly impressive was automobile production which increased at an extraordinary pace of 22 percent per year (Tortella, 2000). In fact, Tortella (2000) characterizes this period as the Spanish industrial revolution, and the automobile sector its leading source because it fostered the development of at least three additional industries: rubber production, iron and steel, and petroleum refining.
On the other hand, Portugal focused more on the progressive opening of its economy to the world; the merchandise export growth rate between 1959 and 1973 was 11 percent per year whereas in industrialized countries it averaged 8.9 percent (Baklanoff, 1992). Interestingly, an analysis of the direction of trade from 1960 to 1972 shows two major trends: the relative decline in importance of overseas territories and the growing importance of EFTA in the composition of exports and imports (Baklanoff, 1992). Regardless of the different approaches to international trade both Iberian countries experienced significant growth during the 1960-1973 period.
Despite spending most of the 1960s protecting its domestic industry from international competition, in 1968 Spain began to tentatively open its borders.6 Yet, these early steps where
5
Lopes (2004a) indicates that output per capita during the 1960-1973 period grew at an annual average of 6.9 percent in Portugal and 6.1 percent in Spain, and that these growth rates were significantly higher than those experienced by Portugal and Spain during the 1950-1960 period (3.6 and 3.8 percent, respectively) and the 1973-1994 period (1.9 and 1.7 percent, respectively).
6
A landmark of such efforts was the 1970 Preferential Trade Agreement with the European Common Market which by 1979 turned into full adhesion to EFTA.
shadowed by an embarrassing situation to Franco’s regime. The Spanish dictatorship was shaken by a financial scandal involving the minister of finance, the minister of commerce, the Bank of Spain’s governor, Opus Dei, and Matesa, a firm that was being used for illegal use of export subsidies (Tortella, 2000). Curiously, at this time Portugal also experienced its first glimpse toward the end of dictatorship - illness led to the replacement of Prime Minister Salazar by Marcelo Caetano. Henceforth, the latter and President Américo Tomás assumed a somewhat less oppressive posture, particularly in relation to the freedom of expression.
In the early 1970s, Portugal witnessed an 8.4 percent increase in population prompted by the return of Portuguese citizens from disrupted colonies and a spreading malcontent about the burden that the colonial war had imposed on the state and families. These issues along with the economic repercussions of the 1973 adverse oil shock, which led to a severe deterioration of the Iberian terms of trade because of the high dependency on imports of crude oil, promoted severe social and political turmoil which ultimately led to the “Carnation Revolution”. In 1974, Portugal was caught between industrial Europe and colonial Africa, and between an incipient decline of corporatism and emerging market capitalism (Baklanoff, 1992).
The military coup of April 25th 1974 ousted the long-lived authoritarian regime of António de Oliveira Salazar (1932-68) and Marcelo Caetano (1968-74), whereas the Spanish dictatorship (1939-75) ended with the death of Francisco Franco. According to Huntington (1997), the regime changes in the Iberian Peninsula marked the beginning of the third wave of democratization and the age of democracy in the world.
Both Iberian countries followed a negotiated model of transition to democracy where pacts among political elites and consensus among citizenry sought to avoid acts of revenge, violent confrontations, and civil war (Colomer, 1991). In 1975 for example, Spain’s
democratization took place by consensus and reconciliation which meant that the new system incorporated the previously clandestine anti-Franco opposition along with important continuities from the Franco era, especially in the security and military areas (Maxwell, 1991).
The struggle for power among newly established political parties, along with incipient democratic institutions, incubated a period of relative political and socioeconomic instability. For example, in the first two years after the revolution there were six provisional governments in Portugal, followed by eight constitutional governments during the 1976-1983 period. Spain, on the other hand, experienced a smoother transition process skillfully managed by the new chief of state, King Juan Carlos I, who had lived in exile in Portugal until Franco’s death. But despite the apparent stability during the early years, Tejero’s failed coup d’état in 1981 uncovered the political and social fragilities of a young democracy.
The mid-1970s Iberian democratization also led to upheavals in the economic system. The Portuguese revolutionaries nationalized commercial banks and most heavy and medium size industries in order to emasculate the old elite’s economic base. Spain, on the other hand, implemented less dramatic changes during the early years of democracy mainly due to the fact that the new middle class was dismayed with the impact that radical economic measures had had on the Portuguese economy (Baklanoff, 1978). Consequently, priority was given to stop-gap economic measures such as the Moncloa Pacts, which assured a degree of moderation for increases in prices and salaries (Tortella, 2000).
Currency and banking crises in the early 1980s shattered both economies. Portugal’s balance of payments deficit was the main reason for two consecutive currency crises, namely in 1977 and 1983. In both cases, the Portuguese were assisted by the International Monetary Fund which required it to implement fiscal and monetary policy constraints (Nunes and Valerio,
2005). Across the border, the 1978-1985 banking crisis in Spain was one of the worst in Europe and affected 58 banks, which together accounted for 27 percent of deposits (Chislett, 2008). The crisis originated in a high volume of non-performing loans linked to an industrial meltdown following the inflationary episodes prompted by the adverse oil shocks in the 1970s. The solution comprised, among other things, new regulatory measures by the Bank of Spain regarding solvency requirements and compliance.
Shortly after a sluggish and mild recovery came the joint adhesion to the European Community in 1986. Lower oil prices along with the inflow of European structural funds, foreign direct investment, gradual privatization of state monopolies, deregulation of prices and markets fostered economic performance until the 1992 recession in Western Europe. On top of this widespread contraction, the Maastricht treaty imposed additional constraints on fiscal and monetary policy in order to transition to the euro currency a decade later. The criteria to adhere to the European Monetary Union included: “inflation over 12 months could not exceed by more than 1.5 percentage points the average rate among the three EC countries with the lowest inflation; long-term nominal interest rates over 12 months could not exceed by more than 2 percentage points the average for the same three countries; the currency had to remain in the narrow band of the exchange rate mechanism for at least two years without devaluation; the budget deficit should not exceed 3 percent of GDP; and total public debt could not exceed 60 percent of GDP” (Maxwell and Spiegel, 1994, p.51).
The Maastricht rules along with the continuous inflow of EU transfers helped to reduce the public sector deficit but the 1994 establishment of the European Single Market and resulting free mobility of goods, services, capital and labor, marked the beginning of an era characterized
by increasing exposure of domestic industries to international competition.7 The latter along with several reforms imposed by joining the single market, spanning from environmental quality to consumer protection, further exacerbated the challenges facing domestic firms (Torres, 2000). The competitiveness of some Iberian businesses could not be more bluntly tested. One of the outcomes was the relocation of less competitive businesses to countries with lower labor costs (Lopes, 2004b) and a deepening of the trade deficit, particularly after 1997 (WDI, 2006).
Despite these challenges, both countries experienced modest growth in the late 1990s, probably nourished by the continuing privatization of parastate industries and market deregulation.8 It is worth mentioning that Portugal was at the time one of the largest “privatizers” in the OECD, with revenues amounting to approximately 2.8, 4.7, 3.9, and 1.5 percent of GDP between 1996 and 1999 (Torres, 2000).
Between 2000 and 2004, a series of international adversities impacted the Iberian economies. These included, for example, the international stock market crash in March of 2000 and the gradual increase in oil prices along with worsening terms of trade. Relatively, Spain ended up better off probably due to its lower degree of openness.
1.4.2. Macroeconomic Indicators
Given the Iberian political and socioeconomic history just outlined, this essay proceeds by studying its potential relationship with the path of macroeconomic indicators. This section begins by assessing output per capita and employment rates followed by an analysis of the levels
7
In Portugal and Spain, EU transfers accounted for 1.5 to 3 percent of GDP per year during the second half of the 1990s (Allard et al., 2008).
8
of consumption, investment, and the estimated levels of capital-output and TFP during the period of interest.
1.4.2.1. Output per Capita
Figure 1.A depicts real GDP per hour of work available, which is being used as a proxy for real GDP per capita. As shown below, there are striking similarities in the path of output per capita, despite Spain’s being always higher than Portugal’s.
The 1950s were harsh times for most economies around the world and the Iberian experiences were no exception. The economic repercussions of WWII and the long reconstruction process constrained the economic performance of most countries. Despite the overall sluggish performance, Spain was able to perform better than Portugal. In 1950, the Spanish’s output per capita was 37 percent higher than the Portuguese and this gap increased by 1960, reaching 41 percent.
Figure 1.A Output per Capita
0 2 4 6 8 10 12 14 16 18 1950 1954 1958 1962 1966 1970 1974 1978 1982 1986 1990 1994 1998 2002 $ 2 0 0 0 Portugal Spain
industrialization efforts fostered a period of unprecedented growth. As mentioned in the previous section, during the 1960s Portugal and Spain had a different view about the role of international trade. While Portugal engaged in the progressive opening of its economy to the world, Spain remained focused on import substitution policies. Consequently, it is not surprising that the Portuguese merchandise export growth rate averaged 11 percent per year over the 1959-1973 period while in most industrialized countries it was 8.9 percent (Baklanoff, 1992). Spain, on the other hand, while not experiencing such a high overall growth rate in exports, saw its automobile production increasing at an extraordinary pace of 22 percent per year (Tortella, 2000). Using output per capita as a measure of comparative policy success, it appears that the Portuguese did a better job because the output per capita gap shrunk to 21 percent by 1974.
As shown in Figure 1.A, the democratization process impacted the Portuguese economy more severely than the Spanish, especially during the first two years. This occurrence might have been related to the fact that, besides political instability and economic reforms, the dismemberment of the colonial empire resulted in the loss of a significant source of income for the Portuguese (Baklanoff, 1992). Spain, on the other hand, was able to buffer the potential adverse shock of democratization on output per capita because it had a smoother political transition and implemented less dramatic economic reforms (Baklanoff, 1978). Overall, the political and economic turbulence during the first decade of democracy resulted in a relative stagnation in the levels of output per capita in the Iberian countries. However, in the midst of the turmoil, Portugal was able to gain on the Spanish output per capita by cutting the Spanish advantage to only 16 percent by 1986. This gain probably arose because of the increase in unemployment in Spain, as it will be discussed later on.
Soon after the adhesion to the European Community both economies went through a new expansionary period, this time prompted by a favorable oil shock, the inflow of structural funds and privatizations. Portugal was able to shrink the output per capital gap against Spain further, driving the disparity to 14 percent by 1991. Alas, by the next year a widespread recession hit Western Europe, the Maastricht Treaty was signed and the Iberian economies were obliged to comply with fiscal and monetary constraints. All these events led to a reversal in the output per capita curve. Interestingly, the relative level of output per capita in the Iberian economies shrunk further, reaching 12 percent in 1992.
The year 1994 marks the beginning of a new era characterized by increased exposure to international competition and free mobility of goods, services, labor and capital among the European Union member states. In this year, Spain had a level of output per capita merely 10 percent higher than Portugal. As portrayed in Figure 1.A., it seems that Spain was better prepared for this challenge and consequently was able to grow faster than Portugal during the first decade of European Single Market membership. The relatively better Spanish performance pushed the gap in output per capita back up to 13 percent by 2004.
Given that both Iberian countries benefited from the inflow of structural funds, were obliged to implement identical reforms, and faced similar external shocks, one speculative explanation for the Portuguese inability to perform as well as Spaniards in recent years might be related to the scarcity of skilled labor. In fact, between 1993 and 2003, only 10 percent of the Portuguese labor force had tertiary education whereas in Spain this share accounted for 24 percent (WDI, 2006).
1.4.2.2. The Employment Rate
In terms of employment, the situation was relatively stable in the Iberian economies throughout the entire 1950-1974 period, as depicted in Figure 1.B.9 However, massive emigration motivated by attractive worker programs during the reconstruction of Central Europe may have buffered any potential adversities, particularly in Portugal. As Baklanoff (1992) noted, Portuguese emigration provided a safety valve for open and disguised unemployment, particularly in rural areas. It is noteworthy, that Portuguese emigration was not only fostered by attractive foreign remuneration packages, but also the willingness of many young men to avoid recruitment for the colonial war, initiated in 1961 with the outbreak of guerilla warfare in Angola and in the other African territories.
On the other hand, massive public investment associated with development plans implemented throughout the 1950-1974 period probably prompted the creation of jobs. Whatever the true reasons behind the stability of the Portuguese employment rate, the fact is that 15.6 percent of the Portuguese population emigrated during the 1960-1973 period whereas in Spain this figure accounted for only 2.2 percent of the population during the 1960s (Appendix A).
9
The ratio of hours actually worked versus available hours to work is being used as a proxy for the employment rate.
Figure 1.B Employment Rate 0.00 0.10 0.20 0.30 0.40 0.50 0.60 0.70 0.80 1950 1954 1958 1962 1966 1970 1974 1978 1982 1986 1990 1994 1998 2002 Portugal Spain
The Iberian democratization process initiated in the mid 1970s marked the beginning of a period where the volatility of the employment rate increased, especially in Spain. During this period, the latter experienced high and persistent unemployment rates probably due to relatively higher levels of unemployment benefits which fostered the agent’s preference for leisure. Blanchard’s (1995, p.216-7) argument for the different labor market experiences in Spain and Portugal goes as follows:
“In Spain, high employment protection and unemployment benefits have led to small effects of labor market conditions on wages. This led to large adverse effects of disinflation on unemployment in the first half of the 1980s. And high persistence since then explains why unemployment has remained high since. In Portugal, in contrast, low unemployment benefits have led, despite the presence of high employment protection, to a higher response of wages to unemployment. This has led to smaller adverse effects of disinflation on unemployment. And it has led to less unemployment persistence.”
Adhesion to the European Community in 1986 and the resulting structural investments may have been behind the shortly lived upswing in the employment rate. Unfortunately, the 1992
noted relative readiness of Spanish firms for the European Single Market could be one of the factors explaining the upward trend on Spanish employment over the next decade.
1.4.2.3. Consumption and Investment
The striking similarities between Portugal and Spain observed in the output per capita ratios also hold in the levels of consumption and investment per capita, as depicted in Figure 1.C.10 Not surprisingly, given that Spain experienced higher levels of output per capita than Portugal, the same higher levels are seen in the consumption and investment data. Another interesting observation is that the Iberian consumption and investment data confirms a stylized fact in macroeconomics: consumption is less volatile than investment.
Notwithstanding the similarities delineated above, the path of investment in Portugal and Spain exhibits some relevant disparities, particularly during the post-dictatorship period. In the 1974-1986 period, investment per capita in Spain experienced a steady decline probably due to the similar trend in the employment rate while Portugal’s investment level recorded a rapid decrease in the first two years of democracy, followed by a significant increase until 1983 and another steep decline during the next three years. These fluctuations seem to indicate that the Carnation Revolution created a two-year wave of unusual willingness to consume (shown later on in Figure 1.D), probably due to high expectations about future income during democratic times and the ensuing economic reforms. However, these changes were short-lived as the Portuguese perceptions adjusted and investment per capita returned to the early 1970s levels.
10
Figure 1.C Consumption and Investment per Capita
Consumption per Capita
0 2 4 6 8 10 12 14 1950 1954 1958 1962 1966 1970 1974 1978 1982 1986 1990 1994 1998 2002 $2000 Portugal Spain
Investment per Capita
0 1 2 3 4 5 1950 1954 1958 1962 1966 1970 1974 1978 1982 1986 1990 1994 1998 2002 $ 2 0 0 0 Portugal Spain
The decline in investment per capita experienced during the 1983-1986 period in Portugal could have resulted from the IMF intervention following the 1981-1983 currency crisis, which imposed serious fiscal and monetary constraints to offset the balance of payments deficit and in turn constrained the levels of public investment. Later on, the divergence recorded in the post-2000 period was mostly likely related to the higher degree of openness of the Portuguese economy relative to the Spanish because the series of adverse international shocks recorded at this time, namely the stock market crash in March of 2000 and the gradual worsening of the terms of trade due to higher energy costs, left the Portuguese economy relatively worse off.
In order to further investigate these fluctuations, the average propensities to consume and to save were computed using the consumption-output and investment-output ratios as proxies for those measures. The results are displayed in Figure 1.D.
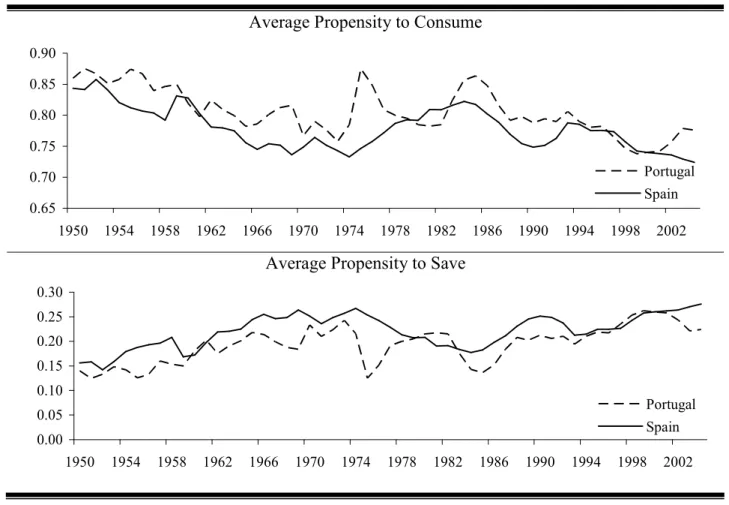
Figure 1.D Average Propensities to Consume and Save
Average Propensity to Consume
0.65 0.70 0.75 0.80 0.85 0.90 1950 1954 1958 1962 1966 1970 1974 1978 1982 1986 1990 1994 1998 2002 Portugal Spain
Average Propensity to Save
0.00 0.05 0.10 0.15 0.20 0.25 0.30 1950 1954 1958 1962 1966 1970 1974 1978 1982 1986 1990 1994 1998 2002 Portugal Spain
The figure corroborates the discussion just outlined for the observed fluctuations in the investment per capita ratios during the post-1974 period by revealing the tradeoffs between the willingness to consume and invest during each cycle. In particular, the spikes in the Portuguese average to consume initiated in 1974, 1983 and 2000, and the resulting crowding-out effects in the saving rate. Figure 1.D also indicates that on average the Spaniards have a lower propensity to consume and a higher propensity to save than the Portuguese. The latter inference could
explain the persistent higher level of output per capita in Spain because the higher savings rate yields greater investment and production capacity. We now turn to this possibility by investigating the capital to output ratios.
1.4.2.4. Capital-Output Ratio
The Iberian capital-output ratios presented here are based on the calibration procedure described in Section 1.3. Briefly, these ratios were computed based on four different potential scenarios widely used in macroeconomic analysis which basically combine the assumptions that capital accumulation could follow a linear or exponential process and that the depreciation rate is expected to be between 5 to 10 percent. Following this approach, four different series for capital-output ratios will be suggested below in order to give a more detailed description about the potential true values of the capital-output ratios in the Iberian economies. The presentation first investigates simulated series for the capital-output ratios under a linear accumulation process allowing the depreciation rate to be either 5 or 10 percent and then investigates two additional series based on the assumption that capital accumulation follows an exponential process constrained by the same two levels of depreciation rate.
Figure 1.E plots the estimated capital-output ratios based on the assumption that capital is accumulated in a linear fashion. Regardless of the calibrated depreciation rate, throughout the 1950s and most of the 1960s, the estimated capital-output ratio was relatively higher in Portugal, suggesting that during this period output production in Spain was less capital-intensive. However, the late 1960s indicate a switch in positions, with Spain becoming consistently more capital-intensive than Portugal until the early 2000s.
Figure 1.E Capital-output Ratio with Linear Accumulation Process 05 . 0 = δ 0.00 0.50 1.00 1.50 2.00 2.50 3.00 3.50 1950 1954 1958 1962 1966 1970 1974 1978 1982 1986 1990 1994 1998 2002 Portugal Spain 10 . 0 = δ 0.00 0.50 1.00 1.50 2.00 2.50 1950 1954 1958 1962 1966 1970 1974 1978 1982 1986 1990 1994 1998 2002 Portugal Spain
The switch in relative capital-intensity in the late 1960s is consistent with the political and socioeconomic history delineated in Section 1.4.1. as well as with the divergence in the levels of investment per capita observed throughout the 1960s (Figure 1.C). At this time, Franco implemented several policies aimed at industrialization and import substitution such as the 1960 highly protectionist tariffs, the 1961 law on Top Priority Industries, and the 1964 Development Plan (Appendix A). The fact that Spain overcame the Portuguese capital-output ratio advantage is probably an indicator of these policies’ success.
The argument just outlined is also valid when capital is assumed to follow an exponential accumulation process and a 10 percent depreciation rate, as depicted in Figure 1.F. For the case when the depreciation rate is set at 5 percent, the leadership switch in the levels capital-output
ratios is delayed until 1978. Nonetheless, despite the timing, all simulations indicate a switch in the relative ratios of capital-output during the 1950-2004 period, and Portugal catching-up by 2003-2004.
Figure 1.F Capital-output Ratio with Exponential Accumulation Process
05 . 0 = δ 0 5 10 15 20 25 1950 1954 1958 1962 1966 1970 1974 1978 1982 1986 1990 1994 1998 2002 Portugal Spain 10 . 0 = δ 0.00 0.50 1.00 1.50 2.00 2.50 3.00 1950 1954 1958 1962 1966 1970 1974 1978 1982 1986 1990 1994 1998 2002 Portugal Spain
By comparing the estimates obtained under the two different assumptions for the capital accumulation process it is clear that the levels of the ratios are higher for the latter simulations. This is a direct result of the exponential capital accumulation process, Kt+1 = AkKt1−δItδ, because it imposes an adjustment cost and therefore implies a preference for smoother investment patterns. As depicted in Figure 1.C, the data suggests that this assumption about the capital accumulation process probably does not hold since the investment per capita ratios present some
degree of volatility. Therefore, it might be the case that the capital-output ratios estimated under the linear accumulation process are closer to the true values.
1.4.2.5. Total Factor Productivity
Given the capital-output ratios, data on aggregate output, labor markets, and the marginal contribution of capital, four different series for TFP were computed based on the calibration procedure described in Section 1.3. If TFP, in the standard Cobb-Douglas production function, can be interpreted as a proxy for available technology and loosely defined as everything else, “residual growth”, that enables a certain level of output except for the observed contributions of capital and labor, then there is a myriad of factors than can impact it. Hall and Jones (1999) argue that TFP depends heavily on the quality of the social infrastructure because in their view a good infrastructure facilitates the adoption of new ideas and technologies. On the other hand, Parente and Prescott (1994, 2000, 2005) claim that TFP is primarily driven by potential barriers to technological adoption such as regulatory and legal constraints, bribes that must be paid, violence or the threat of violence, outright sabotage, and worker strikes. In this essay, we will focus on estimating the path of TFP and briefly speculate about its fluctuations. However, Essay 2 will study this issue in-depth
The presentation of the estimated levels of TFP will follow the previous layout, i.e. we will start by assessing the estimated levels when capital is assumed to accumulate in a linear fashion and then we will discuss the TFP estimates attained when imposing capital accumulation to follow an exponential process.
As depicted below, Figure 1.G indicates that Spain consistently had better technology than Portugal over the 1950-2004 period if we assume that the capital accumulation process is
linear. These estimates could also corroborate the Spain’s ability to consistently achieve higher levels of output per capita than the Portuguese since the former would be able to produce more even if they had just the same amounts of inputs as the latter.
Figure 1.G Total Factor Productivity with Linear Capital Accumulation
05 . 0 = δ 0 2 4 6 8 10 1950 1954 1958 1962 1966 1970 1974 1978 1982 1986 1990 1994 1998 2002 Portugal Spain 10 . 0 = δ 0 2 4 6 8 10 1950 1954 1958 1962 1966 1970 1974 1978 1982 1986 1990 1994 1998 2002 Portugal Spain
Figure 1.G. also shows that in the 1974-1976 and 1982-1984 periods there were significant declines in the Portuguese levels of TFP. Before turning to the discussion of these downturns, let us verify if these also hold when the motion of capital is assumed to follow an exponential formulation. Figure 1.H plots the estimates under the latter assumption.
Figure 1.H Total Factor Productivity with Exponential Capital Accumulation 05 . 0 = δ 0 1 2 3 4 5 1950 1954 1958 1962 1966 1970 1974 1978 1982 1986 1990 1994 1998 2002 Portugal Spain 10 . 0 = δ 0 2 4 6 8 10 1950 1954 1958 1962 1966 1970 1974 1978 1982 1986 1990 1994 1998 2002 Portugal Spain
Comparing both Figure 1.G and 1.H we can confirm that regardless of the capital accumulation process, the estimated levels of TFP are inversely related to the depreciation rates assumed, and as expected, this relationship being more explicit for the case of an exponential capital accumulation process.11 Moreover, all the scenarios delineated above indicate the 1974-1976 and 1982-1984 TFP divergences previously mentioned. The variation in available technology is probably associated with the social and economic stress experienced in each period. The 1974-1976 period corresponds to the start of the democratization in Portugal and the process of massive nationalizations aimed at emasculating the old elite's economic base.
11
Moreover, as previously outlined, this increased economic uncertainty and investment per capita shrunk (Figure 1.C). Hence, it is not surprising that these changes may have disrupted TFP. In the 1982-1984 period Portugal was in the midst of a currency crisis which required the correction of the balance of payments deficit through strict fiscal and monetary policies. Among the widespread repercussions, there was a significant decrease in public investment along with the overall decrease in investment per capita (Figure 1.C) which in turn may have had an adverse effect on TFP.
Despite the similar political and socioeconomic context, Spain was able to keep its relative technological advantage throughout the 1950-2004 period, regardless of the assumption employed to compute TFP estimates. Overall, it appears that when it comes to technological adoption Spain has been able to do a better job than Portugal despite potential economic and political challenges. As discussed earlier, the democratization process and the adhesion to the European Single Market were some examples of how the Spanish skillfully managed adversities.
1.5. Growth Accounting Results
Besides the analysis of the political and socioeconomic context and the performance of key macroeconomic indicators, the decomposition of the observed growth in output per capita into the contributions of factor inputs and technological change adds depth to our understanding of the Iberian experiences. The estimates proposed in this section are mostly grounded on the growth accounting methodology developed in Bergoing et al. (2002) and Hayashi and Prescott (2002), as described in sections 1.2. and 1.3. The discussion starts by identifying periods of fundamental changes in the economic structure of Portugal and Spain based on the political and
socioeconomic background and the corroborating view of others, followed by the presentation of the growth accounting results for each of the four scenarios delineated in the previous section.
1.5.1. Regime Changes
Regime changes occur when there are fundamental changes in the modus operandi of a given economy.12 These can be motivated by different events such as profound changes in regulation, radical fiscal and monetary reforms, democratization, technological shocks, military conflict, natural disasters, etc., all of which have the potential to significantly alter the pattern of economic behavior.
The political and socioeconomic history and macroeconomic indicators of the Iberian economies point to four regime changes during the 1950-2004 period for each country. The first relevant change occurred in 1960 when Portugal adopted a policy of progressive opening of its economy to the world while Spain implemented highly protectionist tariffs and deepened its focus on import substitution and industrialization of the economic base. Despite the different economic outlooks, both countries experienced an extraordinary period of growth which became known as the Iberian golden years. Another radical change was prompted by the democratization process and its social and economic repercussions. However, these happened in different years for each country. For Portugal the regime change came in 1974 while for Spain it began in 1975.
Later on, both countries joined the European Community in 1986 and submitted themselves to radical reforms, either through market liberalization policies or major infrastructure projects subsidized by European structural funds. The process continued
12
throughout the 1990s and more significant changes were yet to come. The 1994 adhesion to the European Single Market and European Union sustained another regime change since it exposed domestic firms to an unprecedented exposure to international competition and severely constrained fiscal and monetary policy in order to join the Eurozone.
The regime changes just delineated are supported by the analysis of other researchers. Lopes (2004a) defines the period 1960-1973 as the Portuguese golden years and Blakanoff (1992) concludes that the 1974 Portuguese revolution marked the end of the exceptionally rapid economic growth and structural change initiated in 1960. Tortella (2000) argues that 1960 was the beginning of an extraordinary growth period in Spain. Cheung and Chinn (1996), Fulvio (2001), and Escosura e Roses (2007), found that in 1975 there is a statistically significant break in the Spanish growth trend. Lopes (2004a) identifies the period 1986-94 as a complete business cycle for the Portuguese economy. Jimeno et al. (2006) point to 1986 as the year when there was a structural break in Spanish labor productivity growth, using a Sup-Wald test. Finally, Gunther et al. (2004) state that the Spanish economic expansion of the late 1980s came to an abrupt end by 1994 and was then followed by a strong recovery based on fiscal reform and an influx of structural investment funds from the EU (2004).
Having identified four major regime changes in Spain and Portugal between 1950 and 2004, the next task is to answer the following question: did the disparities in growth between Portugal and Spain arise mostly due to differences in the paths for factor inputs - like capital and labor - or due to differences in TFP?
1.5.2. Growth Accounting Results with Linear Capital Accumulation
The growth accounting exercises provide estimates based on the methodology outlined in Section 1.2. and 1.3, the four scenarios outlined in Section 1.4, and the four regime changes just delineated. We being our analysis with two simulations which focus on the case when capital accumulates in a linear fashion, i.e. Kt+1 =(1t −
δ
)Kt −It. The sensitivity of the results is assessed by setting the capital depreciation rate, δ , at 5 and 10 percent, respectively.Table 1.A shows the growth accounting estimates computed using equation (1.2) and assuming linear capital accumulation with a 5 percent depreciation rate.
Table 1.A Growth Accounting Estimates (δ = 5%; linear capital accumulation)
Country Time Period %∆(Y/N) Due to TFP Due to K/Y Due to L/N
Portugal 1950-1959 4.11 5.97 -0.81 -1.05 1960-1973 7.01 6.86 -0.06 0.21 1974-1985 1.5313 1.17 0.91 -0.55 1986-1993 2.51 1.24 0.24 1.03 1994-2004 2.02 0.36 0.90 0.76 1950-2004 3.95 3.55 0.24 0.16 Spain 1950-1959 4.16 4.33 0.58 -0.75 1960-1974 5.65 5.05 0.56 0.04 1975-1985 1.58 3.25 0.81 -2.48 1986-1993 2.09 1.42 0.41 0.26 1994-2004 2.28 -0.39 0.13 2.53 1950-2004 3.61 3.28 0.51 -0.18
The first thing to note is that the calculations in the third column (%∆(Y/N)) and fifth column (Due to L/N ) do not depend on the capital motion assumptions and thus hold no matter
13
Even though the Carnation Revolution was in April 25th 1974, GDP per capita only shrunk significantly by 1975. Consequently, if we were to compare the Iberian growth rates in output per capita during the same 1975-1985 period, the growth rate in Portugal would have been 2.50 percent, which is significantly higher than the 1.58 percent rate experienced in Spain over the same time interval.
which structure for computing capital is applied. We begin by focusing on these two columns. Column three indicates that output per capita grew at an average annual rate of 3.95 percent in Portugal and 3.61 percent in Spain, hence suggesting convergence in output per capita levels among the Iberians over the entire 55-year period. Moreover, the estimates also corroborate the extraordinary growth experienced during the golden years and that Portugal grew significantly more than Spain over that period, attaining an average annual growth rate 24 percent higher than Spain. The democratization turmoil, energy shocks, and currency crises of the 1970s were quite expensive for both countries, with Portugal and Spain growing at a much slower, though similar, pace until the European Community adhesion. Additionally, the output per capita growth rates also support the argument that Spain was better prepared for the European Single Market challenges than Portugal. Whereas Portugal grew relatively faster during the 1986-1993, once both countries joined the single market, Spain was able to grow at an annual average rate that was 13 percent higher than Portugal.
Column five presents the estimates for the labor contribution toward the growth rate in output per capita. On average, for the entire 1950-2004 period, the contribution of labor was rather small in Portugal, and for Spain it ended up being a deterrent. Actually, during the 1950s, labor inhibited growth in both countries and it was relatively more problematic in Portugal since the employment rate was somewhat higher in Spain. During the golden years, labor had a positive contribution to the growth rate in output per capita though rather small, particularly in Spain. This relative performance might have been distorted by the massive emigration of Portuguese citizens during this period which contracted the labor force and disguised unemployment. The democratization process of the mid 1970s along with several adverse shocks also afflicted the Iberian workers, especially the Spaniards. As observed in Figure 1.B,
the unemployment rate increased dramatically in Spain since the transition to democracy until the European Community adhesion, whereas in Portugal it was fairly stagnant during the same period.
In the 1986-1993 period labor played a role in the upswing of the average output per capita growth rate, even though it was more relevant in Portugal than in Spain. This fact is consistent with the relative lower unemployment rates in Portugal as well as with its flatter employment curve (Figure 1.B) during this period. Major changes occurred after the adhesion to the European Single Market. Labor became the key engine of growth for the Spanish economy. Even though our accounting methodology does not explicitly takes into consideration the role of labor efficiency, this change might be associated with the 1982-1994 boom in education (Appendix A) and resulting increased ability of the Spanish workers to compete with their European counterparts, and especially against the Portuguese workers. In fact, between 1993 and 2003, only 10 percent of the Portuguese labor force had tertiary education whereas in Spain this share accounted for 24 percent (WDI, 2006).
We now turn to the more uncertain results which are tied to the capital construction approach. The capital construction approach not only impacts the capital-output ratio, but it will also impact the Solow residual (i.e. TFP). If the capital accumulation process is linear and the true depreciation rate is 5 percent, then the adopted methodology indicates that during the overall period TFP was significantly more important than the factor inputs, and it grew relatively faster in Portugal than in Spain.14 Between 1950 and 2004, the estimated average growth rate for TFP was 3.55 percent in Portugal and 3.28 percent in Spain, accounting for about 90 percent of each
14
country’s average annual change in output per capita. Moreover, TFP was the main driver of growth in each time interval under consideration, except for the 1993-2004 period.
In relation to the contribution of capital, the numerical experiment indicates that on average it was more relevant in Spain than in Portugal, growing at an average annual rate of 0.51 and 0.24 percent, respectively. Moreover, the results also suggest that Franco was more successful than Salazar in capitalizing the economy. During the early years of democracy, Portugal recovered some ground but fell short again during the 1986-1993 period. Given that both countries received significant structural funds from the European Community in the latter period, it seems that the Spanish were able to implement those projects more efficiently. However, in recent years the contribution of capital toward output per capita has been higher in Portugal than in Spain.
Table 1.B summarizes the results for a 10 percent depreciation rate under the same linear motion of capital formulation. The higher depreciation rate reduces the capital contributions to per capita output, and actually makes its average negative in Portugal for the overall period.
Table 1.B Growth Accounting (δ = 10%; linear investment function)
Country Time Period %∆(Y/N) Due to TFP Due to K/Y Due to L/N
Portugal 1950-1959 4.11 7.32 -2.16 -1.05 1960-1973 7.01 6.89 -0.09 0.21 1974-1985 1.53 1.45 0.63 -0.55 1986-1993 2.51 1.18 0.30 1.03 1994-2004 2.02 0.34 0.92 0.76 1950-2004 3.95 3.88 -0.09 0.16 Spain 1950-1959 4.16 5.42 -0.51 -0.75 1960-1974 5.65 5.14 0.46 0.04 1975-1985 1.58 3.74 0.32 -2.48 1986-1993 2.09 1.36 0.47 0.26 1994-2004 2.28 -0.40 0.15 2.53