Calhoun: The NPS Institutional Archive
Theses and Dissertations Thesis and Dissertation Collection
2016-12
Financial health indicators: an analysis of
financial statement information to determine
the financial health of DoD contractors
Grant, Timothy J.
Monterey, California: Naval Postgraduate School
NAVAL
POSTGRADUATE
SCHOOL
MONTEREY, CALIFORNIA
MBA PROFESSIONAL REPORT
FINANCIAL HEALTH INDICATORS: AN ANALYSIS OF FINANCIAL STATEMENT INFORMATION TO DETERMINE THE FINANCIAL
HEALTH OF DOD CONTRACTORS
December 2016
By:
Timothy J. Grant
Tony L. Ingram
Darnell D. Deas
Advisors: Juanita M. RendonSteven P. Landry
REPORT DOCUMENTATION PAGE Form Approved OMB No. 0704-0188
Public reporting burden for this collection of information is estimated to average 1 hour per response, including the time for reviewing instruction, searching existing data sources, gathering and maintaining the data needed, and completing and reviewing the collection of information. Send comments regarding this burden estimate or any other aspect of this collection of information, including suggestions for reducing this burden, to Washington headquarters Services, Directorate for Information Operations and Reports, 1215 Jefferson Davis Highway, Suite 1204, Arlington, VA 22202-4302, and to the Office of Management and Budget, Paperwork Reduction Project (0704-0188) Washington DC 20503.
1. AGENCY USE ONLY (Leave blank)
2. REPORT DATE
December 2016
3. REPORT TYPE AND DATES COVERED
MBA professional report
4. TITLE AND SUBTITLE
FINANCIAL HEALTH INDICATORS:
AN ANALYSIS OF FINANCIAL STATEMENT INFORMATION TO DETERMINE THE FINANCIAL HEALTH OF DOD CONTRACTORS
5. FUNDING NUMBERS
6. AUTHOR(S) Timothy J. Grant, Tony L. Ingram, and Darnell D. Deas
7. PERFORMING ORGANIZATION NAME(S) AND ADDRESS(ES)
Naval Postgraduate School Monterey, CA 93943-5000
8. PERFORMING
ORGANIZATION REPORT NUMBER
9. SPONSORING /MONITORING AGENCY NAME(S) AND ADDRESS(ES)
N/A
10. SPONSORING / MONITORING AGENCY REPORT NUMBER
11. SUPPLEMENTARY NOTES The views expressed in this thesis are those of the author and do not reflect the official policy or position of the Department of Defense or the U.S. Government. IRB number N/A .
12a. DISTRIBUTION / AVAILABILITY STATEMENT
Approved for public release. Distribution is unlimited.
12b. DISTRIBUTION CODE 13. ABSTRACT (maximum 200 words)
Prior to awarding a contract, government contracting officers must be able to determine the financial health of prospective contractors. In fact, according to the Federal Acquisition Regulation (FAR) 9.104-1(a), the very first general requirement to being considered a “responsible” prospective contractor is to show “adequate financial resources to perform the contract or the ability to obtain financing.”
The purpose of this research is to identify a financial assessment framework that could assist DOD contracting officers with determining the financial health of potential DOD contractors. This research study may help DOD contracting officers determine the financial health of potential contractors prior to awarding a contract.
The findings of this study provide a recommended framework that a contracting officer could follow in order to assess the financial health of a prospective contractor. The framework includes a ratio analysis using selected ratios compiled by this study, as well as a comparative analysis using industry average driven data. The framework also incorporates horizontal and vertical analyses, as well as bankruptcy and fraud analyses. The financial assessment framework created in this study is a comprehensive financial health assessment tool that can be utilized by DOD contracting officers.
14. SUBJECT TERMS
financial health, procurement fraud, determinants, financial ratios, Z-score, profitability
15. NUMBER OF PAGES 177 16. PRICE CODE 17. SECURITY CLASSIFICATION OF REPORT Unclassified 18. SECURITY CLASSIFICATION OF THIS PAGE Unclassified 19. SECURITY CLASSIFICATION OF ABSTRACT Unclassified 20. LIMITATION OF ABSTRACT UU
NSN 7540-01-280-5500 Standard Form 298 (Rev. 2-89)
Approved for public release. Distribution is unlimited.
FINANCIAL HEALTH INDICATORS:
AN ANALYSIS OF FINANCIAL STATEMENT INFORMATION TO DETERMINE THE FINANCIAL HEALTH OF DOD CONTRACTORS
Timothy J. Grant, Lieutenant Commander, United States Navy Tony L. Ingram, Lieutenant, United States Navy
Darnell D. Deas, Lieutenant, United States Navy
Submitted in partial fulfillment of the requirements for the degree of
MASTER OF BUSINESS ADMINISTRATION
from the
NAVAL POSTGRADUATE SCHOOL December 2016
Approved by: Juanita M. Rendon
Steven P. Landry
Don Summers Academic Associate
FINANCIAL HEALTH INDICATORS:
AN ANALYSIS OF FINANCIAL STATEMENT INFORMATION
TO DETERMINE THE FINANCIAL HEALTH OF DOD
CONTRACTORS
ABSTRACT
Prior to awarding a contract, government contracting officers must be able to determine the financial health of prospective contractors. In fact, according to the Federal Acquisition Regulation (FAR) 9.104-1(a), the very first general requirement to being considered a “responsible” prospective contractor is to show “adequate financial resources to perform the contract or the ability to obtain financing.”
The purpose of this research is to identify a financial assessment framework that could assist DOD contracting officers with determining the financial health of potential DOD contractors. This research study may help DOD contracting officers determine the financial health of potential contractors prior to awarding a contract.
The findings of this study provide a recommended framework that a contracting officer could follow in order to assess the financial health of a prospective contractor. The framework includes a ratio analysis using selected ratios compiled by this study, as well as a comparative analysis using industry average driven data. The framework also incorporates horizontal and vertical analyses, as well as bankruptcy and fraud analyses. The financial assessment framework created in this study is a comprehensive financial health assessment tool that can be utilized by DOD contracting officers.
TABLE OF CONTENTS
I. INTRODUCTION...1 A. BACKGROUND ...1 B. PURPOSE OF RESEARCH ...2 C. RESEARCH QUESTIONS ...2 D. METHODOLOGY ...3 E. IMPORTANCE OF RESEARCH ...3 F. ORGANIZATION OF REPORT ...3 G. SUMMARY ...4II. LITERATURE REVIEW ...5
A. INTRODUCTION...5
1. Importance of General Financial Reporting ...5
2. Department of Defense (DOD) Contracting Phases ...9
3. Procurement Fraud ...10
B. HISTORY OF FRAUD IN FINANCIAL REPORTING ...11
C. THE FRAUD TRIANGLE AND DOD POLICY ...12
D. FRAUD BEHAVIOR IN FINANCIAL REPORTING ...13
1. Industry Averages and Warning Signs of Fraudulent Behavior ...14
2. Board of Directors’ Composition Influence on Fraudulent Behavior ...16
E. FINANCIAL HEALTH DETERMINANTS ...17
1. Inventory ...18 2. Accounts Receivable ...18 3. Net Income ...18 4. Working Capital...19 5. Sales Activity ...19 6. Fixed Assets ...19 7. Operating Environment ...19
F. FINANCIAL RATIO ANALYSIS FROM FINANCIAL STATEMENTS ...20
1. Financial Statement Analysis ...20
G. FINANCIAL STATEMENT RATIO CATEGORIES ...25
2. Advantages and Disadvantages of Financial Ratios Used to Determine the Financial Health of a Company ...30
H. COMPARATIVE ANALYSIS ...32
J. VERTICAL ANALYSIS ...35
K. LIMITATIONS OF FINANCIAL STATEMENT ANALYSIS ...36
L. MULTIVARIATE ANALYSIS ...37 M. SUMMARY ...41 III. METHODOLOGY ...43 A. INTRODUCTION...43 B. STEPS ...43 C. FRAUD BEHAVIORS...43 D. SAMPLE SELECTION...44
E. PROCESS USED TO ANALYZE DATA ...45
F. SUMMARY ...45
IV. FINDINGS ...47
A. INTRODUCTION...47
B. SAMPLE SELECTION...47
C. MOST COMMONLY USED RATIOS SELECTED FOR DETERMINING THE FINANCIAL HEALTH OF A COMPANY ...48 D. HORIZONTAL ANALYSIS ...55 E. VERTICAL ANALYSIS ...56 F. BANKRUPTCY ANALYSIS ...58 G. FRAUD ANALYSIS ...62 H. BOARD COMPOSITION ...65 I. SUMMARY ...66
V. ANALYSIS AND RECOMMENDATIONS BASED ON ANALYSIS ...69
A. INTRODUCTION...69
B. UPS’S FINANCIAL ANALYSIS ...69
1. Ratio Analysis ...69
2. Horizontal Analysis ...78
3. Vertical Analysis ...81
4. Bankruptcy Analysis ...84
5. Fraud Analysis ...85
C. DELTA AIRLINES’ FINANCIAL ANALYSIS ...86
1. Ratio Analysis ...87
2. Horizontal Analysis ...95
3. Vertical Analysis ...99
4. Bankruptcy Analysis ...102
D. LOCKHEED MARTIN’S FINANCIAL ANALYSIS ... 104 1. Ratio Analysis ... 104 2. Horizontal Analysis ... 113 3. Vertical Analysis ... 117 4. Bankruptcy Analysis ... 121 5. Fraud Analysis ... 122
E. IMPLICATIONS AND LIMITATIONS ... 123
F. RECOMMENDATIONS BASED ON ANALYSIS ... 129
G. SUMMARY ... 132
VI. SUMMARY, CONCLUSIONS, AND AREAS FOR FURTHER RESEARCH ...133
A. CONCLUSION ... 134
B. RESEARCH QUESTIONS ... 134
C. AREAS FOR FURTHER RESEARCH ... 137
APPENDIX ... 139
LIST OF REFERENCES ... 149
LIST OF FIGURES
Figure 1. Balance Sheet Example. Source: Walther (2016). ...6
Figure 2. Income Statement Example. Source: Walther (2016). ...7
Figure 3. Statement of Cash Flows Example. Source: Walther (2016). ...8
Figure 4. Statement of Retained Earnings Example. Source: Walther (2016). ...8
Figure 5. Fraud Triangle. Source: Lucrum Consulting (n.d.)...12
Figure 6. Comparative Balance Sheet Example. Source: Revsine et al. (2002). ...33
Figure 7. Horizontal Analysis Example. Source: Revsine et al. (2002). ...34
Figure 8. Vertical Analysis Example. Source: Revsine et al. (2002). ...35
Figure 9. Original Z-Score Formula for Bankruptcy Detection. Source: Altman (1968). ...59
Figure 10. Simplified Z-Score Formula for Bankruptcy Detection. Source: Altman (2000). ...59
Figure 11. New Z”-Score Formula for Bankruptcy Detection. Source: Gates (1993). ...61
Figure 12. M-Score Formula for Fraud Detection. Source: Beneish et al. (2013). ...63
Figure 13. M-Score Fraud Ratios Explained. Source: Beneish et al. (2013). ...64
Figure 14. UPS’s Trend Analysis—Quick Ratio versus Industry Average. ...71
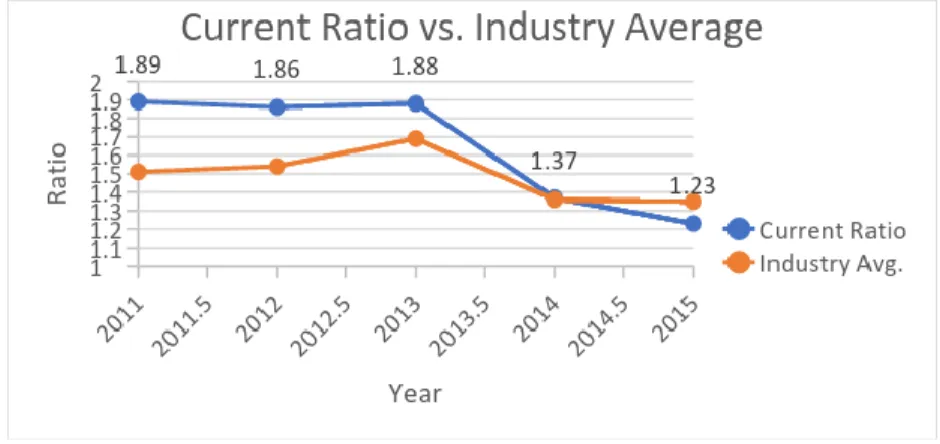
Figure 15. UPS’s Current Ratio versus Industry Average Trend Analysis. ...71
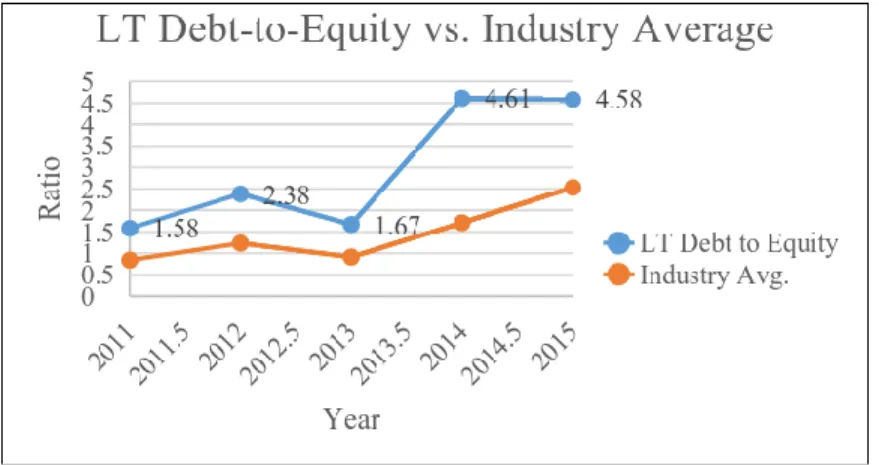
Figure 16. UPS’s LT Debt-to-Equity Ratio versus Industry Average Trend Analysis...73
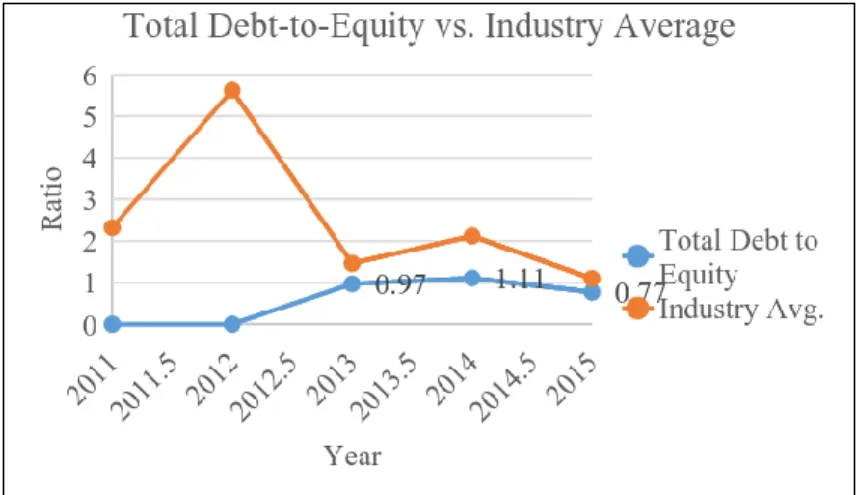
Figure 17. UPS’s Total Debt-to-Equity Ratio versus Industry Average Trend Analysis...73
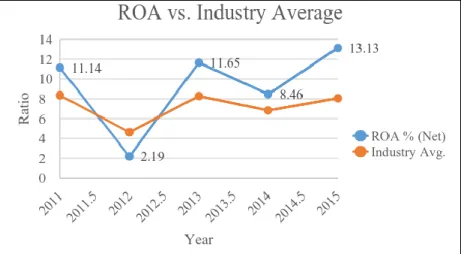
Figure 18. UPS’s Return on Assets Ratio versus Industry Average Trend Analysis...75
Figure 19. UPS’s Return on Equity Ratio versus Industry Average Trend Analysis...75
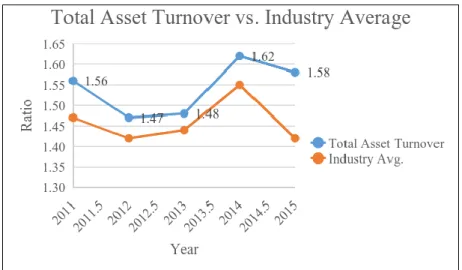
Figure 20. UPS’s Total Asset Turnover Ratio versus Industry Average Trend
Analysis...77
Figure 21. UPS’s Inventory Turnover Ratio versus Industry Average Trend Analysis...77
Figure 22. UPS’s Balance Sheet Horizontal Analysis. ...79
Figure 23. UPS’s Income Statement Horizontal Analysis. ...80
Figure 24. UPS’s Statement of Cash Flows Horizontal Analysis. ...81
Figure 25. UPS’s Balance Sheet Vertical Analysis. ...82
Figure 26. UPS’s Income Statement Vertical Analysis. ...83
Figure 27. UPS’s Statement of Cash Flows Vertical Analysis. ...84
Figure 28. Delta’s Quick Ratio versus Industry Average Trend Analysis. ...88
Figure 29. Delta’s Current Ratio versus Industry Average Trend Analysis. ...89
Figure 30. Delta’s LT Debt-to Equity Ratio versus Industry Average Trend Analysis...90
Figure 31. Delta’s Total Debt-to Equity Ratio versus Industry Average Trend Analysis...91
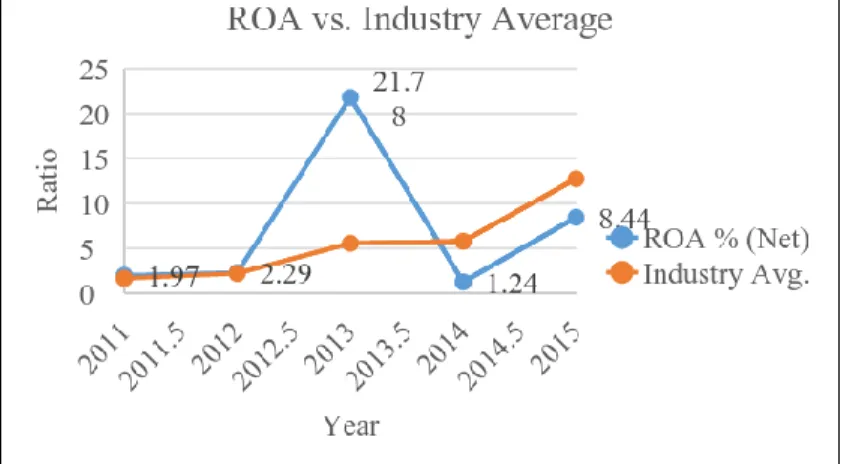
Figure 32. Delta’s Return on Assets Ratio versus Industry Average Trend Analysis...92
Figure 33. Delta’s Return on Equity Ratio versus Industry Average Trend Analysis...93
Figure 34. Delta’s Total Asset Turnover Ratio versus Industry Average Trend Analysis...94
Figure 35. Delta’s Inventory Turnover Ratio versus Industry Average Trend Analysis...95
Figure 36. Delta Airlines’ Balance Sheet Horizontal Analysis. ...97
Figure 37. Delta Airlines’ Income Statement Horizontal Analysis...98
Figure 38. Delta Airlines’ Statement of Cash Flows Horizontal Analysis. ...99
Figure 40. Delta Airlines’ Income Statement Vertical Analysis. ...101
Figure 41. Delta Airlines’ Statement of Cash Flows Vertical Analysis. ...102
Figure 42. Lockheed Martin’s Quick Ratio versus Industry Average Trend Analysis...106
Figure 43. Lockheed Martin’s Current Ratio versus Industry Average Trend Analysis...107
Figure 44. Lockheed Martin’s LT Debt-to-Equity Ratio versus Industry Average Trend Analysis. ...108
Figure 45. Lockheed Martin Total Debt-to Equity Ratio versus Industry Average Trend Analysis. ...109
Figure 46. Lockheed’s Inventory Turnover Ratio versus Industry Average Trend Analysis. ...110
Figure 47. Lockheed’s Inventory Turnover Ratio versus Industry Average Trend Analysis. ...111
Figure 48. Lockheed Martin’s Inventory Turnover Ratio versus Industry Average Trend Analysis. ...112
Figure 49. Lockheed’s Inventory Turnover Ratio versus Industry Average Trend Analysis. ...113
Figure 50. Lockheed Martin’s Balance Sheet Horizontal Analysis. ...115
Figure 51. Lockheed Martin’s Income Statement Horizontal Analysis. ...116
Figure 52. Lockheed Martin’s Statement of Cash Flows Horizontal Analysis. ...117
Figure 53. Lockheed Martin’s Balance Sheet Vertical Analysis. ...119
Figure 54. Lockheed Martin’s Income Statement Vertical Analysis. ...120
Figure 55. Lockheed Martin’s Statement of Cash Flows Vertical Analysis. ...121
LIST OF TABLES
Table 1. Map of Financial Statement Analysis. Adapted from Temte (2015). ...21
Table 2. Balance Sheet Description for Ratio Analysis. Adapted from Gates (2012). ...24
Table 3. Commonly Used Income Statement Financial Ratios. Adapted from Rist & Pizzica (2015). ...24
Table 4. Cash Flow Statement Financial Ratios. Adapted from Rist & Pizzica (2015). ...25
Table 5. Commonly Used Short-Term Solvency Financial Ratios. Adapted from Rist & Pizzica (2015). ...26
Table 6. Commonly Used Long-Term Solvency Financial Ratios. Adapted from Rist & Pizzica (2015). ...27
Table 7. Commonly Used Profitability Financial Ratios. Adapted from Rist & Pizzica (2015). ...28
Table 8. Commonly Used Efficiency (Turnover) Financial Ratios. Adapted from Rist & Pizzica (2015). ...29
Table 9. Commonly Used Financial Ratios to Detect Fraud. Adapted from Gee (2015). ...30
Table 10. Common Short-Term Liquidity Ratios. Adapted from Rist & Pizzica (2015). ...50
Table 11. Common Long-Term Solvency Ratios. Adapted from Rist & Pizzica (2015). ...52
Table 12. Common Profitability Ratios. Adapted from Rist & Pizzica (2015). ...53
Table 13. Efficiency (Turnover). Adapted from Rist & Pizzica (2015). ...55
Table 14. Example Horizontal Analysis of Lockheed Martin Corp. ...56
Table 15. Example Vertical Analysis of Lockheed Martin Corp. ...58
Table 16. Financial Statement Reference for Z-Score Bankruptcy Model ...60
Table 18. New Z”-Score Summary of Selected Companies. ...62
Table 19. Financial Statement Reference for M-Score Fraud Model. ...64
Table 20. M-Score Summary of Selected Companies. ...65
Table 21. Summary of Board Composition. ...66
Table 22. Analysis of UPS’s Financial Statements. Adapted from Mergent Online (n.d.) ...70
Table 23. Solvency Ratio Analysis of UPS’s Financial Statements. Adapted from Mergent Online (n.d.) ...72
Table 24. Profitability Ratio Analysis of UPS’s Financial Statements. Adapted from Mergent Online (n.d.). ...74
Table 25. Efficiency Ratio Analysis of UPS’s Financial Statements. Adapted from Mergent Online (n.d.). ...76
Table 26. Horizontal Analysis of UPS’s Financial Statements. ...78
Table 27. Vertical Analysis of UPS’s Financial Statements. ...82
Table 28. UPS’s Bankruptcy Analysis. ...85
Table 29. UPS’s Fraud Analysis. ...86
Table 30. Liquidity Ratio Analysis of Delta Air Lines Financial Statements. Adapted from (Mergent Online, n.d.). ...87
Table 31. Solvency Ratio Analysis of Delta Air Lines Financial Statements. Adapted from Mergent Online (n.d.) ...89
Table 32. Profitability Ratio Analysis of Delta Air Lines Financial Statements. Adapted from Mergent Online (n.d.) ...91
Table 33. Efficiency Ratio Analysis of Delta Air Lines Financial Statements. Adapted from Mergent Online (n.d.) ...93
Table 34. Horizontal Analysis of Delta Airlines’ Financial Statements. ...96
Table 35. Vertical Analysis of Delta Airlines’ Financial Statements. ...100
Table 36. Delta Airlines’ Bankruptcy Analysis. ...103
Table 38. Liquidity Ratio Analysis of Lockheed Martin’s Financial Statements.
Adapted from Mergent Online (n.d.) ...105
Table 39. Solvency Ratio Analysis of Lockheed Martin’s Financial Statements. Adapted from Mergent Online (n.d.) ...107
Table 40. Profitability Ratio Analysis of Lockheed Martin’s Financial Statements. Adapted from Mergent Online (n.d.) ...109
Table 41. Efficiency Ratio Analysis of Lockheed Martin’s Financial Statements. Adapted from Mergent Online (n.d.) ...111
Table 42. Horizontal Analysis of Lockheed Martin’s Financial Statements. ...114
Table 43. Vertical Analysis of Lockheed Martin’s Financial Statements. ...118
Table 44. Lockheed Martin’s Bankruptcy Analysis. ...122
Table 45. Lockheed Martin’s Fraud Analysis. ...123
Table 46. Summary of Selected Financial Ratios. ...130
LIST OF ACRONYMS AND ABBREVIATIONS
AICPA American Institute of Certified Public Accountants CCC Cash Conversion Cycle
CEO Chief Executive Officer CFO Chief Financial Officer COGS Cost of Goods Sold
COSO Committee of Sponsoring Organizations DOD Department of Defense
FAR Federal Acquisition Regulations
GAAP Generally Accepted Accounting Principles GMI Gross Margin Index
LT Long-Term
ROA Return on Assets
ROE Return on Equity
ROI Return on Investment RONA Return on Net Assets
SEC Securities Exchange Commission SGA Sales, General, and Administration
SGAI Selling, General, and Administration Index UPS United Parcel Service
I.
INTRODUCTION
A. BACKGROUND
The Department of Defense (DOD) spends billions of American taxpayer dollars annually to support programs that are designed to increase warfighter capabilities. DOD should fulfill demands of the end user by identifying strategic gaps and capabilities. In part, this may be done by ensuring the most efficient and technologically sound equipment will reach the warfighter in order to meet the mission in support of national security. With improper business contracting practices and personal conflicts of interest rising, DOD leaders are starting to reassess how government contracting is conducted (Schwartz & Church, 2013). There has been an increase in federal investigations of government contracts in the Pacific areas of operations with the more notable scandals committed by upper Naval leadership affiliated with the Glenn Defense and Marine Scandal (Defense News, 2016). It is imperative that the DOD research and determine a method of awarding contracts to help avoid scandals. This can be done by thoroughly researching and identifying potential contractors who are deemed financially capable of conducting business with the DOD.
Prior to awarding contracts, government contracting officers must be able to determine the financial health of prospective contractors. In fact, according to the Federal Acquisition Regulation (FAR), the very first general requirement to be considered a “responsible” prospective contractor is to show “adequate financial resources to perform the contract, or the ability to obtain financing” (2016, 9.104-1(a)). The objective of this research is to place an emphasis on key financial factors that will aid DOD contracting officers in determining a prospective contractor’s financial health. Financial health is just one facet of the overall broad assessment of a contractor.
The incentive to commit fraud may be high for a prospective contractor, particularly to alter financial statements to appear financially healthy and to appear to be a responsible contractor in order to be awarded a government contract (Wolfe & Hermanson, 2004). To aid the DOD, contracting offices need to employ a more
systematic approach to identify financial issues with contractors before contractors are in a position to take improper advantage of DOD programs and misuse U.S. taxpayers’ dollars. Merely providing more training to contracting officers and upper leadership may not be the best answer to this contracting problem of potential fraud activities. There needs to be a more defined internal control process within the DOD, such as processes that measure the liquidity or financial health of contractors to whom DOD awards contracts. Utilizing the fraud triangle framework and other key financial ratio analysis tools, the DOD contracting officers may be able to determine if there are any early fraud indicators.
B. PURPOSE OF RESEARCH
The purpose of this research is to identify a financial assessment framework that could assist DOD contracting officers with determining the financial health of potential DOD contractors. This research study may help DOD contracting officers determine the financial health of potential contractors prior to awarding a contract. This study will compile a set of up-to-date financial analysis tools, which if made available to contracting officers, could serve to complement an assessment of the financial health of prospective DOD contractors.
C. RESEARCH QUESTIONS
The following research questions will be addressed in this research study: 1. What financial statement ratios can be used to determine the financial
health of a DOD contractor?
2. What financial health indicators can be determined from the balance sheets, income statements, and statements of cash flows of DOD contractors?
3. What particular financial indicators may signal red flags to a DOD contracting officer regarding a potential DOD contractor’s financial health?
4. What factors should be taken into consideration that would indicate publicly traded companies might be engaged in inappropriate behavior to appear financially healthy?
D. METHODOLOGY
This research follows a four-step logical progression from start to finish, which will be discussed in Chapter III. The first step is to conduct a literature review focusing on the research questions posed by this study in Chapter I and addressed in Chapter II. The second step is to take the information from step one and apply it toward determining or identifying financial statement health indicators as part of a financial statement analysis which includes ratio analysis, bankruptcy analysis, and fraud analysis. The third step is to select a sample of DOD contractors from a pool of all DOD prime recipient contractors. The sample consists of publicly traded companies from various industries and contract sizes. The fourth and final step is to collect financial statement information from the sample of DOD contractors and conduct a financial analysis based on the research criteria determined from step two. The objective is to determine the appropriate financial assessment framework that can be used to assess the financial health of DOD contractors.
E. IMPORTANCE OF RESEARCH
The importance of this research study is to provide a financial assessment framework that DOD contracting officers can use to assess the financial health of contractors prior to awarding a contract. Faced with multiple potential contractors, contracting officers may use the framework to focus on contractors with better financial ability to meet DOD requirements.
F. ORGANIZATION OF REPORT
This research study consists of six chapters, including this introduction, which is designed to introduce the research and identify the research questions. Chapter II includes a literature review, which provides the basis for the financial analysis in Chapter V. Chapter III details the methodology used to identify the sample of DOD contractors and the analysis of their financial information. Chapter IV discusses the findings, which includes the selected ratios based on the literature review. Chapter V consists of the analysis, implications and limitations, as well as recommendations based on the analysis. Finally, Chapter VI provides a summary, conclusions, and areas for further research.
G. SUMMARY
The DOD depends on contractors to provide a service or product in order to fulfill strategic requirements. The purpose of this research is to identify a financial assessment framework that could assist DOD contracting officers with determining the financial health of potential DOD contractors. This chapter proposed four research questions and provided a logical methodology to address each question. Additionally, this chapter concluded with a discussion on the importance of this research and presented a brief organization of the report. The next chapter is a literature review, which includes a background in financial reporting and financial health, a history of fraud in financial reporting, fraud triangle, financial ratio analysis using financial statements, and a description of horizontal, vertical, and multivariate analyses.
II.
LITERATURE REVIEW
A. INTRODUCTION
This chapter provides a literature review to establish a foundational knowledge regarding a financial assessment framework that could assist DOD contracting officers with determining the financial health of potential DOD contractors. The importance of general financial reporting is introduced to provide an overview of financial statements, including income statements, balance sheets, statements of retained earnings, and statements of cash flows. This chapter also includes an overview of DOD contracting phases and the importance of contractor financial responsibility. Procurement fraud is also discussed. The history of fraud in financial reporting provides a foundation of ratios that can help deter fraud. This study further explains the fraud triangle applied to contractors, fraud behavior in financial reporting as it relates to ratios, and the board of directors relationship as it relates to influencing fraudulent activity within a company. This research study uses various types of financial analysis including ratio analyses and horizontal, vertical, and multivariate analyses. Within the multivariate analysis, Dr. Altman’s Z-score for bankruptcy analysis and Dr. Beneish’s M-score for fraud indicators are explained.
1. Importance of General Financial Reporting
Financial reporting provides decision-makers with useful information. In financial reporting, accountants use Generally Accepted Accounting Principles (GAAP) to record the financial transaction of a company and to prepare financial statements. GAAP are rules and guidelines that govern a company’s way of reporting financial data. The reports included in financial reporting are the balance sheet, income statement, statement of cash flows, and statement of retained earnings. The following sections provide basic descriptions of the major financial reporting statements in accordance with the principles of accounting.
a. Balance Sheet
The elements of the balance sheet consists of a company’s assets, liabilities, and shareholders’ equity (Figure 1). The purpose of the balance sheet is to provide users with a snapshot of the company's financial position.
Figure 1. Balance Sheet Example. Source: Walther (2016).
b. Income Statement
A company states its profits and losses during a particular period on the income statement (Figure 2). An income statement, also known as profit and loss statement or earnings statement, represents the financial earnings performance of a company.
Figure 2. Income Statement Example. Source: Walther (2016).
c. Statement of Cash Flows
All cash inflows and cash outflows of the company appear on the statement of cash flows (Figure 3). The operating, investing, and financing sections of the statement of cash flows provide information regarding the cash transactions of a company, which results in the net change of cash during a period (Averkamp, 2016).
Averkamp (2016) states that the operating section converts the items reported on the income statement from the accrual basis of accounting to the cash basis of accounting. Under the accrual basis of accounting, revenues are reported on the income statement when they are earned, and expenses are reported when they are incurred. Investing section reports any cash transaction involving the buying and selling of long-term assets and investments (Averkamp, 2016). The financing section reports any cash transactions that touch either creditors or shareholders such as dividends, long-term loans, and principal loan repayments (Averkamp, 2016).
Figure 3. Statement of Cash Flows Example. Source: Walther (2016).
d. Statement of Retained Earnings
The statement of retained earnings is a financial statement that shows the accumulated earnings as well as dividend distributions. Averkamp (2016) describes retained earnings as ending retained earnings from the previous year plus current net income minus dividends distributed to shareholders by the company (Figure 4).
2. Department of Defense (DOD) Contracting Phases
The DOD contracting process can be very complicated. The following sections briefly describe the six phases of contracting used in the DOD process and how they relate to the contracting officer’s responsibilities.
a. Phase I – Procurement Planning
Planning and forecasting is the process identified in this phase in order to meet organizational needs. In accordance with Rendon and Rendon (2016) “this process involves determining whether to procure, how to procure, what to procure, how much to procure, and when to procure” (p. 756). Some examples of the procurement planning process activities include such things as an outsource analysis and the determination of the procurement requirement (Rendon & Rendon, 2016). The contracting officer is not involved in this phase.
b. Phase II – Solicitation Planning
The contracting documents are prepared in the solicitation planning phase of the contracting process. Rendon and Rendon (2016) note that solicitation planning involves “documenting program requirements, selecting contract type and contract award strategy, and identifying potential sources of suppliers” (p. 756). The contracting officer is not involved in this phase.
c. Phase III – Solicitation
In the solicitation phase, the organization is seeking potential bids from contractors in order to meet the goals of the organization. Some of the activities in this phase, which are not all inclusive, “are receiving the offeror’s proposals and conducting pre-proposal conferences if needed,” etc. (Rendon & Rendon, 2016, p. 757). The contracting officer is involved in this phase by preparing invitations for bids for the contract (FAR, 2016).
d. Phase IV – SourceSelection
The source selection phase is the process of evaluating proposals to select a contractor. This process includes “reviewing technical, management and cost proposals, conducting cost/price analysis, negotiating cost, schedule and technical requirements, as well as agreeing on other contract terms and conditions” (Rendon & Rendon, 2016, p. 757). The contracting officer is responsible for reviewing all bids and making a bid award determination. The focus of this research is to develop a financial assessment framework to assist contracting officers in making a determination regarding the financial health of the prospective contractor prior to awarding the contract.
e. Phase V - Contract Administration
The contract administration phase is the process of meeting the contractual requirements and ensuring their performance fulfills contractual obligations. The contracting officer may delegate responsibility to the contracting administration office, which includes reviewing the compensation plan, insurance plan, post-award orientation, etc. (FAR, 2016). This phase includes making sure that the DOD contractor is monitored regarding its performance of the contract (Rendon & Rendon, 2016, p. 757).
f. Phase VI – Contract Closeout
The contract closeout phase is the last phase of the contracting process. This phase encompasses the completion or the termination of the contract, whichever is appropriate (Rendon & Rendon, 2016).
3. Procurement Fraud
Before introducing procurement fraud, understanding the meaning of procurement is important to defining procurement fraud. In order for a company to engage in business, it must spend a significant part its budget to procure goods and inventory. As cited in Tan (2013),
Procurement fraud is defined as an intentional deception to negatively influence any stage of the procurement process so as to make a financial gain or cause a loss to the organization (p. 31).
The next section will give historical examples of fraud in financial reporting.
B. HISTORY OF FRAUD IN FINANCIAL REPORTING
a. Roman Empire (A.D. 193)
According to a CBS News article in 2011, the first example of financial fraud happened in a
sale of the Roman Empire in 193 A.D. During unrest in the Roman Empire, the Praetorian Guard (a special army supposedly loyal to the emperor) killed the current emperor and offered the empire to the highest bidder. The winner was Julianus, who came up with a very generous price, 250 gold pieces for every member of the army, which comes out to approximately $1 billion in today's money. Unfortunately, the guards had sold something that did not belong to them, which is a classic financial fraud. The new emperor was never recognized as such and was quickly deposed. (James, 2011, p. 2)
b. Enron
The most well-known fraud in financial reporting is probably the Enron scandal. In 2000, Enron Corporation had annual revenue of $100 billion, and the company's stock price peaked at $90 per share (CBS News, 2006). At its height, Enron ranked seventh on the Fortune 500 company list and achieved a position as the sixth largest energy company in the world. Jeffery Skilling was appointed CEO after Ken Lay was released in August of 2001. Enron reported its first loss in a quarter in October 2001 of $618 million (CBS News 2006). Shortly after that, Enron filed for bankruptcy protection on December 2, 2001 resulting in about 5,600 losing their jobs (CBS News, 2006). In July 2004, Ken Lay pleaded not guilty to the 11 charges of fraud and making misleading statements (CBS News, 2006).
Enron is an example of financial fraud and how any company could commit fraud. This following section will discuss what the fraud triangle is and how it applies to contractors.
C. THE FRAUD TRIANGLE AND DOD POLICY
The components of fraud were first explained by Donald R. Cressey, an American criminologist. The factors that can be the reasons behind someone committing occupational fraud can be found in the fraud triangle. Pressure, opportunity, and rationalization are the three components that contribute to a person violating trust and committing fraud (Figure 5). Cressey’s (1973) hypothesis is that
trusted persons become trust violators when they conceive of themselves as having a financial problem which is non-shareable, are aware this problem can be secretly resolved by violation of the position of financial trust, and are able to apply to their own conduct in that situation verbalizations which enable them to adjust their conceptions of themselves as trusted persons with their conceptions of themselves as users of the entrusted funds or property. (p. 30)
Figure 5. Fraud Triangle. Source: Lucrum Consulting (n.d.).
Pressure. In accordance with the Association of Certified Fraud Examiners (2016), “pressure is what motivates the crime in the first place. The individual has some financial problem that he is unable to solve through legitimate means, so he begins to consider committing an illegal act, such as stealing cash or falsifying a financial statement, as a way to solve their problem” (p. 1).
Opportunity. Opportunity is defined by the Association of Certified Fraud Examiners (2016) as a “person must see some way that he can abuse his position of trust to solve his financial problem with a low perceived risk of getting caught” (p. 2). This
component is related to weak internal controls in a company. When internal controls are weak, the opportunity to commit fraud exists.
Rationalization. If a person has committed a crime for the first time, he or she generally do not consider himself or herself as a criminal. The Association of Certified Fraud Examiners (2016) states that, “The fraudsters must justify the crime to themselves in a way that makes it an acceptable or justifiable act” which is how they rationalize their actions (p. 3).
According to DOD Instruction 5505.2 (2003), Criminal Investigations of Fraud Offenses, “fraud can be defined as an intentional deception designed to deprive the United States of something of value or secure from the United States a benefit, privilege, allowance, or consideration to which he or she is not entitled” (p. 7). A list of fraud offenses, which are not all inclusive, includes, “offering payment or accepting bribes or gratuities, making false statements, submitting false claims, using false weights or measures, etc.” (p. 7). The following section will discuss fraud behavior in financial reporting.
D. FRAUD BEHAVIOR IN FINANCIAL REPORTING
Recent history reveals a trend in fraud behavior in financial reporting. A 1987 report from the National Commission on Fraudulent Financial Reporting revealed that a large majority of perpetrators of fraud originate from a company’s top management (National Commission, 1987). The study also showed that while the perpetrators may use various means to commit fraud, the effect of their actions is almost always to inflate or smooth earnings or to overstate assets (National Commission, 1987). Although this report is now 29 years old, its relevance remains unchanged (Beasley, Carcello, Hermanson, & Neal 2010). Beasley et al. (2010) found that a majority of fraud cases involve top management in their use of fraudulent financial reporting. Therefore, it appears that fraud behavior originates from upper level management, and management commits fraud in financial reporting.
Various financial analyses of financial statements from publicly traded companies can provide a trail of clues to the potential fraudulent behavior of a company. According
to Wells (2001), “the balance sheet, income statement, and statement of cash flows are all interrelated” (p. 80). By performing typical auditor analytical procedures, investigators can frequently detect the indicators of financial statement fraud (Wells, 2001). For example, the well-known ZZZZ Best fraud case presents a scenario where a simple ratio analysis would have detected the fraud (Wells, 2001). According to the financial information collected, the debt to equity ratio went up 8600% from the previous year; and return on equity fell by more than 75% (Wells, 2001). This example shows how important financial analysis can be used in order to identify any significant fluctuations from year to year and to detect any potential fraud being perpetrated by people within a company (Wells, 2001).
1. Industry Averages and Warning Signs of Fraudulent Behavior
Industry averages provide a source of information for an end user to compare against when using analytical procedures. By comparing the results of an analysis of a company’s financial statements with industry averages, the end user may be alerted to potential fraudulent behavior by noting any departures from the norm (Whittington & Pany, 2012). An additional benefit to an end user in using industry averages is in determining the financial health of the company (Whittington & Pany, 2012).
One example of a source of industry averages is the Dun & Bradstreet report on industry norms and key business ratios. In the report, Dun & Bradstreet (1989) take over one million companies, break them down according to industry, and present fourteen business ratios that address solvency, efficiency, and profitability. Other examples of sources of industry averages are the Department of Commerce Financial Report, the Robert Morris Associates Annual Statement Studies, the Standard and Poor’s Industry Surveys, and the Almanac of Business and Industrial Financial Ratios among others (Gibson, 1992). Reuters is an additional online source of industry averages. Industry averages may not always be reliable since some averages come from small samples providing a distorted view of the industry (Gibson, 1992). Industry averages act as a baseline. A baseline to determine the performance of a company allows for a comparison
against specific industry averages, which may warn the end user of any irregularities that may be caused by possible fraud.
Two studies sponsored by the Committee of Sponsoring Organizations of the Treadway Commission (COSO) provide a comprehensive analysis of fraudulent financial reporting (Beasley, Carcello, & Hermanson, 1999; Beasley et al., 2010). The first study encompassed a 10-year period starting from 1987 to 1997 and analyzed more than 200 companies engaged in financial statement fraud. Beasley, Carcello, and Hermanson (1999) discovered the following three key insights:
in terms of total assets, small companies are more likely to commit fraud
in 72% of cases, the CEO was linked to the fraud
Audit committees and boards of the fraud companies consisted of insider board members, were weak, and held infrequent meetings
Many of the companies where fraud was detected were owned by the founder and board members (Beasley et al., 1999). The companies that were most vulnerable to fraud were experiencing financial strain or distress with net losses or barely breaking even before the fraud occurred. Most cases of fraud overlapped at least two fiscal periods. One, typical fraud issue found on fraudulent financial statement reporting involved overstatement of revenues and assets (Beasley et al., 1999). Furthermore, the status of the auditing company did not matter since over half of the sample fraud companies were audited by a Big Eight auditor (Beasley et al., 1999).
The second study encompassed a nine-year period starting from 1998 to 2007, and its findings with respect to causations were similar to the first study. However, the number of public company fraud cases in the second study increased significantly from 294 to 347 (Beasley et al., 2010). Additionally, the study highlights that in 89% of cases, the CEO and/or CFO had some level of involvement in the fraud (Beasley et al., 2010). Both reports provide significant insight into fraudulent behavior of public companies over the last two decades. Importantly, most of these fraudulent behaviors or warning signals can be gleaned from financial statement analysis.
2. Board of Directors’ Composition Influence on Fraudulent Behavior
The board of directors’ composition may have significant influence on whether or not a company will engage in fraudulent activity. The American Institute of Certified Public Accountants (AICPA) maintains that management is capable of overriding controls that appear to be operating effectively in order to manipulate accounting records and prepare fraudulent financial statements (American Institute of Certified Public Accountants [AICPA], 2012). The internal control capable of monitoring the behavior of top level management is the board of directors (Fama & Jensen, 1983). Fama and Jensen (1983) argue that inside directors have little “incentive to carry out their tasks,” and often cooperate with higher management bypassing an otherwise effective internal control mechanism (p. 315). If the board of directors is compromised, then nothing can limit the actions of top management. Whittington and Pany (2012) provide examples of fraud risk factors, including the opportunity for top management to commit fraud due to ineffective monitoring of management as a result of a weak board of directors or a lack of audit committee oversight.
A study on board of directors’ composition, as it relates to fraud, makes some interesting claims. The empirical analysis of 75 fraud and 75 no-fraud companies found board of directors’ composition to be a significant factor in financial statement fraud (Beasley, 1996). Findings reveal that the no-fraud companies have a larger proportion of outside directors in a board compared to fraud companies that have a smaller proportion (Beasley, 1996). Specifically, fraud companies have boards with 50.2% of their membership on average from outside of the company, while the no-fraud companies have boards with 64.7% of their membership on average from outside of the company (Beasley, 1996). Beasley (1996) also states that “board composition, rather than audit committee presence, is more important for reducing the likelihood of financial statement fraud” (p. 463). Company's where boards were made up of a majority of insider members, especially those in top management, and where negative pressures and incentives were evident, were most likely to commit fraud. Top management and the members of the board of directors can be found by name on the financial statements. An
end user looking for fraudulent behavior in a company should note the board of directors’ composition.
Financial analysis of a company does not always detect fraudulent behavior. Financial analysis may also provide a false positive, detecting fraud behavior when a company is in fact engaged in legitimate activities. According to Wells (2001), a company that “manipulates its earnings only once might avoid discovery altogether” (p. 83). A one-time change from one period to another could be the result of a change in policy, such as the method of recording of accounts receivable. The use of financial ratios to detect and/or predict fraudulent reporting is limited (Kaminski, Wetzel, & Guan, 2004). Kaminski et al. (2004) took a sample of “79 matched pairs of firms” where the “time period was from three years prior to the fraud year through three years post” (p. 17). Using 21 financial ratios, Kaminski et al. (2004) found 16 ratios to be significant, “only three were significant for three time periods…and five were significant during the period prior to the fraud year” (p. 24). A discriminant analysis revealed a misclassification rate for fraud companies ranging from 58% to 98% (Kaminski et al., 2004). Kaminski et al. (2004) acknowledged that some of the limitations of their study included the difficulty in selecting companies and the inability to incorporate the statement of cash flows information. Wells (2001) argued that “no one irregularity is a sign of financial statement manipulation,” and that patterns over a period of time can tell a better story (p. 83). He stresses the point that fraud indicators derived from ratio analyses should be treated as indicators, not as an identifier of fraud. Further investigation into a company’s financial situation may be required to address any red flags of fraudulent behavior. The next section will address the determinants of financial health of a company.
E. FINANCIAL HEALTH DETERMINANTS
Financial health may also be referred to as financial strength. Kennedy & McMullen (1973) describe financial strength as “the ability for a company to meet the claims of creditors not only under current economic and business conditions, but also under unfavorable situations that may occur in the future” (p. 206). Understanding the
financial health of a company is critical to anyone looking to conduct business in any industry. In 2015, an article in the Entrepreneur Magazine stated, “to get an idea of the company’s anticipated returns and future financial needs, ask the business owner and/or accountant to show projected financial statements for the business” (p. 1). Contracting officers may utilize key financial statements such as the balance sheets, income statements, and statement of cash flows to determine the financial health of a company (Entrepreneur Magazine, 2015). The financial health of a company can be derived from several financial data sources include inventory, accounts receivable, net income, working capital, sales activity, fixed assets, and operating environment (Kennedy & McMullen, 1973). The following section discusses these financial data sources in regards to determining the financial health of a company.
1. Inventory
Inventory is a product of a company on hand or in transit at any given point (Oxford, 2006). Inventory consists of goods for sale for a retail company or raw materials, work in progress, and finished goods for a manufacturing company. The ability for a company to properly manage inventory is key when analyzing a company’s financial health.
2. Accounts Receivable
Accounts receivable consists of amounts owed to a company by its customers stemming from past transactions such as the sale of goods on account (Friedman, 2000). It is very important to ensure that accounts receivable are monitored thoroughly. Payments not received affects a company’s current assets and may make the company dependent on unnecessary loans if the company is not able to cover day-to-day expenses.
3. Net Income
Net income is what remains from earnings after all expenses have been deducted from sales including taxes (Braggs, 2012). Company managers and end users need to understand the contribution to net worth of the company being analyzed. If a company
has expenses that exceed revenue for extended periods, then it results in a net loss (Friedman, 2000).
4. Working Capital
Gross working capital includes a company’s cash, accounts receivables, inventory, and other current assets (Friedman, 2000). Net working capital includes all current assets minus current liabilities. A company’s cash conversion cycle (CCC) includes a combination of inventory, accounts receivable, and accounts payable, which are all working capital accounts (Braggs, 2012).
5. Sales Activity
Sales activity is described as any exchange of goods or services for consideration (Friedman, 2000). It is important to understand whether the sale of a good is from a cash or accrual basis of accounting (Friedman, 2000). Accrual basis of accounting is a method whereby revenue is earned (product or service delivered; cash not necessarily received) (Friedman, 2000). In addition, under the accrual basis of accounting, expenses are included when incurred (resources used; cash not necessarily paid). The cash basis of accounting recognizes income and expenses when cash is received and expenses are paid (Friedman, 2000).
6. Fixed Assets
Fixed assets, such as property, plant, and equipment, are used for providing goods and services. If an analysis determines that a company is investing heavily in fixed asset, a contracting officer must understand why. Fixed assets are normally defined as items that have a life perceived to be greater than one year. Furthermore, fixed assets need to be depreciated over their useful economic life (Oxford, 2006).
7. Operating Environment
When determining the financial health of a company it is important to understand the company’s operating environment and corporate culture. Oxford (2006) states that the operating environment may be referred to as the “location strategy, which is the process
of choosing where to locate a unit producing goods or services” (p. 379). If end users are utilizing the operating environment as a financial measurement, they need to take into account their own financial strategy as well as the competitor’s financial strategy (Oxford, 2006). Non-financial factors such as the political environment, economic environment, social forces, and customer base should be taken into consideration when determining the financial health of a company (Entrepreneur Media Inc., 2015). The next section discusses key financial ratios used in determining a company’s financial health.
F. FINANCIAL RATIO ANALYSIS FROM FINANCIAL STATEMENTS
This section provides key financial ratios that may assist contracting officers in making sound decisions when determining the financial health of potential DOD contractors. Data from company financial statements may be used to aid end users in determining the financial health of a company. They have many interfaces and serve different purposes for both internal and external users in determining the overall financial health of the company. Financial statements are records presented by companies to formally report the financial activates during a certain period of time (Paramasivan & Subramanian, 2009). Financial statements are designed to aid companies in quantifying performance, strength, and the liquidity of the company’s financial health to end users. The next step is to utilize those financial statements to conduct a financial analysis.
1. Financial Statement Analysis
Analyzing financial statements provide end users with the necessary data for determining the financial health of a company. For publicly traded companies, end users consider not only published financial statements, but also other indicators of the business climate that affect the company’s health, including stock prices, cost of living and inflation (Lev, 1974). Table 1 shows a map for financial statement analysis. The purpose of the map is to provide different end user perspectives of financial statement analysis. According to Temte (2015), “Upon beginning the financial statement analysis, the first step for an end user is to determine the purpose of the analysis. The user may be management, investors, or creditors. It is key to identify the users upfront, so that their goals or objectives can be established” (p. 74).
Table 1. Map of Financial Statement Analysis. Adapted from Temte (2015).
Step 1 Step 2 Step 3 Step 4 Step 5
Audience Goals or Objectives Sources of Information Analytical Tools Financial Position Investors Valuation Financial
statements (annual report or 10-K) Common-size financial statements Valuation Creditors Ability to pay debt
Footnotes Ratio Analysis Liquidity Management Efficiency Management
discussion
Cash flow projections
Profitability
Other industry data Solvency
One of the most common methods used to analyze a company’s financial health is to compare historical financial statements. By focusing on trends, management and key shareholders can quickly analyze the performance of the company. Elements such as debt, gross margin, accounts receivable, cash, and revenues may show valuable trends. (Bragg, 2014). By analyzing historical data, the end user is able to compare changes in current year statements in relationship to previous years. The comparisons allow for a visual analysis of quantitative increases or decreases in value throughout that specified time period.
Prior to understanding how financial ratios define a company’s financial health, it is critical that the end user fully understand and competently analyze financial statements. Understanding the accounting language may quickly aid the end users by assisting in the identification process. Having a greater knowledge and understanding of financial statements, end users may be able to correctly determine what questions to ask when certain financial statement issues arise. They can also utilize financial statements to determine the current state of the company and to conduct estimates for future investments for the company.
Lev (1974) contends that financial statement analysis includes a review of appropriate “activities that involve the examination of financial and operational information, with the intent of deriving conclusions and presenting actionable
recommendations to management” (p. 1). Financial statement information is used by decision makers for forecasting purposes and for assessing the financial health of a company (Lev, 1974). Once the end user has determined the importance of financial analysis and its understandings, the next step would be to put ratio analysis to practice.
a. Financial Ratio Analysis
Ratios are used to identify specific relationships between different categories of financial data (Lev, 1974). End users may find a relationship between the denominator and numerator when analyzing ratios (Lev, 1974). Data within ratios tend to possess some form of economic, or functional relationship (Lev, 1974). Financial managers use ratios to convert financial data into useable information regarding the direction of the company (Lev, 1974). Financial ratios have many other uses to include company acquisition, company financial planning, and stock portfolio planning (Rist & Pizzica, 2015).
The facilitation of financial statement interpretation is considered to be a major objective of ratio analysis (Lev, 1974). This process is easily conducted by reducing the large number of financial statement categories into relatively small sets of ratios (Lev, 1974). The financial analysis literature usually views ratios as indicators of company deficiencies, such as poor liquidity or low profitability. Thus, if the negative function of ratios is emphasized, a favorable ratio may mean nothing, and then an unfavorable ratio may be deemed significant (Lev, 1974). Lev (1974) states that, “financial ratios are not intended to provide definite answers, but their real value is derived from the questions that arise from the analysis” (p. 34). Ratios display an outcome between a company and its economic conditions, in which, end users may utilize the results as guidelines when conducting financial analysis on a company (Lev, 1974).
According to Gates (1993), “The usefulness of ratio information is limited not by the availability of underlying numbers needed for their computation, but by the willingness of managers to put those numbers to work” (p. 6). According to Gates (1993), “Company ratios are well known for their ability to answer questions like, can the company pay its bills if things tighten up temporarily?” (Current ratio). “Is the money we
have invested in our company bringing as much return obtained from alternate investments?” (Return on net worth). “Are our inventories working hard enough?” (Inventory turnover) (p. 7). By maintaining a greater understanding on where the company stands with its current ratio, return on net worth, and inventory turnover, managers may be able to determine the financial health of the company.
Whittington and Pany (2012) describes financial ratio analysis as “involving comparisons of relationships between two or more financial statement accounts or comparisons of account balances to nonfinancial data (e.g., revenue per sales order)” (p. 152). Financial ratios may be classified by sources of data such as balance sheet ratios (Table 2), income statement ratios (Table 3), and statement of cash flow ratios (Table 4). Ratios can also be classified according to the different economic aspects of the company’s operations to include short-term solvency ratios (liquidity) (Table 5), long-term solvency ratios (leverage) (Table 6), profitability ratios (return on assets) (Table 7), efficiency or activity ratios (inventory turnover) (Table 8), and commonly used ratios to determine fraud (Table 9).
b. Balance Sheet Ratios
Balance sheet ratios are financial metrics that assist in the analysis of determining the relationships between different financial figures such as total liabilities versus total shareholders’ equity. Balance sheet ratios include only the items found on the balance sheet (i.e., financial components of assets, liabilities, and shareholders’ equity). Refer to Table 2 for commonly utilized balance sheet financial ratios (Rist & Pizzica, 2015).
Table 2. Balance Sheet Description for Ratio Analysis. Adapted from Gates (2012).
Financial Ratios from Balance Sheet (Common) Current Ratio Current Assets
Current Liabilities
Quick Ratio Cash + Marketable Securities + Accounts Receivables
Current Liabilities
Debt Equity Ratio Total Debt (Short-Term and Long-Term Total Equity
Sales To Operating Income Ratio
Operating Income
Net Sales – Investment Income
c. Income Statement Ratios
The Income statement ratio is a financial ratio computed from numbers found in the profit and loss statement (Gates, 1993). Some key income statement ratios are shown in Table 3. Many of those ratios are used differently based solely on the company and its respective industry and their business models for generating profits.
Table 3. Commonly Used Income Statement Financial Ratios. Adapted from Rist & Pizzica (2015).
Financial Ratios from Income Statement (Common) Gross Margin Gross Profit
Net Sales
Profit Margin Net Income After Tax Net Sales
Earnings Per Share (EPS) Net Income After Tax
Weighted Average Number of Common Shares Outstanding
Times Interest Earned Earnings for the Year before Interest and Income Tax Interest Expense for the Year
Return on Stockholders’ Equity
Net Income for the Year After Taxes
d. Statement of Cash Flows Ratios
Cash flow ratios measure a company’s ability to generate cash in regards to financing, operating, and investing activities (Braggs, 2007). The performance and financial health of a company can be determined by analyzing the company’s statement of cash flows (Rist & Pizzica, 2015). Many use the term “cash is king” because cash is so vital to the health of a company (Rist & Pizzica, 2015). The statement of cash flow shows inflows and outflows of cash and cash equivalents for a company over an accounting period under various sub headings (Oxford 2006). Table 4 shows commonly utilized statement of cash flow financial ratios (Rist & Pizzica, 2015). The following section discusses financial statement ratio analysis.
Table 4. Cash Flow Statement Financial Ratios. Adapted from Rist & Pizzica (2015). Financial Ratios from Cash flow Statements (Common) Cash Flow to debt Ratio Operating cash flow
Total debt
Dividend Payout Ratio Annual dividend per share Earnings per share
Free Cash Flow NOPAT - Net investment in operating capital Operating Cash Flow NOPAT + depreciation + amortization
G. FINANCIAL STATEMENT RATIO CATEGORIES
The next sections provide contracting officers with information regarding ratios used to assess the financial health of a company. The four major categories of ratios consist of short-term solvency, long-term solvency, profitability, and efficiency ratios. Within these categories, there are several ratios that may assist the end user in determining the financial health of a company.
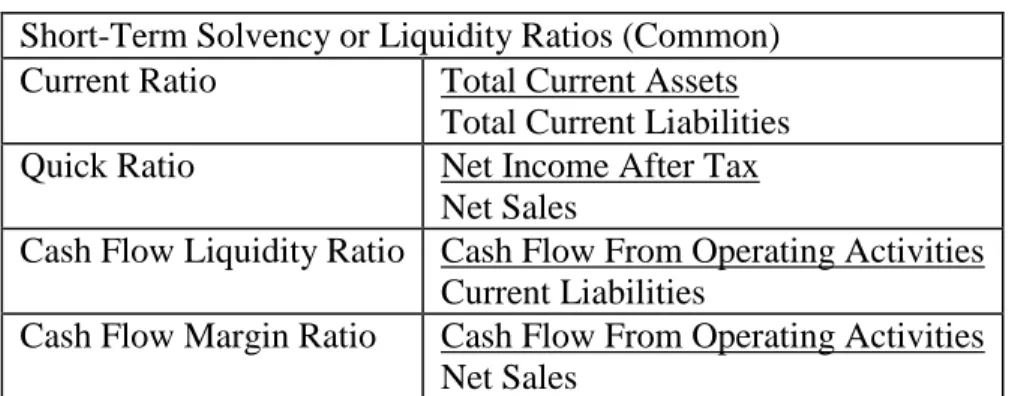
a. Short-Term Solvency (Liquidity) Ratios
Short-term solvency or liquidity ratios can be described as ratios based on the degree to which a company is able to pay short-term debt obligations as they come due.
Short-term lenders such as merchandise suppliers and banks tend to believe that liquidity is a prime interest for determining a company’s financial health (Lev, 1974). The two most referred to short-term solvency ratios are the current ratio and the quick ratio. Table 5 shows several commonly utilized short-term solvency or liquidity ratios (Rist & Pizzica, 2015).
Table 5. Commonly Used Short-Term Solvency Financial Ratios. Adapted from Rist & Pizzica (2015).
Short-Term Solvency or Liquidity Ratios (Common) Current Ratio Total Current Assets
Total Current Liabilities Quick Ratio Net Income After Tax
Net Sales
Cash Flow Liquidity Ratio Cash Flow From Operating Activities Current Liabilities
Cash Flow Margin Ratio Cash Flow From Operating Activities Net Sales
b. Long-Term Solvency (Leverage) Ratios
Long-term solvency ratios are designed to identify a company’s ability to meet and pay long-run financial obligations (Lev, 1974). Debt ratios measure a company’s financial leverage situation in relation to equity in a company’s capital structure (Friedman, 2000). As opposed to the short-term liquidity ratios, debt ratios stress the long-run financial and operating structure of the company (Rist & Pizzica, 2015). Table 6 shows the commonly utilized long-term solvency or leverage ratios (Rist & Pizzica, 2015).