PACIS 2018 Proceedings
Pacific Asia Conference on Information Systems
(PACIS)
6-26-2018
The Influence on Twitter: A Sentiment Analysis
Wei-Lun Chang
Tamkang University, [email protected]
Follow this and additional works at:
https://aisel.aisnet.org/pacis2018
This material is brought to you by the Pacific Asia Conference on Information Systems (PACIS) at AIS Electronic Library (AISeL). It has been accepted for inclusion in PACIS 2018 Proceedings by an authorized administrator of AIS Electronic Library (AISeL). For more information, please [email protected].
Recommended Citation
Chang, Wei-Lun, "The Influence on Twitter: A Sentiment Analysis" (2018).PACIS 2018 Proceedings. 141.
The Influence on Twitter: A Sentiment Analysis
Research-in-Progress
Wei-Lun Chang
Tamkang University
NO 151, Yingchuan Rd., Tamsui, New Taipei City
[email protected]
Abstract
This research explored the sentiment in post, retweet, and reply is more meaningful than just
numbers. We analyzed four targets (two politicians and two celebrities) on Twitter to
examine our model. The results showed the sentiment ratio of celebrities is higher than
politicians.
We also provided the
h
-index to identify high impact of posted topics and the
results showed different topics have different impact. The proposed model can appropriately
estimate the influence in social media and help companies allocate resources effectively and
efficiently.
Keywords: Emotions, social influence, sentiment analysis
Introduction
According to social intelligence theory, socialization is human nature. Individuals interact with each other by socializing, which makes the group well organized. Before the age of the Internet, people would inquire for help from friends in the traditional social network when making decisions. Katz and Lazarsfeld (1955) proposed a two-step flow theory and discovered that social community can influence message contact and interpretation. Before mass communication, word-of-mouth was the original and effective marketing approach. Today, social network services allow people to connect with each other quickly and at low cost. Meanwhile, individuals can use their own advantage to manage social influence via social network services (e.g., Facebook). Certain researchers have attempted to quantify social influence in terms of ideas, opinions, comments, and thoughts (Romero, Galuba, Asur, & Huberman 2011; Cha, Haddadi, Bnevenuto, & Gummadi 2010; Chen, Cheng, He, & Jiang 2012).
Marsden (2006) identified word-of-mouth marketing as having twice the influence of traditional marketing. In particular, the influence of online word-of-mouth has increased by 50% with lower cost and wider scope. The report from Nelson in 2013 revealed that 68% of the global participants trust the online user experience, and 86% of the Taiwanese participants trust their friends’ word-of-mouth. The emergence of information technology facilitates information communication, such as social network services. Every individual in the social network represents civilian power, and many companies have started to focus on those individuals. For example, Virgin America invited 260 influencers (provided them with free tickets) to deliver public reputation when they created a new route to Toronto. Finally, the influencers twitted 4.6 thousand times and generated 74 million impressions. Other examples are free test drives from Audi A8, free coupons from American Express, free smartphones from Samsung, etc. Companies expect major influence to spread to other people in the social network with regard to decisions. In other words, the influence of either individuals or firms in the social network has already become significant.
According to the definition from Merriam-Webster, influence is the ability to affect others or generate powers intangibly or indirectly. Alternatively, influence is owned by individuals or organizations, and can change or strengthen others’ beliefs, attitudes, or behaviors. The issue of influence has been
discussed in sociology, marketing, psychology, and political science (Rogers, 1962; Katz & Lazarsfeld 1955). However, previous studies still cannot build a model to measure the value of influence. In the early age of investigation, most studies focused on the social level (Java, Song, Finin, & Tseng 2007; Ramage, Dumais, & Liebling 2010) as the reasons for using social media and following behavior. Certain literature used graphic structural analysis to identify influential users in terms of centralities (Goh, Kahng, & Kim 2003). Cha et al. (2010) utilized indexer, retweet, and mention influences to measure influence among users. Meanwhile, some emerging companies, such as Klout, PeerIndex, and
PROskore, have delved into calculating the influence. In particular, Klout uses more than ten variables and three constructs (true reach, amplification probability, and network influence) to analyze and compute a user’s influence on the Internet (between 1 and 100). PeerIndex uses activity, audience, and authority to score influence. PROskore uses algorithms to score and rank the reputation of a user in the community.
On the other hand, traditional social behavior involves mostly communicating via telephone or face-to-face, which makes it easier to distinguish tones and gestures in order to guess emotions. Today, the use of text and content on the Internet does not allow easily judging user emotions. Sentiment analysis is used to obtain relationships among users. Existing algorithms that not only mostly overlook emotions in texts, but also merely focus on the number of comments or forwards. Good and bad comments may be commented or forwarded simultaneously. That is, this research considers positive and negative emotions in the content of sentiment analysis, and constructs a model for scoring influence. In practice, some organizations, such as Klout, are more concerned with quantity of social influence. For example, the score of social influence for Justin Bieber was even higher than for Barack Obama in the past. The problem is determining who has positive influence or negative influence online.
Sentiment analysis is used in opinion mining to distinguish user opinion, attitude, and emotion (Pang & Lee 2008). Certain studies used sentiment analysis for online content (Bollen, Pepe, & Mao 2011; Bollen, Mao, & Zeng 2011; Gilbert & Karahalios 2010; Kim, Gilbert, Edwards, & Graeff 2009; Tumasjan, Sprenger, & Sandner 2010) and mostly deployed lexicon-based analysis techniques to find positive and negative emotions (Taboada, Brooke, Tofiloski, Voll, & Stede 2011). Some popular databases are also used currently for studies, such as ANEW (Affective Norms for English Words), POMS (Profile of Mood States), and LIWC (Linguistic Inquiry and Word Count). Hence, this research presents two research questions: (1) how do we construct a model to score social influence in terms of key components? and (2) what is the significance of emotions in the proposed social influence model? We take into account both quantitative data (e.g., number of comment on social media) and qualitative data (e.g., sentiment in the text) in the proposed model. That is, we will revise the existing model to measure social influence and additionally add sentimental factor for adjustment.
The Proposed Model
This research uses the concept of deductive reasoning to construct a social influence model. Deductive reasoning is the objective approach to reason by known facts and theories. This study reviews the current literature to discover the most related components of social influence in the social community that are forward and commented. The user influence on social media has been investigated by certain research (Peng, Yang, Cao, Yu, and Xie, 2017; Mei, Zhong, and Yang, 2015; He, Cheng, Chen, and Jiang, 2013). However, a few research investigated the social influence model. Meanwhile, the importance of sentiment on social media has also been identified recently. By taking into account two concepts, this research aims to propose a novel social influence model to measure the user influence on social media. The proposed social influence model is adapted from the research of Chen et al. (2012), and the emotion concept is extended from Bae and Lee (2012). Firstly, quality of post represents the concept of quantity, which considers numbers on social media (e.g., number of forward and number of comment). Second, Sentiment Ratio represents the concept of quality, which analyzes the emotions in the text in terms of positive and negative words. That is, the concept of our model (Social Influence with Sentiment) is organized into two major components as follows: Quality of Posts and Sentiment Ratio.
SIS =log𝐹𝑜𝑟𝑤𝑎𝑟𝑑𝑒𝑑(𝑣𝑖)+𝐶𝑜𝑚𝑚𝑒𝑛𝑡𝑒𝑑(𝑣𝑖)
𝑃𝑜𝑠𝑡(𝑣𝑖) × ∑ 〔𝑆𝑒𝑛𝑡𝑖𝑚𝑒𝑛𝑡 𝑅𝑎𝑡𝑖𝑜(𝑣𝑖, 𝑣𝑗)〕
𝑛
𝑣𝑗 (1)
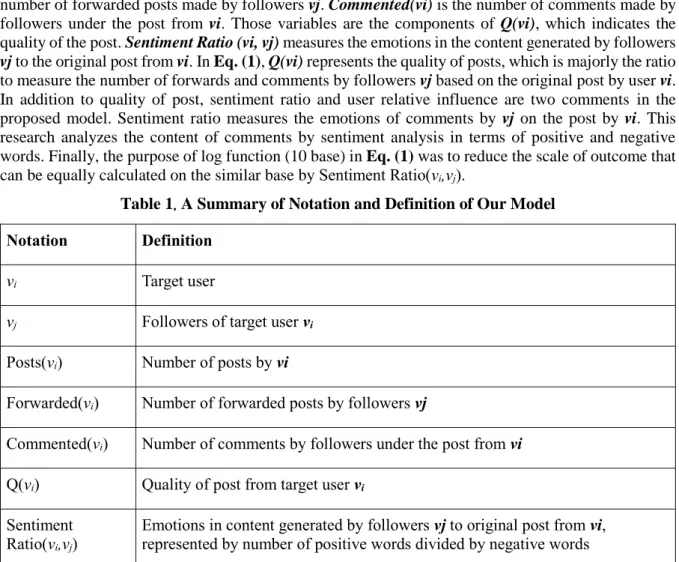
In the first part of Eq. (1), this research estimates a user’s social influence based on forwards and comments on a post (quality of post) and sentiment ratio. In our model, the target user is vi and the followers are vj. In Table 1, Posts(vi) is the number of posts made by vi, and Forwarded(vi) is the number of forwarded posts made by followers vj. Commented(vi) is the number of comments made by followers under the post from vi. Those variables are the components of Q(vi), which indicates the quality of the post. Sentiment Ratio (vi, vj) measures the emotions in the content generated by followers
vj to the original post from vi. In Eq. (1), Q(vi) represents the quality of posts, which is majorly the ratio to measure the number of forwards and comments by followers vj based on the original post by user vi. In addition to quality of post, sentiment ratio and user relative influence are two comments in the proposed model. Sentiment ratio measures the emotions of comments by vj on the post by vi. This research analyzes the content of comments by sentiment analysis in terms of positive and negative words. Finally, the purpose of log function (10 base) in Eq. (1) was to reduce the scale of outcome that can be equally calculated on the similar base by Sentiment Ratio(vi,vj).
Table 1. A Summary of Notation and Definition of Our Model
Notation Definition
vi Target user
vj Followers of target user vi
Posts(vi) Number of posts by vi
Forwarded(vi) Number of forwarded posts by followers vj
Commented(vi) Number of comments by followers under the post from vi
Q(vi) Quality of post from target user vi
Sentiment Ratio(vi,vj)
Emotions in content generated by followers vj to original post from vi, represented by number of positive words divided by negative words
In the second part of Eq. (1), this research focuses on the relationship between each follower vj and target user vi. Sentiment analysis estimates the emotional value of vj on vi. Sentiment Ratio(vi, vj) is
greater than one if user vj has a positive attitude for user vi. Otherwise, it is lower than one with a negative attitude. The sentiment ratio is one if user vj has a neutral attitude (neither positive nor negative). According to the literature (Stieglitz & Dang 2013; Berger & Milkman 2012), the speed with which posts are forwarded is faster if user vj has a positive or negative emotion for user vi. Positive emotion results in faster forwarded posts than negative emotion. Consequently, user vj is willing to forward posts to other users with positive emotion for vi, and we infer that vi has a bigger influence on
vj.
Quality of Posts
According to the literature (Cha et al. 2010; Romero et al. 2011), three components are identified for influence: number of fans (in-degree), forwarded posts, and commented posts. Number of fans is the most intuitive factor to represent the influence of a user. Kwak et al. (2010) and Weng et al. (2010) proposed a measurement for influence based on the number of fans, which is similar to PageRank. Nevertheless, Cha et al. (2010) analyzed 6 million twitter posts and specified no strong connection between the number of fans and social influence. Ye and Wu (2010) also used regression to analyze the relationship between the number of fans, retweets, and comments, and the results showed no
relationship between the number of fans and social influence. On the other hand, those researchers identified forwards and comments as the major factors of social influence, which is also the basis of our proposed model. In this research, quality of posts is defined as the effect of a user’s post that can be forwarded and commented. Users can enhance influence by posting high quality posts to attract more audience. This research adapted the concept of Chen et al. (2012) to measure the influence of a user on social media in terms of quantity.
𝑸(𝒗𝒊) = log ( 𝑭𝒐𝒓𝒘𝒂𝒓𝒅𝒆𝒅(𝒗𝒊)+𝑪𝒐𝒎𝒎𝒆𝒏𝒕𝒆𝒅(𝒗𝒊)
𝑷𝒐𝒔𝒕𝒔(𝒗𝒊) ) (2)
In Eq(2), Q(vi) represents the quality of posts for user vi. First, in the fraction’s numerator, we add the
number of forwards (Forwarded(vi)) and comments (Commented(vi)) of posts as the absolute
influence of vi on other users. The number of posts of user vi is the major source of influence; that is,
post(vi) is the denominator of the fraction. The result of Eq. (2) indicates the number of average posts from user vi that can influence other users. However, the number of post may reach more than 100,000 on social media. This may result in a significant difference in the number between quality of post and sentiment ratio. We use the concept of TF-IDF (Term Frequency–Inverse Document Frequency) to avoid the bias of one number that could dominate the results by multiplication. The log function is used to reduce the scale of quality of post and the difference between quality of post and sentiment ratio in our model.
Sentiment Ratio
Sentiment analysis or opinion mining has recently become popular. Previous studies have focused mostly on analyzing products (Dave et al. 2003; Pang & Lee 2008; Turney 2002). Certain researchers also used sentiment analysis on social media in order to understand the emotional change of fans after Michael Jackson died. Kim et al. (2009) analyzed social media for political comments and predict an election (Diakopoulos & Shamma 2010; O’Connor et al. 2010; Tumasjan et al. 2010). Asur and Huberman (2010) analyzed comments for movies in order to predict box office results. The emergence of social media indeed creates a platform for users or consumers to evaluate products or services spontaneously. The influence of a user can increase by a large amount of followers, forwarded posts, and commented posts; however, the mostly negative emotions of contents could result in a different perception. Even if social influence is high, the direction of positive or negative needs to be carefully considered. Traditional social influence models merely consider “quantity,” but ignore “quality.” This research uses sentiment analysis to extract emotions in order to adjust the social influence model. Sentiment analysis retrieves text and classifies it into positive and negative emotions that can be used to understand the thinking process, mood status, and motivation through text (Tausczik & Pennebaker 2010). The representation of emotion involves three components: positive, negative, and specific emotion, such as nervousness, anger, and sadness. This research uses a vocabulary database to match text and count the number of emotional words, such as love, good, happy, hate, etc. Love, good, and happy are considered positive emotion words, and hate is considered a negative emotion word. That is, this research modifies the concept from Bae and Lee (2012) as the basis of our social influence model in Eq. (3).
𝑺𝒆𝒏𝒕𝒊𝒎𝒆𝒏𝒕 𝑹𝒂𝒕𝒊𝒐(𝒗𝒊, 𝒗𝒋) = 𝒄𝒐𝒖𝒏𝒕𝒗𝒊,𝒗𝒋(𝒑𝒐𝒔.𝒘𝒐𝒓𝒅)+𝜶
𝒄𝒐𝒖𝒏𝒕𝒗𝒊,𝒗𝒋(𝒏𝒆𝒈.𝒘𝒐𝒓𝒅)+𝜶 (3)
{𝑖𝑓 𝑠𝑒𝑛𝑡𝑖𝑚𝑒𝑛𝑡 𝑟𝑎𝑡𝑖𝑜 (𝑣𝑖, 𝑣𝑗) ≧ 1, 𝑡ℎ𝑒𝑛 𝑝𝑜𝑠𝑖𝑡𝑖𝑣𝑒 𝑖𝑓 𝑠𝑒𝑛𝑡𝑖𝑚𝑒𝑛𝑡 𝑟𝑎𝑡𝑖𝑜 (𝑣𝑖, 𝑣𝑗) < 1, 𝑡ℎ𝑒𝑛 𝑛𝑒𝑔𝑎𝑡𝑖𝑣𝑒
In Eq. (3), vi is the target user, and vj is follower of vi. This research focuses on the relationship between two users (vi and vj). First, we count the number of positive countvi,vj (pos.word) and negative
countvi,vj(neg.word) words by matching the extracted content to vocabulary data. In particular, we
assume the sentiment ratio is one when the number of either positive or negative emotion words is zero. The reason is to prevent the fraction from resulting in infinity. Second, the sentiment ratio is a “positive number” if countvi,vj(pos.word) divided by countvi,vj(neg.word) is greater than one. On the contrary,
one. Otherwise, the sentiment ratio is the “original number,” which is countvi,vj(pos.word) divided by
countvi,vj(neg.word), and this is equal to one. The sentiment ratio function is to adjust the value in a
positive or negative direction. Number of positive and negative words reflects the quality of post on Twitter. The relative value in Eq. (3) also balances the weight of positive and negative words in a limited scale. Different followers may have extreme number of positive words or negative words; however, the relative value only reflects the effect of a follower based on the research of Bae and Lee (2012). Furthermore, the concept of smoothing is also used to avoid zero in the denominator of the fraction in Eq. (3). We add a parameter 𝛼 to both the numerator and denominator in order to amplify the effect of zero positive or negative emotion words. 𝛼 is a constant between zero and one, according to the literature and determined by the purpose of the research. This research determined 𝛼 as 0.4 based on previous research.
Data Analysis
Twitter is considered a micro-blogging service that allows 140 words per post in terms of tweets, mentions, replies, and retweets. This research selected four target subjects based on the ranking from Klout: Barack Obama, Hillary Clinton, Justin Bieber, and Taylor Swift. The Klout scores of these four subjects were all higher than 90, which means they have certain influence on social media. According to the literature, four types of social media data can be collected: hashtags, keywords, special users, and Twitter trends. This research uses the concept of special user to collect relevant information from Twitter in two months. The data period for the two singers was from January to February (2015), for Barak Obama was from February to March (2015), and for Hillary Clinton was from March to April (2015). The collected number of posts was 456, and the number of comments was 122,647. We calculate the score of quality of post, sentiment ratio, and social influence for every post. The overall score of quality of post, sentiment ratio, and social influence is averaged based on two months.
Barack Obama has 67% (135) political posts in 200 posts, and Hillary Clinton has 96% political posts in 113 posts. After calculation, the overall social influence for Barack Obama and Hillary Clinton is 5.944367944 and 5.330591602, respectively. In other words, the power of influence on Twitter for Barack Obama is stronger than for Hillary Clinton. The use of social media for Barack Obama is well known since the election campaign in 2008, which can confirm the estimated social influence. Interestingly, the social influence on political topics (5.312231642) for Hillary Clinton is higher than non-political topics (4.699942536), whereas Barack Obama has higher social influence on non-political topics (6.630364145) than political topics (5.614073477). We infer that Barack Obama is the existing president who has received many criticisms on policies. On the other hand, Hillary Clinton has the potential of running in the presidential campaign of 2016.
Justin Bieber has 71% (49) life posts in 69 posts, and Taylor Swift has 85% (62) life posts in 71 posts. This indicates that celebrities like to share their feelings and life with fans on social media. After calculation, the overall social influence for Justin Bieber and Taylor Swift is 35.61786351 and 21.48750155, respectively (Table 6). The power of social influence on Twitter for Justin Bieber is stronger than for Taylor Swift. The reason is that Justin Bieber’s fans mostly support him regardless of the type of topics posted. In particular, the social influence on life topics for Justin Bieber (38.57771588) is higher than the information delivery topic (21.83586116). Conversely, the social influence on information delivery topics for Taylor Swift (29.38393312) is higher than life topics (20.08652175). We infer that Justin Bieber is a debatable celebrity with certain issues in daily life. Hence, the comments of posts from followers are huge and cause an impact. Taylor Swift always has a positive impression from fans either on social media or the real world. Even when the number of posts for life topics is large, the impact of the information delivery topics is critical. Taylor Swift usually posts positive content, such as awards or new music videos to share with fans on Twitter. We infer that this is the reason for the high social influence on information delivery topics.
Impact of Posts
In addition to our proposed model, this research provides another perspective of analysis to explain the impact of user influence on social media (based on different categories of post). We use the concept of
h-index from library science, which is the index of scientific impact. h-index is the metric to measure the productivity and citation impact of publications. The concept is based on a set of most cited papers in library science. The index was proposed by Hirsch (2005), who defined h-index is that a scholar with an index of h has published h papers each of which has been cited in other papers at least h times. In addition, the g-index is introduced as an improvement of the h-index of Hirsch (2005) to measure the global citation performance. If this set is ranked in decreasing order of the number of citations, the g -index is the largest number such that the top g articles received at least g2 citations (Egghe, 2006). g -index contains more comprehensive information from raw data than h-index. This study considers each post on social media is similar to a paper on the Internet. The influence (importance) of a paper can be represented by h-index and g-index.
Barack Obama twitted several issues in economic topics, such as fighting climate change, improving gender equality, and raising the wage. Followers commented lower the tax and gasoline price in order to respond the climate change issue. The key point of gender equality improvement is regarding close wage gap. The followers commented lack of job is the issue not wage and asked president to do something. When Barack Obama pointed out wage issue, followers commented increased food price and low paid problem. That is, followers against the posts with negative emotions mostly. The h-index of Selma parade is 6 (g-index is 9). The posts were regarding right of African Americans and followers supported with positive emotions. The h-index of healthcare is 6 (g-index is 8). The posts were regarding paid sick leave and Obamacare. Followers supported paid sick leave because they thought can enhance productivity and help families. However, the posts about Obamacare were struggling by followers with positive (save some people) and negative emotions (cost too much and unaffordable) simultaneously. The h-index of election topic is 9 (g-index is 11) in Figure 10 which has the most impact among all topics. The posts were regarding the news and announcement of running the presidential campaign. It was the beginning of the campaign; therefore, most followers supported with positive emotions. The h-index of politics topic is 5 (g-index is 6). The most impressive topic was regarding gun violence and asked all Americans to work together to overcome the barriers. Most followers supported it with positive emotions. The h-index of LGBT topic is 5 (g-index is 7). Even Hillary Clinton posted LGBT Americans need to be strong, certain followers doubted her motivation was to win the election with political intention. Positive and negative emotions both existed in LGBT topic and impact the influence of post.
The h-index of life and personal feeling topics are both 18 in Figure 11 which have the most impact among posts. Justin Bieber share thoughts of some events or personal feelings in his daily life. Surprisingly, followers supported the posts and commented with positive emotions. For example, the post of CK advertisement caused many followers to react either like or support the products. A small portion of followers commented in a negative way but no big impact on the influence on social media. Hence, Justin Bieber has a huge number of fans on social media and may cause positive effect on some promotions of products. The h-index of life topic is 20 (g-index is 43) in Figure 12 which is the most impact among topics. Taylor Swift posted thoughts and share what she saw frequently on Twitter. The followers strongly support what she posted. For example, Taylor Swift posted a music video and many followers commented like with positive emotions and appreciated her contribution on music. The followers even called her the queen of pop. That is, Taylor Swift can be a good role model to promote a product on social media.
Concluding Remarks
This research proposed a model for measuring influence on social media by combining the research of Chen et al. (2012) and Bae and Lee (2012). This study selected four people, including politicians and celebrities, as the targets: Barack Obama, Hillary Clinton, Justin Bieber, and Taylor Swift. We also separated the posts into different categories for each target, and provided in-depth analysis in terms of quality of post, sentiment ratio, and social influence. The results revealed that celebrities have higher influence on social media than politicians. The major reason is the sentiment ratio according to our analysis. Celebrities usually post random topics in daily life to interact and share with fans. Followers mostly like posts with positive comments, which causes high sentiment ratio. Conversely, politicians
mostly post specific topics on social media, which can easily generate arguments and more negative comments.
This research aims to measure the effect of posted content from followers rather than merely calculating the number of fans in social networks. The findings showed that followers have different reactions on various post topics. The calculated score of quality of post indeed reflects how followers react on social media. In addition, followers express different emotions on comments, which can cause different sentiment ratio. For example, followers of Barack Obama like non-political topics more than political topics. They may have negative comments when president Obama attempts to convey new policy on Twitter. Hence, bias of influence can occur if positive and negative emotions are combined in an analysis. Our findings also revealed that a high score of quality of post does not necessarily correspond to high sentiment ratio. Consequently, sentiment analysis can objectively adjust the quality of post to generate a final score of social influence.
References
Asur, S., & Huberman, B. 2010. “Predicting the Future with Social Medi,” in Proceedings of the 2010 IEEE/WIC/ACM International Conference on Web Intelligence and Intelligent Agent Technology, (1), pp. 492-499.
Bae, Y. and Lee, H. 2012. “Sentiment Analysis of Twitter Audiences: Measuring the Positive and Negative Influence of Popular Twitters,” Journal of the American Society for Information Science and Technology (63:12), pp. 2521-2535.
Bollen, J., Mao, H., & Zeng, X. 2011. “Twitter Mood Predicts the Stock Market,” Journal of Computational Science (2:1), pp. 1-8.
Berger, J., & Milkman, K. L. 2012. “What Makes Online Content Viral?,” Journal of Marketing Research (49:2), pp. 192-205.
Bollen, J., Pepe, A., & Mao, H. 2011.“Modeling Public Mood and Emotion: Twitter Sentiment and Socio-Economic Phenomena,” in Proceedings of the Fifth International AAAI Conference on Weblogs and Social Media, Barcelona, Spain, pp. 17-21.
Cha, M., Haddadi, H., Benevenuto, F., & Gummadi, P. K. 2010. “Measuring User Influence in Twitter: The Million Follower Fallacy,” ICWSM (10:10-17), pp. 30.
Chen, W., Cheng, S., He, X., & Jiang, F. 2012. “Influencerank: An Efficient Social Influence Measurement for Millions of Users in Microblog,” in Proceedings of the Second International Conference, Cloud and Green Computing (CGC), Xiangtan, China, pp. 563-570.
Dave, K., Lawrence, S., & Pennock, D. M. 2003. “Mining the Peanut Gallery: Opinion Extraction and Smantic Classification of Product Reviews,” in Proceedings of the 12th international conference on World Wide Web, Budapest, Hungary, pp. 519-528.
Diakopoulos, N. A., & Shamma, D. A. 2010. “Characterizing Debate Performance Via Aggregated Twitter Sentiment,” in Proceedings of the SIGCHI Conference on Human Factors in Computing Systems, Atlanta, Georgia, pp. 1195-1198.
Egghe, L. 2006 “Theory and Practice of the G-Index,” Scientometrics (69:1), pp. 131-152.
Gilbert, E., & Karahalios, K. 2010. “Widespread Worry and the Stock Market,” in Proceedings of
ICWSM, Fourth International AAAI Conference on Weblogs and Social Media, George
Washington University, Washington, pp. 59-65.
Goh, K. I., Oh, E., Kahng, B., & Kim, D. 2003. “Betweenness Centrality Correlation in Social Networks,” Physical Review E, (67:1), pp. 017101.
He, X., Cheng, S., Chen, W., and Jiang, F. 2013. “A Novel Measurement of the Activation Probabilities in Information Diffusion Model,” in Proceeding of 2013 International Conference on Information Society (i-Society), Toronto ,Canada, pp. 130-135.
Hirsch, J. E. 2005 “An Index to Quantify an Individual's Scientific Research Output”, in Proceedings of the National Academy of Sciences of the United States of America (102:46), pp. 16569-16572. Java, A., Song, X., Finin, T., & Tseng, B. 2007. “Why We Twitter: Understanding Microblogging
Usage and Communities,” in Proceedings of the 9th WebKDD and 1st SNA-KDD 2007 workshop on Web mining and social network analysis, San Jose, California, pp. 56-65.
Katz, E., & Lazarsfeld, P. 1955. “Personal Influence: The Part Played by People in the Flow of Mass Communications,” New York: The Free Press.
Kim, E., Gilbert, S., Edwards, M. J., & Graeff, E. 2009. “Detecting Sadness in 140 Characters: Sentiment Analysis and Mourning Michael Jackson on Twitter,” Web Ecology (3), pp. 1-15. Kwak, H., Lee, C., Park, H., and Moon, S. 2010. “What is Twitter, a Social Network or a News
Media?,”in Proceeding of WWW 2010 Conference, North Carolina,USA, pp. 591-600.
Marsden, P. 2006. “Consumer Advisory Panels: The Next Big Thing in Word-Of- Mouth Marketing?,”
Market leader (33), pp. 45-47.
Mei, Y., Zhong, Y., and Yang, J. 2015. “Finding and Analyzing Principal Features for Measuring User Influence on Twitter,” in Proceeding of 2015 IEEE First International Conference on Big Data Computing Service and Applications (BigDataService), Korea, pp. 478-486.
O'Connor, B., Balasubramanyan, R., Routledge, B. R., & Smith, N. A. 2010. “From Tweets to Polls: Linking Text Sentiment to Public Opinion Time Series,” ICWSM (11:122-129), pp. 1-2.
Pang, B., & Lee, L. 2008. “Opinion Mining and Sentiment Analysis,” Foundations and trends in information retrieval (2:1-2), pp. 1-135.
Peng, S., Yang, A., Cao, L., Yu, S., and Xie, D. 2017. “Social Influence Modeling Using Information Theory in Mobile Social Networks,” Information Sciences (379), pp. 146-159.
Ramage, D., Dumais, S. T., & Liebling, D. J. 2010. “Characterizing Microblogs with Topic Models,”ICWSM (10), pp. 1-1.
Rogers, E. M. 1962. “Diffusion of Innovations,” NY: Free Press.
Romero, D. M., Galuba, W., Asur, S., & Huberman, B. A. 2011. “Influence and Passivity in Social Media,” Proceedings of the Machine Learning and Knowledge Discovery in Databases, Springer, Berlin, Heidelberg, pp. 18-33.
Stieglitz, S., & Dang-Xuan, L. 2013. “Emotions and Information Diffusion in Social Media—Sentiment of Microblogs and Sharing Behavior,” Journal of Management Information Systems (29:4), pp. 217-248.
Taboada, M., Brooke, J., Tofiloski, M., Voll, K., & Stede, M. 2011. “Lexicon-Based Methods for Sentiment Analysis,” Computational linguistics (37:2), pp. 267-307.
Tausczik, R. L., & Pennebaker, J. W. 2010. “The Psychological Meaning of Words: LIWC and Computerized Text Analysis Methods,” Journal of Language and Social Psychology (29), pp. 24-54.
Tumasjan, A., Sprenger, T. O., Sandner, P. G., & Welpe, I. M. 2010. “Predicting Elections with Twitter: What 140 Characters Reveal about Political Sentiment,”ICWSM (10), pp. 178-185.
Turney, P. D. 2002. “Thumbs Up or Thumbs Down? : Semantic Orientation Applied to Unsupervised Classification of Reviews,” in Proceedings of the 40th annual meeting on association for computational linguistics, Philadelphia, Pennsylvania,USA, pp. 417-424.
Weng, J., Lim, E. P., Jiang, J., & He, Q. 2010. “Twitterrank: Finding Topic-Sensitive Influential Twitterers,” in Proceedings of the third ACM international conference on Web search and data mining, New York, USA, pp. 261-270.
Ye, S., & Wu, S. F. 2010. “Measuring Message Propagation and Social Influence on Twitter,” in
Proceedings of the Second international conference on Social informatics, Com In Bolc. L., Makowski. M.,& Wierzbicki. A (eds.), Social Informatics, Laxenburg, Austria, pp. 216-231.