visualization: lessons from the LVML
Ulrike WISSEN HAYEK, James MELSOM, Noemi NEUENSCHWANDER, Christophe GIROT and Adrienne GRÊT-REGAMEY
1 Introduction
3D visualization instruments gain more and more importance in contemporary spatial and landscape planning as costs for hard- and software decline and the technology allows for increasingly sophisticated visualizations (PAAR, 2006; SALTER ET AL., 2009). This necessitates integrating the methods and techniques of 3D visualization and modelling into the education program in order to train students on working with the new instruments and making them fit for praxis and research (AL-KODMANY, 2001). However, existing training programs in visualization are scattered and tend to focus on learning the technology rather than its appropriate use (SHEPPARD AND CIZEK 2009).
This paper documents and assesses an interdisciplinary approach for teaching 3D landscape visualization studios to improve students’ awareness of principles in 3D landscape visualization and application in participatory landscape planning and design. First, a short overview is given on the challenges and requirements for teaching 3D visualization in spatial disciplines. Then, the organisation of the studio is presented. The documentation of the students’ results and qualitative evaluation of the lab as well as the educators’ experiences are used for evaluating the quality of the studio. Conclusions are drawn with regard to the benefits and limits of the interdisciplinary studio, deriving clues for further enhancement.
2
Teaching 3D visualization: challenges and choice of software
Quickly developing computer technology is allowing the production of more mature 3D visualization techniques. Technical advances in the movie and game industry, e.g. James Cameron’s Avatar (http://en.wikipedia.org/wiki/Avatar_(2009_film)), suggest further fusion of live action and highly interactive, photorealistic computer-generated environments allowing the viewer a great sense of immersion into the virtual world. In spatial disciplines various techniques have evolved adapting available visualization techniques to their specific needs. In architecture, for example, only recently innovative procedural modelling methods using shape grammars for the automatic creation of large-scale 3D city models have been applied, which are enabling quick visualization of complex city models, evaluation of alternatives and iterative design workflows (HALATSCH ET AL., 2008). Further, game engine technologies are explored for architectural education, collaborative design processes, and visualization (YAN ET AL., 2010). These game engines provide interactive visualization in first or third person perspectives, some of them
supporting the creation of landscape scenarios with amazing 3D visualisations and effects, e.g. rain, falling leaves, etc. in real-time (e.g. CryENGINE, http://mycryengine.com). This makes game engines also very interesting for application in spatial and landscape planning, e.g. for visual-acoustic simulations of wind parks allowing more comprehensive landscape assessment (MANYOKY, 2011). Recently, new techniques have been made available for the better integration of 3D modelling in the landscape design workflow using digital CNC tools (GIROT ET AL., 2010).
Although 3D visualizations are omnipresent in our daily life through the media, only few are aware of the processes involved in selecting particular technical tools for visualization and the effects 3D visualizations may have on people and their decisions (MATHYS, 2010; SHEPPARD AND CIZEK, 2009). Further, there is considerable inability of clients to order 3D visualizations appropriate for their tasks and to integrate them into their planning processes properly (MATHYS, 2010). Thus, following challenges have to be handled in courses teaching 3D landscape visualization on master level courses in spatial disciplines (MATHYS, 2010; SMITH ET AL. 2010; SHEPPARD AND CIZEK, 2009):
Give an understanding of the requirements for a useful model
Establishing software skills
Building competence for assessing those techniques in terms of their options and limits in supporting communication in the planning process
Establishing skills and expertise for applying the 3D visualization tools for real tasks, particularly for participatory planning processes
Supporting interdisciplinary work
Managing the limited time resources of courses
Regarding 3D visualization software, different packages are required for the various modelling, designing, rendering, real-time visualization and participation tasks. An overview on a selection of currently available software packages for realistic rendering, interactive 3D landscape models as well as additional products required for modelling 3D objects such as vegetation or buildings is given, for example, by WISSEN HAYEK ET AL. (2010a). Study results show that there is no “universal landscape visualization solution” (e.g. APPLETON ET AL. 2002; PAAR 2006). The choice of the software-packages available in the LVML was, therefore, based on the suitability for combined use in different workflows. Participative workshops aiming at common design processes of landscape change require interactive access to the data base including its manipulation in real-time as well as support of multiple scales (PAAR 2006; SALTER ET AL. 2009; SCHROTH 2007). LandXplorer Studio Professional (Autodesk; http://usa.autodesk.com/adsk/servlet/pc/index?id=12561246&site ID=123112) is suitable for rather easy creation and exploration of interactive GIS-based 3D landscape models useful for conceptualising and visualising design projects. The ability to incorporate numerous sources of data helps to more accurately visualise the impact that infrastructure change, urban planning, tourism, or economic development projects have on a city and the surrounding environment. Additionally, Google SketchUp Pro (http://sketchup.google.com) was chosen as object modeller for its user-friendliness, the tutorials available, and the large library of already existing examples and 3D objects. The
software includes integrated tools for uploading content to Google Earth and to the Google 3D Warehouse, a repository of models created in SketchUp.
3
The LVML Studio 2010
The LVML – Landscape Visualization and Modelling Lab (www.lvml.net) at the ETH Zurich was put into operation in 2010 in order to meet the requirements of state-of-the-art and comprehensive education and research in 3D landscape visualization. The lab is lead in joint collaboration of the Chair of Prof. Christophe Girot at the Institute of Landscape Architecture (ILA), Department of Architecture (D-ARCH), and the Chair for Planning of Landscape and Urban Systems (PLUS – Prof. Adrienne Grêt-Regamey) at the Institute for Spatial and Landscape Planning (IRL), Department of Civil, Environmental and Geomatic Engineering (D-BAUG). In the Spring Semester 2010 the first 3D visualization studio was run in the master course programs of Architecture and Civil Engineering.
3.1 Goal, tasks and participants of the studio
The main goals of the LVML studio were (1) to impart knowledge on the state-of-the-art in 3D landscape visualization and modelling in landscape planning and architecture, (2) to establish software skills in 3D landscape visualization and modelling, and (3) to train the application of 3D visualizations in participatory planning processes.
The lectures comprised six session of 3.5h duration. The sessions provided a theoretical and practical introduction to the area of GIS-based 3D landscape visualization and modelling in landscape planning and architecture, focusing on visual principles, ethical aspects (SHEPPARD 2005), and suitable applications in landscape architecture and planning (Tab. 1). Further, training on 3D visualization software on a case study site took place in the LVML equipped with 16 workstations and state-of-the-art software packages. Finally, the students prepared and applied 3D visualizations in a participatory workshop in the ETH Value Lab, an interactive collaborative environment (BURKHARD AND SCHMITT 2009). Students' GIS skills were ranging from a rather low up to an advanced level. One had no GIS but very good CAD skills. All students were on the master level but in different master programs: 13 Spatial Development and Infrastructure Systems, 4 Geography, 1 Geomatic Engineering and Planning, and 1 Environmental Engineering. The educators leading the lab were coming from both chairs.
Tab. 1: Overview on the studio’s program with 6 sessions
Theory lecture Software training Students’ exercise
1 3D visualization for landscape and environmental planning
– overview
Getting started with interactive GIS-based 3D landscape modeling
Setting up a basic 3D model of the case study area comprising terrain, orthophoto, extruded and textured houses and tree objects (billboards) 2 Instruments for manipulation
or for planning support – Ethical aspects
Creating billboards; Getting started with object modelling
Modelling a 3D house object according to a given plan (ground view, perspective with textures)
3 Virtual landscapes for participative planning – Planning a workshop
Adding more detail to the 3D landscape model (textures and objects; analysis of the model)
Export/import of 3D house object; Change texture of orthophoto; Tools for analysis; creating new vectors; advanced layout and navigation features
4 Interactive modelling in landscape architecture – Design loops
Add more resolution to the model in the design area than the side area provides
Contour modelling according to the example of the Forum / S-E Coastal Park, Barcelona (FOA); Preparation of 3D visualizations for the final workshop 5 Importance of
foreground and background – Modes of visualization
Technical tips and tricks Editing textures; Creating cut components; Adding fog; Shadow analysis of a location; Creating scenes; Preparation of 3D visualizations for the final workshop
6 Critical feedback on the students’
implementation of 3D visualizations
Critical feedback on the students’ 3D
visualizations (level of detail and interactivity)
Conduct of workshop in which prepared 3D visualizations are applied to support the evaluation of design alternatives of the students’ case study areas
3.2 Teaching methods of the studio
Each session started with a 30 minutes lecture on essential basics with regard to generation and use of 3D visualizations in spatial planning based on a review of the state-of-the-art. In the first session, students were also introduced to the case study area and provided with the GIS-data required for setting up a basic 3D landscape model, i.e., a digital terrain model (DTM), orthophotos and vector layers of land cover/use such as building footprints, forest and agricultural areas and streets. Further, links to essential spatial plans were given and the main development objectives for the case study area were presented in order to engage the students in the spatial planning task.
The students built 4 groups of 5 students each. In terms of a project ending with the end of the course, the groups were instructed to prepare 3D landscape visualizations suitable to support a fictive participative workshop on the green space development concept of defined focus areas. After the theory part, a lecturer was training the students on the respective software by showing the workflow as live demo and the students reproducing the steps. Official tutorials explaining all functions of the software were made available. After enabling the students in using the software they were asked to work on their own coached by the lecturers. In the final session, each group introduced the remaining students to their role as stakeholders as well as the workshop task and applied their prepared 3D visualizations in combination with other workshop media, such as power point presentations, 2D maps or flip charts. A workshop lasted 30 minutes, followed by 15 minutes evaluation with regard to the following criteria:
1. Preparation of the workshop
Defining goal of the workshop
Structuring of the workshop (contents and time schedule) 2. Prepared 3D landscape visualizations
Preparation of required contents with 3D visualizations
3. Application of the 3D landscape visualizations in the workshop
Suitability of the 3D visualizations for the workshop tasks
Workshop setting (presentation of 3D visualizations, navigation, moderation, use of other workshop means)
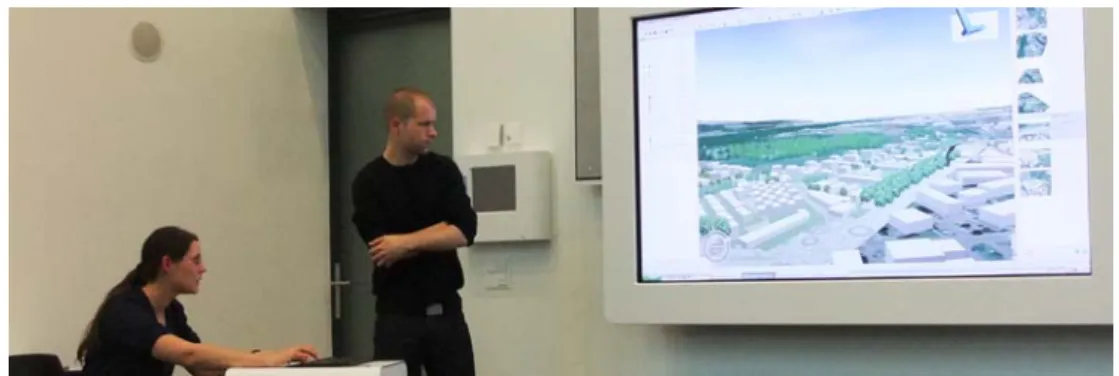
Fig. 1: Students’ workshops: Application of abstract and more photorealistic visualizations as medium in participative workshop situations in the ETH Value Lab
4
The studio’s results
From the documentation of the students’ workshop results including the final critics, the students’ qualitative evaluation of the lab as well as the educators’ experiences, conclusions were drawn for educational knowledge transfer and the studio’s enhancement. 4.1 Students’ workshops
The groups prepared the required workshop contents in rather different 3D landscape visualizations with regard to the level of detail and the degree of interactivity (Fig. 1). The possibilities of the software, particularly of the interactive tool were not used by all groups. One group decided to work with still images prepared in an overview with 2D maps. All groups had additionally prepared a presentation with MS Power Point or with the zooming presentation editor Prezi (http://prezi.com) providing background information of the workshop task. Regarding the suitability of the prepared 3D visualizations for the workshop task, particularly the chosen level of detail was not adequate in all cases. Nevertheless, some groups managed to draw the stakeholders’ attention on the essential contents under discussion by choosing relevant perspectives and contents in the 3D visualizations suitable for supporting the evaluation of alternatives.
4.2 Students’ feedback on the studio
Overall, the students said that they learned a lot as they had no experience in 3D landscape visualization in the beginning and were able to work with the tools in the end in a practical situation. However, they recommended enhancing the teaching method. Whereas the theory lectures were interesting and should be maintained in this form, they criticized the way of learning the software. They wished more intensive but small exercises for individual tutorial-based problem solving, learning essential workflows for developing a required result. The students considered also the workshop valuable for experiencing the quality of their 3D visualizations in planning situations.
4.3 Educators’ experiences
Regarding the program, the basic structure was good. The short theory lectures surely raised awareness of important visualization principles. Integrating know-how from different disciplines, as in this case from landscape architecture and from landscape planning, into the theoretical part as well as the software training encouraged the students to test different modeling techniques. However, concluding from the workshop results, more information on the required level of detail and interactivity is needed in order to enhance the students’ ability to choose appropriate levels. With regard to the group work, particularly the interdisciplinary composition of the students was beneficial. This fostered mutual learning and students with good GIS or object modeling skills shared their know-how, accelerating the others learning curve.
Students were encouraged to make use of the GIS-database to perform spatial analyses of the current situation and their planning alternatives as basis for their design process and for communicating insights to stakeholders. However, the students’ efforts focused rather on the representation of the current landscape and planning alternatives for qualitative assessment of stakeholders.
5
Discussion and Conclusions
In this paper we presented and evaluated an interdisciplinary approach for teaching 3D landscape visualization studios to improve students’ awareness of principles in 3D landscape visualization and application in participatory landscape planning and design. Overall, the students were enabled to prepare and apply GIS-based 3D landscape visualizations. Further, conducting studios that are interdisciplinary with regard to both the lab leaders as well as the students foster knowledge transfer from research findings to education and thus to praxis and seem to accelerate the speed of learning. A cross fertilization of knowledge and ideas has also been noticed by other 3D modelling teachers, however, more with respect to the students’ mutual assessment of the other groups’ presentations (Smith et al., 2010).
The role of Landscape Architecture within the classes and project work has focussed chiefly in lectures and tuition into methods, rather than tutoring in design or specific project input. This interdisciplinary input into the outcomes of finite projects has been limited either by the selection of appropriate site or the specific site problematics under scrutiny.
Until this point the cross-fertilisation has principally been weighted in the realm of landscape architecture education towards planning, rather than vice-versa. We look forward to future evolution of the course, where planning instruments can influence the formation of large-scale landscape architecture projects, and where the individual student groups can consist of both architects and planners, ideally in equal shares. These developments are increasingly realistic due to the current trends towards compatibility between software applications, datasets and modelling methods that have traditionally further differentiated the disciplines.
The teaching methods should mainly be enhanced with regard to (1) fostering the link of GIS-based spatial analysis and landscape architectural design enabling for iterative 3D visualization and modelling workflows, (2) giving even a deeper understanding of the requirements of useful 3D models, and (3) the training allowing an individual speed in learning software functions. Further, all students should evaluate the results of the others in order to apply their knowledge. In this way, they can learn from both the experiences they gain from applying their own 3D visualizations for a planning task and the good examples and mistakes the others provide. For assessing the quality of the 3D visualizations, the purpose of the visualizations, the data used and the visualization process should be documented by the groups in order to establish standards for meta data (SHEPPARD AND CIZEK, 2009). How much the adapted approach enhances the quality of the students' results, has to be proven by further monitoring of the studio.
6 References
Al-Kodmany, K. (2001): Visualization Tools and Methods for Participatory Planning and Design. Journal of Urban Technology 8/2: 1-37
Appleton, K., Lovett, A., Sünnenberg, G. & T. Dockerty (2002): Rural landscape visualization from GIS databases: a comparison of approaches, options and problems. Computers, Environment and Urban Systems 26: 141-162
Burkhard, R. & G. Schmitt (2009): Visualising Future Cities in the ETH Value Lab - New Methods for Education and Learning. In: X. Wang and M.A. Schnabel (eds.), Mixed Reality in Architecture, Design and Construction, Springer Science + Business Media B.V., 205-218
Girot, C., Bernhard, M., Ebnöther, Y., Fricker, P., Kapellos, A. & J. Mesom (2010):
Towards a Meaningful Usage of Digital CNC Tools – Within the field of large-scale landscape architecture. eCAADe 28: 371-378
Halatsch, J., Kunze, A. & G. Schmitt (2008): Using Shape Grammars for Master Planning.
In: J.S. Gero (ed), Design Computing and Cognition DCC’08, Springer, 655-673 Manyoky, M. (2011): SoundLandScape – Linking GIS-based 3D landscape visualization
and spatial explicit ambient noise made by wind turbines. Master thesis in M.Sc. Geomatic and Planning, PLUS, IRL, ETH Zurich
Mathys, A. (2010): Landschafts- und Projektvisualisierung: Technische Möglichkeiten und sinnvolle Anwendung. Eidgenössische Forschungsanstalt WSL, Forum für Wissen 2010: 53-58
Paar, P. (2006): Landscape visualizations: Applications and requirements of 3D visualization software for environmental planning. Computers, Environment and Urban Systems 30: 815-839
Salter, J.D., Campbell, C, Journeay, M. & S.R.J. Sheppard (2009): The digital workshop: Exploring the use of interactive and immersive visualization tools in participatory planning. Journal of Environmental Management, 90: 2090-2101
Schroth, O.G. (2007): From information to participation - interactive landscape visualization as a tool for collaborative planning. Diss., Eidgenössische Technische Hochschule ETH Zürich, Nr. 17409
Sheppard, S.R.J. (2005): Validity, Reliability and Ethics in Visualization. In: I. Bishop and E. Lange (eds), Visualization in Landscape and Environmental Planning. Technology and Applications. Taylor & Francis, London, New York, 79-97 Sheppard, S.R.J. & P. Cizek (2009): The ethics of Google Earth: Crossing thresholds from
spatial data to landscape visualisation. Landscape and Urban Planning 90: 2102-2117
Smith, M., Burton, A. & N. Kokkas (2010): Teaching and Learning Strategies for 3D Urban and Landscape Modeling. Facing the Challenges – Building Capacity, FIG Congress 2010, Sydney, Australia
Wissen Hayek, U., Klein, T. M. & J. Melsom (2010a): 3D Landscape Visualization Products. disP 183/4: 114-119
Yan, W., Culp, C. & R. Graf (2010): Integrating BIM and gaming for real-time interactive architectural visualization. Automation in Construction, doi:10.1016/ j.autcon.2010.11.013