TapAnalytics 5.5 -‐ Release Notes – for external release
TapAnalytics 5.5 Release
Hello and welcome to the latest version TapAnalytics – Release 5.5! This release contains the long-‐awaited ‘Importer’ which enables Users to set up their own automated datafeeds as well as a huge number of new User Experience improvements that make working with TapAnalytics even more of a breeze than it already was! Enjoy!
Table of Contents
TapAnalytics 5.5 Release
... 1
TapAnalytics 5.5 – Features ... Error! Bookmark not defined.
TapAnalytics 5.5 – New Integrations and Integration Enhancements .……..………2
LinkedIn Social Profiles……….………..………..…2
Moat Display ……….………..….………...2
Major New Features in TapAnalytics 5.5 ... 3
Excel spreadsheet import wizard (*Beta*) ……….………...……….3
Text Widget for Dashboard Views ………..……….………..….5
New Data Groupings for Widgets ………..….………...5
Interactive Column Reordering for Widgets ………..….………...6
"Soft Delete" of Scheduled Reports ………..………..….………...6
Hide Mapped Values in Service Mapper …….………..….………...7
Hide Manager Services functions for Cluster Admins ……….………...7
Selected Platform Enhancements ... 8
Release Preview ………...……….………..…………8
TapAnalytics 5.5 – New Integrations and Integration enhancements
LinkedIn Social Profiles
LinkedIn is a professional networking site that allows its members to create business connections, search for jobs, and find potential clients. LinkedIn Social Profiles enable general professionals to manage their professional identities. See more at:
https://www.linkedin.com
Moat Display
Moat measures real-‐time, multi-‐platform, actionable Attention Analytics. See more at: http://www.marketo.com/
General Integration Enhancements:
• DFA -‐ Reporting Profile -‐ Detail Grids -‐ Creative -‐ Add Preview • Facebook Ads -‐ Conversion Pixel Tracking
• Facebook Insights -‐ Main Columns -‐ Add Post Count • Google Webmaster Tools -‐ Additional New Items
• Google Webmaster Tools -‐ Update the old feed to provide query information • IV Interactive “rebuild” -‐ full new integration
• Media Prowler -‐ Enhance data file to include new metrics • MediaMath -‐ Modify the Strategy Dataview
• Mixpo -‐ Enhance Feed to Include New Metrics • Xad enhancement: Creatives
• Xad enhancement: Geotargeting
• YaSabe -‐ Update Feed -‐ naming convention and columns
Major New Features in TapAnalytics 5.5
New features released with TapAnalytics 5.5: • Excel spreadsheet import wizard (*Beta*) • Text Widgets for dashboard views
• Interactive re-‐ordering of columns in Widgets
• New data groupings to support line-‐chart and bar-‐graph Widgets • Show/Hide inactive scheduled reports (“soft delete”)
• Hide mapped values on “Manage Services” page • Hide “Manage Services” page for Cluster Admins
• Internal – Hide service names in URLs for fully white-‐labeled instances
• Numerous bug fixes and platform improvements to improve performance, security and stability.
Custom Services -‐-‐ Excel Spreadsheet Import Wizard (Beta)
TapAnalytics pulls data from a variety of pre-‐built data sources, typically through APIs. Sometimes a client may need to include other, non-‐API-‐based data in their combined Dashboard reporting. This data may be sourced from another system, either internal or external, or data that is captured manually in a spreadsheet.
FTP (File Transfer Protocol) has long been used as a standard to define this exchange of data; DropBox and Google Drive have lately become very widespread as file-‐transfer solutions. The new Custom Service feature takes advantage of these systems to enable client-‐friendly transfer of files on a schedule.
When you’ve defined the files and uploaded them successfully, the feature automatically attempts to detect the fields in the file and assign datatypes to them. The wizard shows you what it has assigned and lets you make any corrections. Note that two files are required: (1) the “data” file which contains the actual data, and (2) a “mapping” file, which defines the clients (IDs and names) which will enable the system to track the data correctly.
USER BENEFITS: Users can now immediately set up their own datafeed and combine with other services in TapAnalytics. These user feeds can integrate automatically with
internally-‐used systems FTP, SFTP, DropBox and Google Drive, enabling Users to integrate internally-‐generated files without the need for creating complex APIs or spending time building one-‐off manual feeds.
Fig. 1 – “File Delivery” setup wizard for Custom Services. Choose from FTP, SFTP, Google Drive or Dropbox to serve (deliver) your files. In this diagram, DropBox has been selected. Note that two files are required – a ‘data’ file and a ‘mapping’ file. The ‘mapping’ file provides the client information necessary to track the data in the system.
NOTE: This feature is released in Beta in TapAnalytics 5.5. It is turned OFF in the standard product and must be turned on for individual case-‐by-‐case situations. If you have an interest in using this new feature, and have generated or can easily generate Excel files to import, please contact a TapClicks account executive, or call 866-‐626-‐1088 for support.
Text Widgets for Dashboard Views
Overview:
‘Text’ widgets are now available to include in dashboard Views. Text widgets are not time-‐ based (as are other widgets); they enable TapAnalytics Super Admins to include natural-‐ language comments or descriptions in a dashboard View, which can then be used as
descriptors or guidance, or to create sections and/or labels in the dashboard View for better understand of the information presented.
USER BENEFITS: Text widgets enable marketing managers at agencies or enterprises to include text around marketing campaigns for their client Users of dashboard Views. This guidance/insight helps the consumer to understand the information in the
dashboard. Text sections/labels and comments help users better understand the information “flow.” This makes the dashboard Views easier to use and better able to serve customer needs.
Additional Data Groupings for Line Chart and Bar Graph Widgets
Overview:
New data grouping options have been added to the Line, bar and pie chart widgets allowing users to create widgets that compare campaigns, traffic sources and other data sources on graphs. In particular, Super Admins can now create widgets that display Adwords and other data grouped by Time.
USER BENEFIT: This makes it easier to create more complex widgets and enables Super Admins to display data in ways that provide more meaningful insights to their advertiser clients.
Interactive re-‐ordering of columns in Widgets
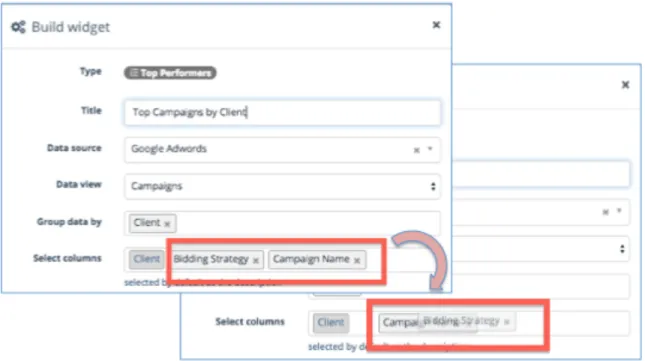
Overview: Super Admin users can now drag and drop “columns” when creating widgets. USER BENEFITS: This provides ease-‐of-‐use in setting up widgets, and allows the widget creator to organize the widget’s metrics in ways that are more meaningful, with less work.
Fig. 3 – Interactive column reordering in Widgets – users can drag and drop to place the columns in the order they wish to appear in the Widget. In the diagram the “Bidding Strategy” column is being dragged to the right of the “Campaign Name” column.
“Soft delete” of Scheduled Reports (Hide inactive scheduled reports)
Overview:
Admins can now Show/Hide inactive scheduled reports so that they will not show up by default in the scheduled report list. Scheduled reports are made inactive as a service to the Admin user. Since Scheduled Reports can be somewhat involved to set up, it is better to keep them around and available in case they are needed again in future.
USER BENEFIT: “Soft delete” makes it easier to see and find the scheduled reports that are actually active and being used by the system, at the same time keeping inactive reports around as a service to the Admin user.
Hide Mapped values in “Manage Services”
Overview:
A switch in the service mapper now allows a user to display only the unmapped values for a service to make mapping up the unconnected campaigns easier.
USER BENEFIT: This new feature makes it easier for Super Admins managing many clients to find unmapped accounts/campaigns in long lists of mapped and unmapped accounts. It is particularly useful where most all of the campaigns are mapped, but a few remain unmapped.
Hide “Manage Services” for Cluster Admins
Overview: The “Manage Services” option can now be hidden for Cluster Admins if a Super Admin user wants to retain control of the processes for managing mappings or connecting services.
USER BENEFITS: This feature provides finer-‐grain control of permissions in an instance for these sensitive and important operations.
Selected Platform Enhancements
TapAnalytics 5.5 introduces several smaller new features and upgrades. Please contact your account manager or [email protected] if you would like additional information.
1340
VendAsta -‐ Add Helper text to Connect Services
1341
Add status filters to scheduled reports
1353
Billing Address: add note about multiple emails
1364
AdGear -‐ Change "View Through Convesions" to "View-‐throughs"
1377
The Trade Desk -‐ move Creative endpoint back to V3
1406
Allow ordering of columns for top performers widget
1455
Rename external_client_id to external_user_id
Release Preview
The following features are planned for the TapAnalytics platform in late 2015 and early 2016:
-‐ Custom data feeds – Full Release
-‐ Leads Visualization with widgets in Lead Management Tool
-‐ Additional data groupings for Bar Graph, Top x Performers Widgets
-‐ Include notes/annotations in reports and widgets
-‐ Customizable categories
-‐ Customizable calculations