Recognition of Falls and Daily Living
Activities Using Machine Learning
Ali Chelli and Matthias P¨atzold
Faculty of Engineering and Science, University of Agder, 4898 Grimstad, Norway. Emails:{ali.chelli, matthias.paetzold}@uia.no
Abstract—A robust fall detection system is essential to support the independent living of elderlies. In this context, we develop a machine learning framework for fall detection and daily living activity recognition. Using acceleration data from public databases, we test the performance of two algorithms to classify seven different activities including falls and activities of daily living. We extract new features from the acceleration signal and demonstrate their effect on improving the accuracy and the precision of the classifier. Our analysis reveals that the quadratic support vector machine classifier achieves an overall accuracy of 93.2% and outperforms the artificial neural network algorithm.
I. INTRODUCTION
Nowadays, most European countries are witnessing an ever-growing percentage of elderlies in the society. According to the World Health Organization (WHO), the frequency of fall incidents and fall related injuries increases from 28% to 42% as the age increases from 65 to over 70 years [1]. Falls represent a major public health problem worldwide and were the leading cause of death for people aged over 65 years in 2013 [2]. On average, the WHO estimates the number of fatal falls per year at 420,000 [3]. Falls can cause fatal and non-fatal injuries. If these injuries are treated quickly, the potential damage related to these injuries can be significantly reduced which results in a higher survival rate. Therefore, it is highly important to develop fall detection systems which can report fall events as quickly as possible.
Existing fall detection systems can roughly be classified into two main categories, namely, context-aware systems and wearable device-based systems [4]. Context-aware systems include video surveillance sys-tems, floor sensors, microphones, and pressure sensors. For instance, if video surveillance is used to detect a fall [5], a series of images are first captured by a camera and then processed by a classification algorithm to determine whether a fall has occurred or not. The literature contains several articles [6]–[8] dealing with fall detection and human activity recognition by means of video surveillance. The major drawback of context-aware systems is that they can compromise users’ privacy. Note that in some countries, the use of video camera for surveillance is legally restricted for privacy reasons [9]. In addition, context-aware systems have a limited monitoring range, are susceptible to external events (e.g., changes in illuminance), and have high
installation costs.
The second main category of fall detection systems is based on wearable devices. These latter are equipped with an accelerometer, which allows measuring ac-celeration changes of a moving person. By analyz-ing the acceleration data, it is possible to recognize human activities. In particular, a sharp increase in the acceleration within a short time interval implies that it is highly probable that a fall has occurred. Unlike context-aware fall detection systems, this cat-egory of fall detection systems can determine user activity without compromising privacy. Moreover, the widespread of smartphones which inherently integrate accelerometers can significantly reduce the cost of wearable fall detection systems.
In the literature, several datasets are publicly avail-able which provides an opportunity for testing fall detection methods and assessing their performance on real-world data. In [10], the authors provide an activity database that comprises acceleration and angular ve-locity data. This data was collected with a smartphone attached to the waist of each participant. A total of 30 participants contributed to this experiment. They were performing activities of daily living (ADL) including: walking, walking upstairs, walking downstairs, stand-ing, sittstand-ing, and lying. On average, the total time of acceleration recoding per participant was 192 seconds. Note that the dataset in [10] includes only ADL activ-ities, not fall related data. Public databases containing acceleration data for falls can be found in [11]–[14]. In [11], the authors present a dataset for mimicked falls. In fact, it is difficult to collect data of actual falls, especially from elderly. Most of the collected fall data in the literature involves young healthy adults. In general, these participants imitate a planned fall by plummeting on a mattress that can be different from unexpected falls in real life. In [11], the data was collected from the fall activities of 42 participants. Four types of falls were simulated, namely, forward fall, backward fall, lateral left fall, and lateral right fall.
In this paper, our main objective is to develop an accurate and robust fall and ADL classification method. We use the fall data from [11] together with the ADL data from [10] to evaluate the performance of our proposed machine learning solution. Since we combine data from two databases, it is difficult to compare
© 2018 IEEE. Personal use of this material is permitted. Permission from IEEE must be obtained for all other uses, in any current or future media, including reprinting/republishing this material for advertising or promotional purposes, creating new
our results to existing work in the literature. Previous studies mainly used statistical features of the acceler-ation signal, such as the mean and standard deviacceler-ation [15] to recognize human activities. Compared to these studies, our main contribution consists in using signal processing techniques to extract new features based on frequency domain properties of the acceleration. These new features are referred to as frequency domain features and allow a more accurate distinction between different activities. We utilize 70% of the data to train the classifier, while 30% of the data is used to test the trained classifier. The number of features used in our proposed solution is 66, which is much smaller than the number of features used in existing baseline solutions, whereas the accuracy of our solution is comparable to existing algorithms. We achieve an overall accuracy of 93.2% for the classification of ADL and falls. Moreover, the precision of our fall detection system reaches 100%.
The remainder of the paper is structured as follows. Section II describes the machine learning framework, the different blocks in this framework, and their role. The time domain and frequency domain features are presented and discussed in Section III. In Section IV, we evaluate the accuracy and the precision of our proposed solution and discuss the obtained results. Finally, Section V provides concluding remarks.
II. FRAMEWORKDESCRIPTION
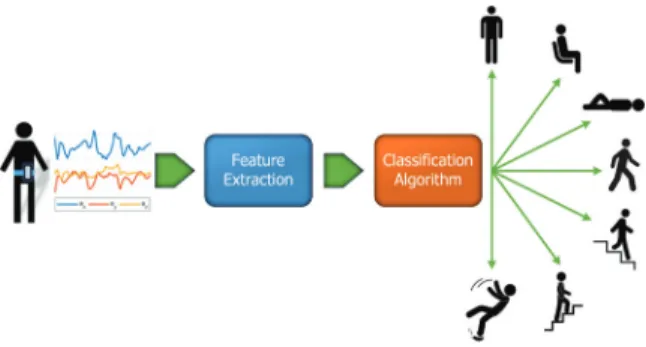
Our objective is to determine the user’s activity based on measured acceleration data. In this section, we explain the activity recognition strategy and provide an overview of the framework used for classifying ADLs and fall events. The activity recognition frame-work and its different building blocks are illustrated in Fig. 1. This framework comprises mainly: (i) the input acceleration data obtained from the smartphone accelerometer, (ii) the feature extraction block, and (iii) the classification algorithm. In the following, we discuss each component in this framework.
Fig. 1. Activity recognition framework.
A. Data Description and Preprocessing
The triaxial acceleration data is obtained from two public databases. The first database in [10] contains six classes of activities: walking, walking upstairs, walking downstairs, sitting, standing, and lying. The acceleration data was collected with a smartphone attached to the waist of the participants. A total of 30 participants were involved in this experiment. The collected acceleration data has been sampled at a sampling frequency of 50 Hz. The acceleration data has then been divided into buffers of 2.56 s length with 50% overlap. Each of these buffers is labeled with the corresponding actual activity using the ground truth. In addition to the ADL data set, we acquired acceleration data for fall events from the public database in [11].
Our objective is to have a system that can distinguish between seven kinds of activities: falling, walking, walking upstairs, walking downstairs, sitting, standing, and lying. Therefore, the data obtained from the two databases in [10] and [11] should be homogenous, since this acceleration data is provided as an input for the classification algorithm. To this end, we select the fall data from [11] associated with 30 subjects. This data is organized into buffers of length 2.56 s to make it consistent with the data from the first database [10]. The collected triaxial acceleration data can be written as ax(t) = agx(t) +a b x(t) (1) ay(t) = agy(t) +a b y(t) (2) az(t) = agz(t) +a b z(t) (3)
whereax(t),ay(t), andaz(t)stand for the acceleration data measured along thex-axis,y-axis, andz-axis, re-spectively. Note that the accelerationax(t)is expressed as a sum of two terms: (i) the gravity contribution to the acceleration along thex-axis denoted byag
x(t)and
(ii) the body acceleration along the x-axis referred to as ab
x(t). Similarly, ay(t) and az(t) are written as a
sum of two terms as shown in (2) and (3).
Intuitively, it would be easier to classify the activity based on the acceleration data that reflects the impact of the body movement on the measured acceleration. Therefore, it is of interest to eliminate the impact of gravity on the measured acceleration. In general, the contribution of gravity to the acceleration varies slowly and can even be considered constant relatively to the contribution of the body movement to the acceleration. This implies that it is possible to eliminate the gravity impact by applying a high-pass filter to the acceleration data. We use a Chebyshev filter of Type II [16] with a stopband frequency of 0.4 Hz and a stopband attenua-tion of 60 dB. Compared to Butterworth filters, Type II Chebyshev filters are sharper, which allows us to filter out the gravity contribution [16]. Moreover, Type II Chebyshev filters have no ripples for frequencies larger
than the passband frequency [16] which allows us to extract the contribution of the body movement in the acceleration signal without distortions.
B. Feature Extraction
In this section, we provide an overview of the feature extraction and highlight its importance in obtaining an accurate classification. As illustrated in Fig. 1, the ac-celeration signal is fed to the feature extraction block, whose output is used by the classification algorithm to recognize the activity performed by the user. Note that if the classification algorithm directly uses the raw acceleration signal to predict the user activity, it will be very difficult for the classifier to find a pattern allowing us to distinguish between different classes of activities, and thus the accuracy of the classifier would be very poor. Therefore, it is highly important to extract a finite set of measures which can characterize the underlying activity carried out by the user. This process is known as feature extraction in the realm of machine learning. The set of extracted features should capture quantitative descriptions allowing us to differentiate between different classes of activity. Typical features include statistical quantities extracted from the acceleration signal, such as the mean value, the standard deviation, and high-order moments.
In order to understand how feature extraction can help to determine the type of activity performed by the user, let us consider the following example. Suppose that the data collected pertains to two activities: lying and standing, and the aim is to classify these two activities correctly. By examining the acceleration data
az(t)associated with lying, it is found that the mean value of the acceleration is close to 0m s−2
, whereas for standing the mean value of the acceleration is around 10m s−2
. Now assume that we receive a new acceleration data buffer and that this acceleration data was obtained while the user was lying or standing. The objective now is to determine which activity was performed by the user: lying or standing? The feature extraction block evaluates the mean value for the received data buffer and forwards the value of this feature to the classification algorithm. This latter would decide that the performed activity is lying if the mean value of the acceleration dataaz(t)is close to 0 m s−2
. Otherwise, if the mean value of the acceleration data az(t) is close to 10 m s−2
, then the classification algorithm decides that the performed activity is standing. In this example, we classified the data pertaining to two activities: lying and standing. The utilized feature vector has a length equal to one and comprises the mean value of the accelerationaz(t). However, in our problem, we must distinguish between seven types of activities. Therefore, more features are required to obtain a good classification accuracy in our case. In Section III, we discuss in detail all the features
used in our proposed solution in order to achieve a high classification accuracy.
C. Classification Algorithm
The objective of the classification algorithm is to recognize the user activity based on the acceleration data. To achieve this objective, the classification al-gorithm has been exposed to a large set of labeled data1 and trained to recognize the different classes as accurately as possible. Afterwards, this trained classi-fication algorithm has been run on new data and can recognize to which class the new data belongs.
First, we recall that the data is organized in buffers of length 2.56 s. Each of these buffers is labeled with an activity identity (ID) indicating to which class the data buffer belongs. The activity IDs are numbered from 1 to 7. The activity IDs 1, 2, 3, 4, 5, 6, and 7 correspond to walking, walking upstairs, walking downstairs, sitting, standing, lying, and falling, respectively. For instance, if the acceleration buffer was recorded while the participant is standing, the buffer is labeled with the activity ID 5. For each buffer, we extract the set of features introduced in Section. III. After extracting the values of each feature from the acceleration signal, these features are stacked in a vector of length 66.
In a first step, the classification algorithm learns the pattern of each activity from the training data. During the training phase, the classification algorithm optimizes its internal parameters such that the classifi-cation error is minimized. Afterwards, the performance of the trained algorithm is assessed using the test data. For each new buffer of data, we first extract its features and generate the feature vector. The trained classification algorithm uses the feature vector as an input and determines the likelihood that this buffer belongs to one of the seven possible classes. The class with the highest score will be chosen by the algorithm as the one to which the buffer belongs. For instance, for a given buffer, if class 1 has the highest score, then the algorithm declares that the performed activity is walking. Using the ground truth (the label of the data), we can determine if the decision of the algorithm is correct or wrong. The classification algorithm predicts the performed activity for each buffer in the test data. Subsequently, we generate a confusion matrix that illustrates the accuracy of the classifier and the precision of its predictions. In our proposed solution, we test the performance of two different classification algorithms, namely, artificial neural network (ANN) and quadratic support vector machine (QSVM). Prin-ciples and background information about the ANN and the QSVM algorithms can be found in [17].
III. FEATUREEXTRACTION
In this section, we discuss the features which are extracted from the triaxial acceleration data. We ex-plain the methods used to extract these features and highlight the impact of each feature on improving the classification accuracy. The set of features can be divided into two main categories: time domain features and frequency domain features of the acceleration signal. The time domain features include the mean value, the root mean square, the main maxima and minima, and the peaks of the autocorrelation function (ACF) of the acceleration signal. The frequency do-main features comprise the do-main peaks of the power spectral density and the location of the spectral peaks of the acceleration signal.
The first statistical feature that we extract is the sample mean of the acceleration. This quantity is computed from the raw acceleration data without ap-plying any filtering. Investigating the raw acceleration data for different activities, it can be noticed that for activities where the human body is in a vertical position, such as standing and walking, the mean value of the accelerationax(t)is equal to 10m s−2
, whereas for lying the mean value ofax(t)is equal to 0m s−2
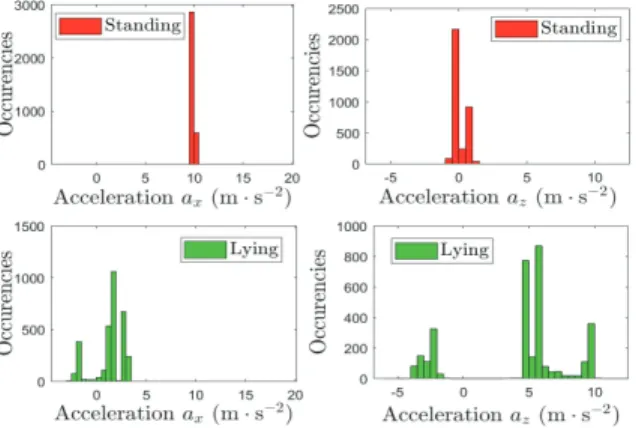
. This allows us to distinguish lying from other activities. In Fig. 2, we show the histogram of the accelerations
ax(t) and az(t) for the activities standing and lying. From this figure, we notice that the mean value of
ax(t) equals 10 m s−2
for standing, while the mean value ofax(t)is 0m s−2
for lying. On the other hand, the mean value of the acceleration az(t)for standing and lying equals 0m s−2
and 5m s−2
, respectively.
Fig. 2. Histogram of the accelerations ax(t) andaz(t)for the
activities standing and lying.
It is worth mentioning that for activities with vertical body posture, the orientation of the accelerometer axes is different compared to the axes orientation for lying. This fact leads to different mean values of ax(t) depending on the body posture (vertical or horizontal). Note first that for both standing and lying
the contribution of the body acceleration is negligible compared to the gravity. For standing, the contribution of the body acceleration is zero along all axes, whereas the gravitational field contribution equals 10 m s−2
along the x-axis of the accelerometer2. However, for lying the impact of the gravitational field is equal to 10 m s−2
along the z-axis of the accelerometer and 0 m s−2
along the x- and y-axes. From Fig. 2, we observe that the mean value of az(t) is 5 m s−2
for lying because in the collected data, the acceleration is recorded while the user is performing lying and during lying which makes the mean value of az(t)
smaller than 10 m s−2
. But even with this error, the extraction of the mean value of the acceleration allows an accurate classification of the lying activity. Note that this feature has not been considered in previous studies.
The second feature that we extract is the root mean square (RMS), also known as the quadratic mean. Before determining the RMS, the acceleration data is first preprocessed by a high-pass filter to remove the contribution of the gravitational field. Let us denote by˜ax(t)the filtered acceleration obtained fromax(t). The RMS of the acceleration can be expressed as
˜ armsx = s 1 T Z T 0 [˜ax(t)]2dt (4) whereT is the length of the buffer which is equal to 2.56 s.
The third feature is the main maxima and minima of the triaxial acceleration data. The acceleration data is filtered to remove the impact of gravity using a Type II Chebyshev filter. Afterwards, we apply a Savitzky-Golay filter to smooth the data and reduce the impact of noise [18]. The advantage of the Savitzky-Golay smoothing method is that it does not remove the peaks in the data, preserves the underlying pattern in the data, and reduces the noise. A closer look at the histogram of the different activities shows that the range of acceleration value depends on the performed activity. For example, the activities walking and standing have the same mean value, but the dynamic range of the accelerations is different. Thus, by using the maxima and minima of the acceleration, we can improve the classification accuracy for walking and standing. Note that the use of this feature allows enhancing the clas-sification of other activities as well.
It is worth to mention that the above features al-low distinguishing between activities that exhibit very different acceleration patterns, i.e., activities with dif-ferent acceleration mean values and variances. How-ever, for activities with similar statistical properties, the classification based on the above features would
2Thex-axis of the accelerometer corresponds to thez-axis of
result in poor accuracy. For instance, for the activities walking, walking upstairs, and walking downstairs, we notice that they have similar mean and variance. If the activity recognition algorithm uses only the above features, we observe a misclassification error larger than 15% for the activities walking, walking upstairs, and walking downstairs. To discriminate acceleration signals associated with these activities, we must inves-tigate how these acceleration signals vary over time. In particular, we need to measure the rate of oscillations of the acceleration. In fact, people tend to move faster when walking downstairs compared to walking upstairs which implies a higher rate of oscillations would be observed if the person is walking downstairs. We can measure the rate of oscillation of the acceleration signal and capture a quantitative description of the shape of these oscillations by exploring the signal power spectral density (PSD).
Our forth feature quantifies the rate of change and shape of the oscillation of the acceleration signal. This feature is extracted from the PSD of the body acceleration, which can be obtained as follows. First, we compute the ACFRab
x(τ)of the body acceleration ab x(t)as Rab x(τ) = 1 2T Z T −T abx(t+τ) abx(t) ∗ dτ. (5) Then, the PSDSab
x(f)of the body accelerationa b x(t)
can be obtained by applying the Fourier transform to the ACFRab x(τ)as Sab x(f) = Z ∞ −∞ Rab x(τ)e −j2πf τ dτ. (6)
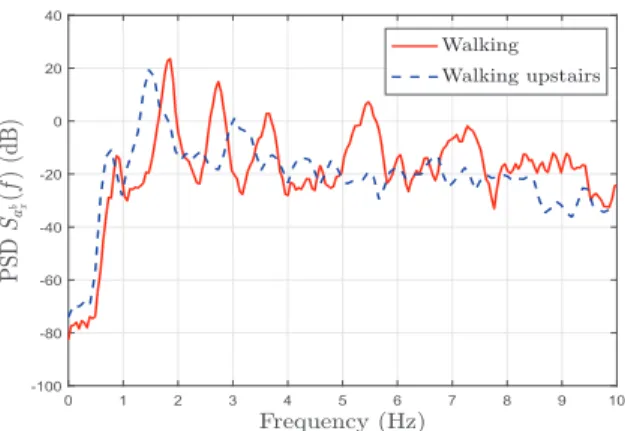
In Fig. 3, we illustrate the PSD Sab
x(f) of the
acceleration for the activities walking and walking upstairs. We notice from this figure that most of the information is confined to the range from 0 to 10 Hz. The pattern of the peaks in this range holds useful information on the rate and shape of time domain oscillations. In the PSD curve for walking, we observe a fundamental frequencyf0around 1 Hz and a number
of harmonics at positions that are multiples off0. The
spacing between the peaks in the frequency domain indicates the rate of oscillation of the signal while the relative amplitudes of the peaks are closely related to the shape of the oscillations. By comparing the PSD associated with the activities walking, and walking upstairs, it can be observed that the peaks for walking upstairs are closer together and pushed to the left. This implies that the rate of oscillation is lower for walking upstairs. In addition, for the activity walking upstairs, the amplitude of the peaks to the right of the fundamental decreases quickly, which implies that the shape of the oscillation is smoother compared to walking. By extracting the values of the peaks and their
locations from the PSD, we can distinguish between walking, walking downstairs, and walking upstairs. We recall that the use of other features, such as the mean, the RMS, and the maxima does not yield an accu-rate classification for these activities. The proposed frequency domain feature enhances the accuracy of the classification algorithm, especially for the activities walking, walking downstairs, and walking upstairs.
The fifth feature is extracted from the ACF of the acceleration signal. More specifically, we estimate the values and the location of the first maximum and the second peak of the acceleration ACF. These features hold information pertaining to the rate and shape of change of the oscillation of the acceleration signal. Such features can improve the classification of activi-ties that have similar statistical properactivi-ties (i.e., similar mean values and variances) but have a different rate and shape of oscillations.
0 1 2 3 4 5 6 7 8 9 10 -100 -80 -60 -40 -20 0 20 40
Fig. 3. PSD of the acceleration pertaining to the activities walking and walking upstairs.
IV. EXPERIMENTALRESULTS
In this section, we assess the performance of the proposed activity recognition framework. The dataset is divided into two random independent sets: the train-ing set and the test set. We use 70% of the data for training and 30% for testing. In our investigation, we evaluate the performance of the ANN and the QSVM classification algorithms. To illustrate the importance of the proposed features in improving the accuracy of the classification, we arrange the features into three subsets: Subset A, Subset B, and Subset C. Subset A includes the mean value of the triaxial acceleration which is referred to as the first feature in Section III. Subset B encompasses the features from Subset A augmented with the features extracted from the PSD and the ACF of the acceleration which represent the fourth and the fifth features as described in Section III. Finally, Subset C comprises the features from Subset B as well as the RMS and the main maxima and minima
of the acceleration. In other words, the feature vector for Subset C has a length of 66 and contains all the features extracted from the acceleration data.
We consider an ANN classification algorithm having one hidden layer. This latter comprises 25 nodes. The performance of this ANN algorithm is assessed using the features of the Subsets A, B, and C. The results for the classification accuracy of the ANN algorithm are presented in Table. I. From this table, we notice that as we use a larger set of features, the overall accuracy of the classifier is enhanced. For instance, for the walking activity the accuracy of the classifier is equal to 25.2% if we use the features from Subset A. By including the features stemming from the PSD and the ACF of the acceleration signal (i.e., using the feature from Subset B), the accuracy of the classifier for the walking activity is improved by more than 60%. The features related to the shape and rate of the oscillation of the acceleration signal allow improving the classification accuracy for most activities. From Table. I, we notice that the classification accuracy for the activities walking upstairs, walking downstairs, and standing is enhanced by 11.8%, 39.2%, and 43.7%, respectively, if we use the features from Subset B instead of those from Subset A. The classification accuracy is improved furthermore by using the features in Subset C. For falling events, the probability of fall detection using the Subset C of features is equal to 96.8%, whereas for lying the accuracy of the ANN algorithm is 100%. In Table. II, we illustrate the
TABLE I
ACCURACY OF THEANNCLASSIFIER FOR VARIOUS ACTIVITIES AND DIFFERENT FEATURESUBSETS.
Accuracy %
Features Wal. Up. Dow. Sit. Sta. Ly. Fal. Overall Subset A 25.2 67 33.4 85.2 41.7 100 96.8 62.4 Subset B 85.6 78.8 72.6 80.8 85.4 100 93.8 85.1 Subset C 88.4 81.3 84.1 84.8 83 100 96.8 87.8
precision of the ANN classification algorithm when using the features from the Subsets A, B, and C. This table shows that all fall events predicted by the algorithm are real falls and there is no false alarm in this case regardless of whether we use Subset A, B, or C. However, for the walking activity, the rate of false alarm decreases as the set of features used increases. For instance, the classification precision of walking increases by 48.2% by using the features from Subset B instead of those from Subset A. The precision for recognizing the activities walking upstairs, walking downstairs, sitting, and standing is enhanced by 28.6%, 28.1%, 8.3%, and 47.2%, respectively, if we use the features from Subset C instead of the features from Subset A. Fig. 4 represents the confusion matrix for the ANN classifier obtained using the features from
TABLE II
PRECISION OF THEANNCLASSIFIER FOR VARIOUS ACTIVITIES AND DIFFERENT FEATURESUBSETS.
Precision %
Features Wal. Up. Dow. Sit. Sta. Ly. Fal. Overall Subset A 29.4 56.1 57.9 75.5 36.3 99.5 100 62.4 Subset B 77.6 79.9 80.8 83.7 82 99.8 100 85.1 Subset C 84.2 84.7 86 83.8 83.5 99.8 100 87.8
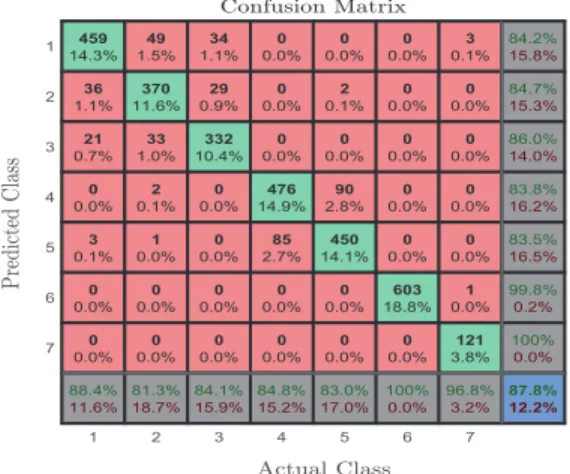
Subset C. In this figure, the diagonal cells show the number and the percentage of correct classification by the trained ANN network. For instance, in 459 cases the classifier correctly predicts the walking activity. These 459 cases represent 14.3% of the total number of buffers that are being classified during the test phase by the trained ANN classifier. Similarly, the ANN algorithm successfully predicted the class of 370, 332, 476, 450, 603, and 121 data buffers as pertaining to the activities walking upstairs, walking downstairs, sitting, standing, and falling, respectively. By looking
1 2 3 4 5 6 7 1 2 3 4 5 6 7 459 14.3% 36 1.1% 21 0.7% 0 0.0% 3 0.1% 0 0.0% 0 0.0% 88.4% 11.6% 49 1.5% 370 11.6% 33 1.0% 2 0.1% 1 0.0% 0 0.0% 0 0.0% 81.3% 18.7% 34 1.1% 29 0.9% 332 10.4% 0 0.0% 0 0.0% 0 0.0% 0 0.0% 84.1% 15.9% 0 0.0% 0 0.0% 0 0.0% 476 14.9% 85 2.7% 0 0.0% 0 0.0% 84.8% 15.2% 0 0.0% 2 0.1% 0 0.0% 90 2.8% 450 14.1% 0 0.0% 0 0.0% 83.0% 17.0% 0 0.0% 0 0.0% 0 0.0% 0 0.0% 0 0.0% 603 18.8% 0 0.0% 100% 0.0% 3 0.1% 0 0.0% 0 0.0% 0 0.0% 0 0.0% 1 0.0% 121 3.8% 96.8% 3.2% 84.2% 15.8% 84.7% 15.3% 86.0% 14.0% 83.8% 16.2% 83.5% 16.5% 99.8% 0.2% 100% 0.0% 87.8% 12.2%
Fig. 4. Confusion matrix obtained using the ANN algorithm.
at a given row of the confusion matrix in Fig. 4, we can evaluate the prediction precision for a given class. For instance, let us consider the fourth row which corresponds to sitting. The activity sitting is correctly predicted in 476 cases and wrongly predicted in 92 cases, which implies a precision of 83.8% for the predictions of sitting activity. The activities standing and walking upstairs are misclassified as sitting, in 90 and 2 cases, respectively. Out of 568 sitting predictions, 92 predictions are wrong which represents 16.2%.
By observing a given column of the confusion matrix in Fig. 4, it is possible to assess the accuracy of the algorithm for a given class. For example, con-sidering the falling events which are represented over the seventh column. In total there are 125 fall events in the considered test data. In 121 cases, the fall events are correctly recognized by the classifier which yields an accuracy of 96.8%. The classifier fails to recognize fall events in 4 cases which implies that 3.2% of the classifications for fall events are unsuccessful. Overall the ANN classifier was able to successfully predict the
user activity in 87.8% of the cases.
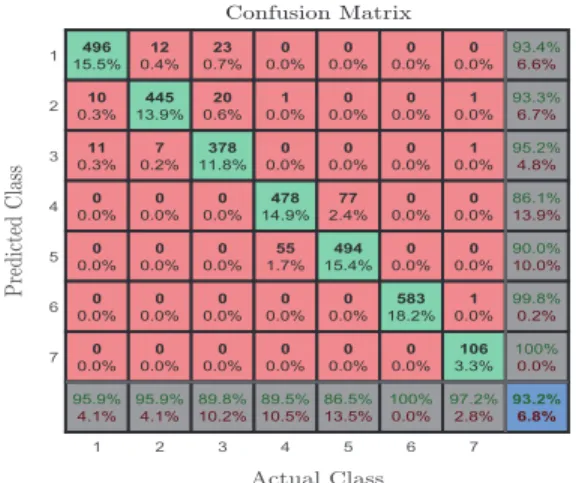
In Fig. 5, we present the confusion matrix for the QSVM classifier. By comparing the confusion matrix for the ANN algorithm to that of the QSVM algorithm, we notice that the QSVM algorithm outperforms the ANN algorithm in terms of the overall accuracy. An improvement of 5.4% in overall accuracy is achieved when using the QSVM algorithm instead of the ANN algorithm. Moreover, the QSVM algorithm enhances the accuracy of the classification for walking, walking upstairs, walking downstairs, sitting, standing, and falling by 7.5%, 14.6%, 5.7%, 4.7%, 3.5%, and 0.4%, respectively. In terms of precision, the QSVM algo-rithm performs better than the ANN algoalgo-rithm. More specifically, for the activities walking, walking upstairs, walking downstairs, sitting, and standing a precision improvement of 9.2%, 8.6%, 9.2%, 2.3%, and 6.5%, respectively, has been achieved by using the QSVM algorithm. 1 2 3 4 5 6 7 1 2 3 4 5 6 7 496 15.5% 10 0.3% 11 0.3% 0 0.0% 0 0.0% 0 0.0% 0 0.0% 95.9% 4.1% 12 0.4% 445 13.9% 7 0.2% 0 0.0% 0 0.0% 0 0.0% 0 0.0% 95.9% 4.1% 23 0.7% 20 0.6% 378 11.8% 0 0.0% 0 0.0% 0 0.0% 0 0.0% 89.8% 10.2% 0 0.0% 1 0.0% 0 0.0% 478 14.9% 55 1.7% 0 0.0% 0 0.0% 89.5% 10.5% 0 0.0% 0 0.0% 0 0.0% 77 2.4% 494 15.4% 0 0.0% 0 0.0% 86.5% 13.5% 0 0.0% 0 0.0% 0 0.0% 0 0.0% 0 0.0% 583 18.2% 0 0.0% 100% 0.0% 0 0.0% 1 0.0% 1 0.0% 0 0.0% 0 0.0% 1 0.0% 106 3.3% 97.2% 2.8% 93.4% 6.6% 93.3% 6.7% 95.2% 4.8% 86.1% 13.9% 90.0% 10.0% 99.8% 0.2% 100% 0.0% 93.2% 6.8%
Fig. 5. Confusion matrix obtained using the QSVM algorithm.
V. CONCLUSION
In this paper, we have proposed a machine learning approach for fall detection and ADL recognition. We have tested the performance of two algorithms in clas-sifying the acceleration data pertaining to the activities falling, walking, walking upstairs, walking downstairs, sitting, standing, and lying. We have proposed new features which are extracted from the acceleration signal. We have demonstrated the importance of these features and their positive impact on enhancing the accuracy of the classifier. Moreover, we have tested the performance of the ANN and the QSVM classification algorithms on real-world acceleration data obtained from public databases. The internal parameters of these algorithms have been optimized using the training data. Afterwards, the performance of the trained algorithms is assessed using the test data. Our investigation re-veals that the QSVM algorithm outperforms the ANN
algorithm in terms of overall accuracy. Both algorithms yield more than 95% accuracy in terms of fall detec-tion.
REFERENCES
[1] “World Health Organization: Global report on falls prevention in older age.” [Online]. Available: http://www.who.int/ageing/ publications/Falls prevention7March.pdf
[2] B. Bergen and M. Stevens, “Falls and fall injuries among adults aged 65 years – United States, 2014,” 2016. [Online]. Available: http://dx.doi.org/10.15585/mmwr.mm6537a2 [3] E. R. Burns, J. A. Stevens, and R. Lee, “The direct costs of
fatal and non-fatal falls among older adults – United States,”
Journal of Safety Research, vol. 58, pp. 99–103, Sep. 2016. [4] R. Igual, C. Medrano, and I. Plaza, “Challenges, issues and
trends in fall detection systems,” BioMedical Engineering OnLine, vol. 12, no. 1, pp. 1–24, Jul. 2013.
[5] O. P. Popoola and K. Wang, “Video-based abnormal human be-havior recognition–A review,”IEEE Transactions on Systems, Man, and Cybernetics, Part C (Applications and Reviews), vol. 42, no. 6, pp. 865–878, Nov. 2012.
[6] H. A. Nguyen and J. Meunier, “Gait analysis from video: camcorders vs. kinect,” in International Conference Image Analysis and Recognition (ICIAR 2014). Vilamoura, Portugal: Springer, Oct. 2014, pp. 66–73.
[7] R. K. Tripathy, L. N. Sharma, S. Dandapat, B. Vanrumste, and T. Croonenborghs, “Bridging the gap between real-life data and simulated data by providing a highly realistic fall dataset for evaluating camera-based fall detection algorithms,”Healthcare Technology Letters, vol. 3, no. 1, pp. 6–11, Mar. 2016. [8] K. Sehairi, F. Chouireb, and J. Meunier, “Comparative study
of motion detection methods for video surveillance systems,”
Journal of Electronic Imaging, vol. 26, no. 2, pp. 26–29, Apr. 2017.
[9] J. Klonovs et al., Distributed Computing and Monitoring Technologies for Older Patients, 1st ed. London, UK: SpringerBriefs in Computer Science, 2016.
[10] D. Anguita, A. Ghio, L. Oneto, X. Parra, and J. L. Reyes-Ortiz, “A public domain dataset for human activity recognition using smartphones,” in European Symposium on Artificial Neural Networks, Computational Intelligence and Machine Learning, Bruges, Belgium, Apr. 2013, pp. 24–26.
[11] O. Ojetola, E. Gaura, and J. Brusey, “Data set for fall events and daily activities from inertial sensors,” inProceedings of the 6th ACM Multimedia Systems Conference - MMSys ’15, Portland, OR, USA, Mar. 2015, pp. 243–248.
[12] A. Wertner, P. Czech, and V. Pammer-Schindler, “An open labelled dataset for mobile phone sensing based fall detection,” in Proceedings of the 12th EAI International Conference on Mobile and Ubiquitous Systems: Computing, Networking and Services (MOBIQUITOUS 2015), Coimbra, Portugal, Jul. 2015, pp. 277–278.
[13] A. Sucerquia, J. D. L´opez, and J. F. Vargas-Bonilla, “SisFall: A fall and movement dataset,”Sensors, vol. 17, no. 1, pp. 1–14, Jan. 2017.
[14] E. Casilari, J. A. Santoyo-Ram´on, and J. M. Cano-Garc´ıa, “Analysis of a smartphone-based architecture with multiple mobility sensors for fall detection,” PLoS ONE, vol. 11, pp. 1–17, Dec. 2016.
[15] A. M. Khan, Y.-K. Lee, S. Y. Lee, and T.-S. Kim, “Human activity recognition via an accelerometer-enabled-smartphone using kernel discriminant analysis,” in2010 5th International Conference on Future Information Technology, Busan, South Korea, May 2010, pp. 1–6.
[16] A. B. Williams and F. J. Taylor, Electronic Filter Design Handbook, 4th ed. New York, USA: McGraw-Hill, 2006. [17] C. M. Bishop, Pattern Recognition and Machine Learning,
1st ed. Cambridge, UK: Springer, 2006.
[18] R. W. Schafer, “What is a Savitzky-Golay filter? [Lecture notes],”IEEE Signal Processing Magazine, vol. 28, no. 4, pp. 111–117, Jul. 2011.