Identification of Genes Transcriptionally
Responsive to the Loss of MLL Fusions in
MLL
-Rearranged Acute Lymphoblastic Leukemia
Marieke H. van der Linden1, Lidija Seslija1, Pauline Schneider1, Emma M. C. Driessen1,Patricia Garrido Castro1, Dominique J. P. M. Stumpel1, Eddy van Roon1, Jasper de Boer2, Owen Williams2, Rob Pieters1,3, Ronald W. Stam1*
1Department of Pediatric Oncology/Hematology, Erasmus MC—Sophia Children’s Hospital, Rotterdam, The Netherlands,2Molecular Haematology and Cancer Biology Unit, University College London Institute of Child Health and Great Ormond Street Hospital for Children, London, United Kingdom,3Princess Maxima Center for Pediatric Oncology, Utrecht, The Netherlands
*r.stam@erasmusmc.nl
Abstract
Introduction
MLL-rearranged acute lymphoblastic leukemia (ALL) in infants (<1 year) is characterized by high relapse rates and a dismal prognosis. To facilitate the discovery of novel therapeutic targets, we here searched for genes directly influenced by the repression of various
MLLfusions.
Methods
For this, we performed gene expression profiling after siRNA-mediated repression of
MLL-AF4,MLL-ENL, andAF4-MLLinMLL-rearranged ALL cell line models. The obtained results were compared with various already established gene signatures including those consisting of known MLL-AF4 target genes, or those associated with primaryMLL-rearranged infant ALL samples.
Results
Genes that were down-regulated in response to the repression ofMLL-AF4andMLL-ENL appeared characteristically expressed in primaryMLL-rearranged infant ALL samples, and often represented knownMLL-AF4targets genes. Genes that were up-regulated in re-sponse to the repression ofMLL-AF4andMLL-ENLoften represented genes typically si-lenced by promoter hypermethylation inMLL-rearranged infant ALL. Genes that were affected in response to the repression ofAF4-MLLshowed significant enrichment in gene expression profiles associated withAF4-MLLexpressing t(4;11)+ infant ALL patient samples.
OPEN ACCESS
Citation:van der Linden MH, Seslija L, Schneider P, Driessen EMC, Castro PG, Stumpel DJPM, et al. (2015) Identification of Genes Transcriptionally Responsive to the Loss of MLL Fusions inMLL -Rearranged Acute Lymphoblastic Leukemia. PLoS ONE 10(3): e0120326. doi:10.1371/journal. pone.0120326
Academic Editor:Bruno Verhasselt, Ghent University, BELGIUM
Received:August 17, 2014
Accepted:January 20, 2015
Published:March 20, 2015
Copyright:© 2015 van der Linden et al. This is an open access article distributed under the terms of the Creative Commons Attribution License, which permits unrestricted use, distribution, and reproduction in any medium, provided the original author and source are credited.
Data Availability Statement:Gene expression profiles for the patient samples were deposited as GSE13351 and GSE19475 as part of recently published studies in the National Center for Biotechnology Information Gene Expression Omnibus.
Funding:This research was funded by KIKA (Stichting Kinderen Kankervrij, project no. 18), and RWS was financially supported by KWF Kankerbestrijding (Dutch Cancer Society). The funders had no role in study design, data collection
Conclusion
We conclude that the here identified genes readily responsive to the loss ofMLLfusion ex-pression potentially represent attractive therapeutic targets and may provide additional in-sights inMLL-rearranged acute leukemias.
Introduction
A hallmark of acute lymphoblastic leukemia (ALL) in infants (<1 year of age) is a high
inci-dence (*80%) of chromosomal translocations involving theMixed Lineage Leukemia(MLL)
gene [1,2], in which the N-terminal portion ofMLLfuses to the C-terminal region of one of its
many translocation partner genes. [3] The most commonMLLtranslocations found among
in-fant ALL patients are t(4;11), t(11;19), and t(9;11), fusingMLLtoAF4,ENLandAF9,
respec-tively. [2,4]MLL-rearranged infant ALL is associated with an adverse outcome, with
event-free survival rates of only*30–40%. [2]
MLL-rearranged ALL cells display unique gene expression profiles, consisting of
over-whelming numbers of differentially transcribed genes [5,6], which make it difficult to
distin-guish between the actual“drivers”of the leukemia from the so called“bystanders”. Fortunately,
recent advances allowed the identification of genes likely to be activated by MLL fusion
pro-teins via the recruitment of DOT1L. [7–9] Yet, apart from MLL fusion driven activation of
gene transcription, inactivation of transcription also plays an important role inMLL
-rear-ranged ALL. We and others, recently demonstrated thatMLL-rearranged infant ALL is
charac-terized by unique patterns of gene promoter DNA hypermethylation, leading to transcriptional
silencing of associated genes. [10,11] To make matters even more complicated, more than half
of the t(4;11)-positive ALL patients not only carry theMLL-AF4fusion transcript, but also
ex-press and translate the reciprocalAF4-MLLtranscript, which has been proposed to
substantial-ly contribute, or even being essential, for leukemia development.[12,13]
Here, we studied the direct transcriptional consequences of the loss of MLL fusion tran-scripts in order to identify potential target genes for therapeutic intervention. For this, we
per-formed gene expression profiling inMLL-rearranged ALL cell line models in whichMLL-AF4,
AF4-MLLorMLL-ENLexpression was repressed by siRNA-mediated RNA interference. We postulate that genes directly responding to the loss of the MLL fusion represent important ther-apeutic targets and may provide additional insights into the actions of MLL fusion proteins.
Methods
Note: More detailed descriptions of all experimental procedures and data analysis methods can
be found in the Supplemental Materials (S1 File).
Cell line models
The B-ALL cell lines RS4;11 and SEMK2 both carry translocation t(4;11) generating the
MLL-AF4andAF4-MLLfusion transcripts. KOPN-8 carries a t(11;19) translocation generating
MLL-ENLtranscripts. RS4;11 was established from the bone marrow of a 32-year-old woman
[14], and was purchased from the German Collection of Microorganisms and Cell Cultures
(DSMZ). SEMK2 is a subclone of the SEM cell line, which was originally derived from a
5-year-old girl at relapse [15] and was kindly provided by Dr Scott Armstrong (Memorial Sloan
MLLFusion Knockdown Gene Expression Profiling
and analysis, decision to publish, or preparation of the manuscript.
Competing Interests:The authors have declared that no competing interests exist.
Kettering Cancer Center, New York, USA). KOPN-8 was derived from a 3-month-old infant
girl with B-cell precursor ALL and was purchased from DSMZ.[16]
siRNA-mediated RNA interference
Cells were transfected with siRNAs directed againstMLL-AF4[17],AF4-MLL[13], orMLL-ENL
(sense 5’-CCAAAAGAAAAGUCUGCCCAG-3; antisense 5’-CUGGGCAGACUUUUCUUUU
GGUU-3’), using electroporation. Control cells were transfected with siRNAs againstAML1-MTG8
(AGF1) [18], a fusion transcript absent in both SEMK2 and RS4;11 cells. For the knock-down of
MLL-AF4andMLL-ENL, cells were harvested after two days. For theAF4-MLLknock-down, cells were transfected with siRNAs a second time after two days of culturing, and eventually harvested at day 4. All experiments were performed at least three times.
RNA extraction
Total RNA was extracted from a minimum of 2x10⁶cells using TRIzol reagent (Invitrogen,
Life Technologies, Breda, The Netherlands) according to manufacturer’s guidelines.
Gene expression profiling
Gene expression profiling was performed using HU133plus2.0 microarrays (Affymetrix)
ac-cording to manufacturer’s guidelines. Gene expression profiles for the primary infant ALL
patients samples were generated and published previously [19].
Results
Transcriptional consequences of MLL fusion knock-down
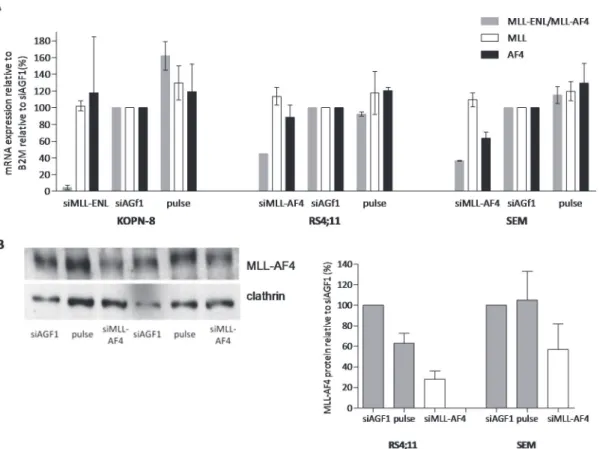
Compared to cells transfected with control siRNAs,MLL-AF4mRNA expression was reduced
to 45% and 37% in the t(4;11)-positive ALL cell lines RS4;11 and SEMK2, respectively, upon
transfection with siRNAs directed againstMLL-AF4. Using siRNAs directed againstMLL-ENL,
the level ofMLL-ENLexpression in KOPN-8 cells was reduced to 5% (Fig. 1A). Western blot
analysis demonstrated a reduction of the MLL-AF4 protein expression (relative to control
cells) of 28% and 52% in RS4;11 and SEMK2 cells, respectively (Fig. 1B).
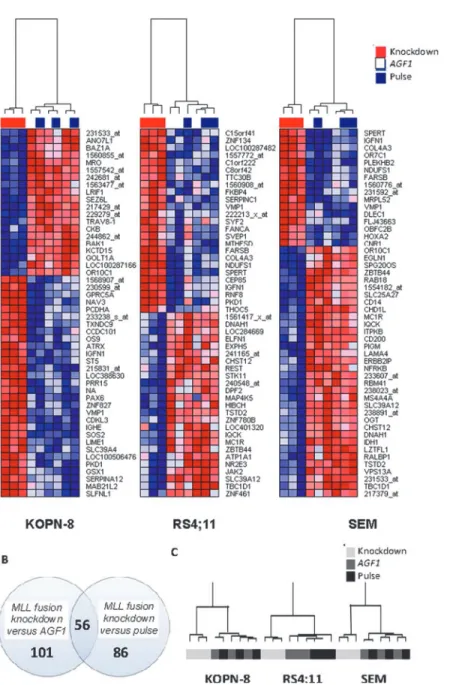
Next, in order to identify genes directly responding to the loss of the MLL fusion, we gener-ated gene expression profiles (HU133plus2.0 GeneChips, Affymetrix) in three independent
ex-periments. Upon repression ofMLL-ENLin KOPN-8 cells, significant differential expression
was observed for 342 probe sets (p<0.001). Reduced expression ofMLL-AF4resulted in
signifi-cantly (p<0.001) altered expression of 26 probe sets in RS4;11 cells, and 145 probe sets in
SEMK2 cells.Fig. 2Ashows heatmaps displaying the most significantly altered probe sets for
all three cell lines.
We searched for a core signature of genes consistently affected inall cell lines by performing a paired analysis of all samples in which the MLL fusion was suppressed (including SEMK2, RS4;11, and KOPN8), compared to all control samples, including cells transduced with control
siRNAs directed againstAML1-MTG8(AFG1), as well as control cells electroporated in the
ab-sence of siRNAs. Compared to cells transfected with control siRNAs, 101 probe sets appeared to be recurrently affected in all cell lines. Compared to cells only subjected to electroporation in the absence of siRNAs (i.e. pulse control), 86 probe sets were differentially expressed. Merging these analyses, we found 56 overlapping probe sets to be recurrently differentially expressed in
all cell lines in which the MLL fusions were suppressed (Fig. 2B). Hierarchical clustering
analy-sis showed that these 56 probe sets effectively distinguished between cells in which the MLL
As these probe sets consistently responded to the loss of the MLL fusion, we postulate that this gene signature represents genes which are highly dependent on the presence of the MLL fusion, and as such may exert prominent functions in MLL fusion driven transformation. Probe set IDs, HGNC gene symbols, and log-fold changes of the obtained core signature consisting of
the 56 probe sets are listed in the supplemental (S1andS2Tables). HGNC gene symbols from
these 56 probe sets can also be found next to the heatmap inFig. 3.
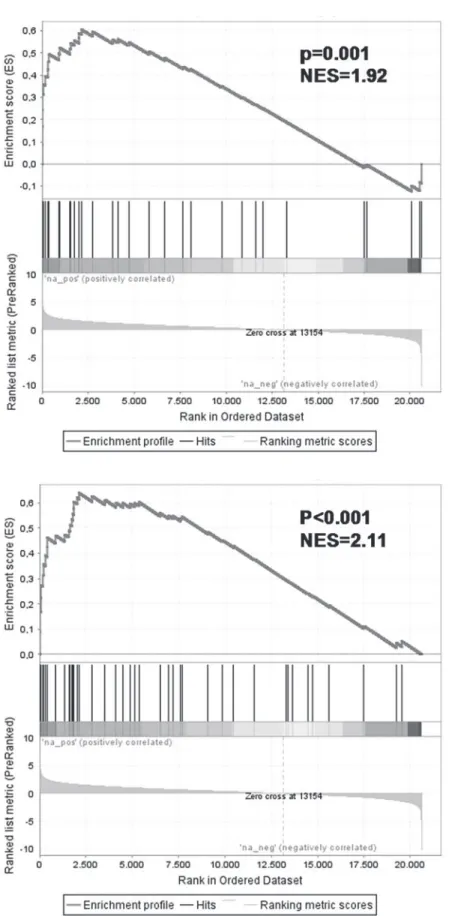
Relevance of the MLL fusion knock-down signature
To explore the relevance of the obtained gene signature consisting of 56 probe sets responsive to the knock-down of the MLL fusion, we compared our signature to that of earlier published
gene sets associated withMLL-rearranged ALL. The first signature, published by Guenther
et al[8], contains 42 genes occupied by the MLL-AF4 fusion protein. The second gene set
pub-lished by Krivtsovet al[7] consists of genes associated with MLL fusion mediated H3K79
dimethylation. Gene set enrichment analysis (GSEA) showed significant enrichment of these genes in our MLL fusion knock-down gene signature (normalized enrichment scores (NES) of
1.92 and 2.11 respectively; leading edge inS3 TableandS4 Tablerespectively) (Fig. 3). These
Fig 1. siRNA-mediated knock-down significantly decreases MLL fusion expression levels.(A) mRNA expression levels ofMLL-ENL(grey), wild-type MLL(white), and wild-typeENL(black) in KOPN-8 cells, orMLL-AF4(grey), wild-typeMLL(white) and wild-typeAF4(black) in RS4;11 and SEMK2 cells after transfection with active siRNA directed against the absent targetAML1/MTG8(siAGF1), empty pulse (no siRNAs), and siRNAs directed against MLL-ENLandMLL-AF4respectively. Shown is the average mRNA expression of two experiments±standard error of the mean. (B) Protein expression levels of MLL-AF4 in RS4;11 and SEMK2 shown by western blot (left panel). The western blot was probed with antibodies against the N-terminus of MLL to detect MLL-AF4. Clathrin was used as a loading control. The graph (right panel) shows western blot quantification of MLL-AF4 protein expression relative to clathrin with the empty pulse control set at 100%.
doi:10.1371/journal.pone.0120326.g001
Fig 2. Differential gene expression in response to the repression of MLL-AF4 and MLL-ENL.(A) Heatmap visualization of gene expression profiles (Affymetrix HGU133plus2.0 GeneChips) of the top 50 most differentially expressed genes in response toMLL-ENLknock-down in KOPN-8 cells, andMLL-AF4 knock-down in RS4;11 and SEMK2 cells, as compared to control cells transfected with siAGF1or electroporated in the absence of siRNAs (pulse control). The presented data was derived from samples obtained from three independent experiments. Red depicts high expression, blue depicts low expression. (B) Venn diagram showing the number of differentially expressed genes (p<0.001) in KOPN-8, RS4;11, and SEMK2 cells transfected with siRNAs againstMLL-ENLandMLL-AF4, combined (MLLfusion knock-down, n = 9) versus control cells transfected with siAGF1(AGF1control, n = 9), versus control cells electroporated in the absence of siRNAs (pulse control n = 9). All probe sets and gene symbols are listed inS1andS2 Tables. (C) Hierarchical clustering based on 56 differentially expressed probe sets recurrently affected in both KOPN-8, RS4;11, and SEMK2 cells uponMLLfusion knock-down (light grey), in control samples transfected with siAGF1(dark grey), and control samples electroporated in the absence of siRNAs (black).
Fig 3. Genes responsive to the repression of MLL-ENL and MLL-AF4 often represent known MLL-AF4 target genes.Gene set enrichment analysis (GSEA) of the 56 differentially expressed probe sets recurrently MLLFusion Knockdown Gene Expression Profiling
data indicate that some, but not all, genes transcriptionally activated by the MLL fusion gene it-self, rapidly respond to the loss of the MLL fusion.
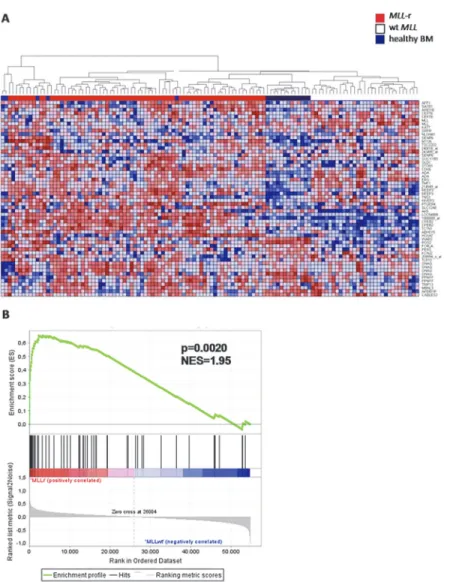
Moreover, using our core signature consisting of 56 probe sets associated with knock-down of the MLL fusion, we performed hierarchical clustering on gene expression profiling data
gener-ated on a large cohort of primaryMLL-rearranged infant ALL (n = 71), wild-typeMLLpediatric
precursor B-ALL (n = 16), and wild-typeMLLinfant ALL (n = 20) samples, as well as healthy
bone marrow samples (n = 13) as non-leukemic controls. Based on these 56 probe sets,MLL
-re-arranged ALL samples could almost be flawlessly separated from ALL samples with wild-type
MLLgenes (Fig. 4A). These data imply that our MLL fusion knock-down signature represents
genes highly characteristic forMLL-rearranged ALL. Similarly, gene set enrichment analysis
(GSEA) showed strong enrichment in theMLL-rearranged patients of the 57 probe sets that are
significantly lower expressed after MLL fusion knock-down (NES = 1.95, p = 0.002) (Fig. 4B,
dataset inS5 Table; leading edge inS6 Table).
Pathway analysis using the database for annotation, visualization, and integrated discovery (DAVID) demonstrated a significant number of genes transcriptionally responsive to the loss of MLL fusion expression to be involved in the KEGG focal adhesion pathway (hsa04510, p<0.0001) and the KEGG small cell lung cancer pathway (hsa05222, p = 0.008). Next, we used Ingenuity pathway analysis (IPA) to explore possible upstream regulators of the genes down-regulated upon the loss of MLL fusion expression. This revealed 30 potential regulators
includ-ing 5 genes (i.e.HOXA7,LIN28B,UPF1,EZH2, andMBD1), and 25 miRNAs (seeS7 Table).
Interestingly, the majority (i.e. 17 out of the 25) of the miRNAs that potentially regulate the
genes down-regulated uponMLLfusion knock-down, are predicted to target eitherMLL(i.e.
KMT2A) orAF4(i.e.AFF1), or both. Hence, the genes observed to be transcriptionally
respon-sive to the loss ofMLLfusions, likely represent genes controlled by the MLL fusion itself.
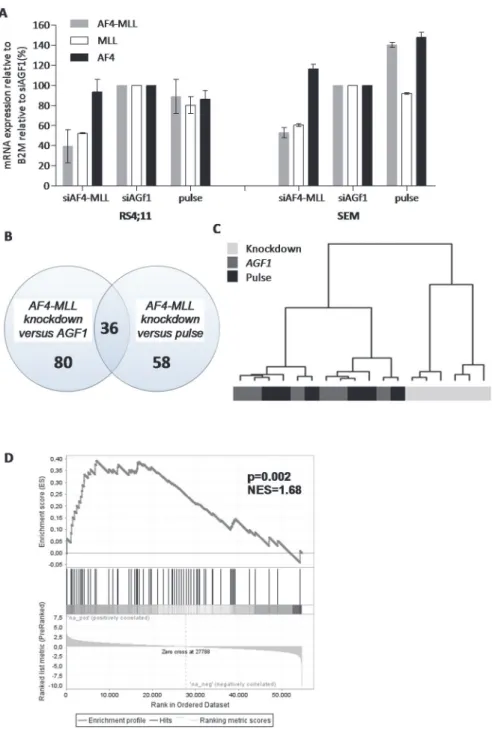
Transcriptional consequences of AF4-MLL knock-down
Using siRNAs directed againstAF4-MLLpreviously reported by Kumaret al. [13], we managed
to reduce expression ofAF4-MLLmRNA to*40% in RS4;11 and*53% in SEMK2 cells, as
compared with cells transfected with control siRNAs (Fig. 5A). In these experiments, the
ex-pression of wild-typeAF4was not affected. However, despite numerous attempts, we were not
able to prevent reduction of wild-typeMLLexpression to comparable levels of that of the
AF4-MLLtranscript (Fig. 5A). Paired differential gene expression analysis between samples with a
knock-down ofAF4-MLL(n = 6) and samples transfected with control siRNAs (n = 6) revealed
80 differentially expressed probe sets (p<0.001). The same analysis comparingAF4-MLL
knock-down samples with control cells electroporated in the absence of siRNAs (i.e. pulse con-trol) (n = 6), revealed 58 differentially expressed probe sets. A total of 36 overlapping probe
sets (corresponding to 22 genes) were differentially expressed in both comparisons (Fig. 5B).
Probe set IDs, HGNC gene symbols, log-fold changes and p-values are listed inS8 Tableand
S9 Table. Based on these 36 probe sets, hierarchical clustering could effectively separate
AF4-MLLknock-down samples from control samples (Fig. 5C).
To validate theAF4-MLLknock-down signature, we compared our signature to a gene set
pub-lished by Gaussmannet alconsisting ofAF4-MLLfusion target genes, [20] GSEA showed a
signif-icant enrichment of theseAF4-MLLtarget genes in ourAF4-MLLgene signature (NES = 1.68,
p = 0.002) (Fig. 5D).
affected in both KOPN-8, RS4;11, and SEMK2 cells uponMLLfusion knock-down in gene lists consisting of MLL-AF4 target genes as published by Guenther et al. (8) (left) and Krivtsov et al. (7) (right).
NES = normalized enrichment score.
Using our previously published gene expression profiling data, we compared
t(4;11)-posi-tive infant ALL samples which do and do not express the reciprocalAF4-MLLfusion product,
as determined by PCR analysis. This comparison revealed 403 probe sets differentially
express-ed between both patient groups (p = 0.01).Fig. 6Ashows a heatmap of the top 50 most
signifi-cant differenitially expressed probe sets. Based on these 50 probe sets, principal component
analysis (PCA) showed a clear separation of both patient groups (Fig. 6B). Furthermore, we
ob-served that the gene expression patterns of patients expressing theAF4-MLLfusion transcript
were enriched for genes that were down-regulated after knock-down of theAF4-MLLin the
cell line models RS4;11 and SEMK2 (GSEA; NES = 1.67, p = 0.02; leading edge inS12 Table)
Fig 4. Genes responsive to the repression of MLL-ENL and MLL-AF4 accurately characterize primary
MLL-rearranged infant ALL samples.(A) Heatmap visualization and hierarchical clustering of primaryMLL -rearranged infant ALL samples (MLL-r, red, n = 71), wild-typeMLLpediatric ALL samples (both infants (n = 20) and children>1 year of age (n = 16)) (wtMLL, blue, n = 36), and whole bone marrow samples derived from healthy children (healthy BM, dark blue, n = 13) based on the 56 differentially expressed probe sets recurrently affected in both KOPN-8, RS4;11, and SEMK2 cells uponMLLfusion knock-down. Up-regulated genes are depicted in red, down-Up-regulated genes are depicted in blue. (B) Gene set enrichment analysis (GSEA) of the 57 probe sets that are significantly lower expressed upon knock-down of theMLL fusion in gene expression profiles ofMLL-rearranged patients. Probe sets and HGNC Gene Symbols of the gene set are listed inS5 Table.
doi:10.1371/journal.pone.0120326.g004
Fig 5. Differential gene expression in response to the repression ofAF4-MLL.(A) mRNA expression levels ofAF4-MLL(grey), wild-typeMLL(white), and wild-typeAF4(black) in RS4;11 and SEMK2 cells after transfection with siRNAs directed againstAF4-MLL, siRNAs against the leukemic fusion geneAML1/MTG8 (siAGF1), or cells electroporated in the absence of siRNAs (pulse control). The average mRNA expression relative to the siAGF1 controls of two independent experiments±standard error of the mean is shown. (B) Venn diagram showing the number of differentially expressed genes (p<0.001) in RS4;11 and SEMK2 cells in whichAF4-MLLwas repressed (AF4-MLLknock-down, n = 6), versus cells transfected with control siRNA (siAGF1control, n = 6), and cells electroporated in the absence of siRNAs (pulse control, n = 6). (C) Hierarchical clustering based on 36 overlapping differentially expressed probe sets responsive toAF4-MLL repression in RS4;11 and SEMK2 (light grey), control samples transfected with siAGF1(dark grey), and pulse control samples (black). (D) Gene set enrichment analysis (GSEA) ofAF4-MLLassociated transcription factors (Gaussmannet al[20]) inAF4-MLLknock-down (‘na_neg’) versus control samples (‘na_pos’). Probe sets and HGNC Gene Symbols are listed inS8andS9Tables.
(Fig. 6B, upper panel). As a control we also analyzed enrichment of genes responsive to
AF4-MLLknock-down in ourMLL-AF4knock-down signature, and found no significant
enrich-ment (p = 0.55) (Fig. 6B, lower panel).
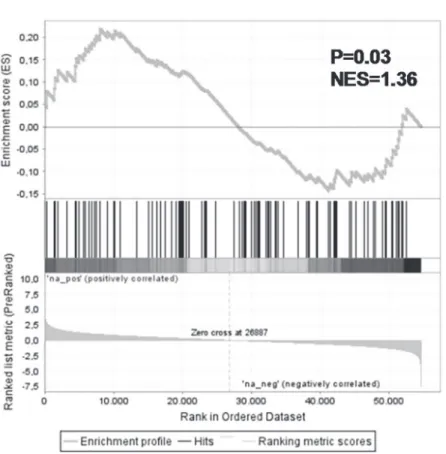
Genes up-regulated after MLL fusion knock-down are enriched for
hypermethylated promoter regions
Interestingly, while several knownMLL-AF4target genes were down-regulated after the loss of
theMLLfusion, a substantial proportion of genes in ourMLLfusion knock-down signature
were up-regulated (Fig. 2). Per definition these genes are not directly regulated by the MLL
fu-sion protein via H3K79 mediated transcription activation. Therefore, we explored an
alterna-tive mechanism of transcriptional regulation. We recently demonstrated thatMLL-rearranged
infant ALL is characterized by severe aberrant DNA hypermethylation, leading to
transcrip-tional silencing of numerous genes. [10] Using 165 probe sets associated with gene promoter
methylation in the majority ofMLL-rearranged infant ALL patients, we applied GSEA on our
MLLfusion knock-down signatures. GSEA demonstrated significant enrichment of these
genes among the genes up-regulated after knock-down ofMLL-AF4andMLL-ENL
(NES = 1.36, p = 0.03; leading edge inS13 Table) (Fig. 7). These data suggest that there is an
ac-tive interplay between MLL fusion proteins and DNA methylation patterns inMLL-rearranged
ALL cells.
Discussion
The here identified genes which are transcriptionally responsive to the repression of MLL-AF4
and MLL-ENL represent a rich source of potential therapeutic targets forMLL-rearranged
acute leukemia. Apart from gene signatures associated with the loss of MLL-AF4 and MLL-ENL, we also identified genes responsive to the repression of AF4-MLL. As it has been
suggested that theAF4-MLLoncogene could be indispensable for the initiation of t(4;11)+
leu-kemias, our gene signatures associated with the presence and loss ofAF4-MLLmay well
pro-vide novel insights into the biology of this leukemia. Apart from genes down-regulated upon
the loss ofMLLfusions, we also identified a substantial number of genes which were
up-regu-lated in response toMLLfusion repression. Although MLL fusion proteins activate a variety of
target genes (represented in the datasets of Guenther [7,8] and Krivtsov [7,8]) by the
recruit-ment of DOT1L and subsequent methylation of H3K79 [7,8], these data suggest that the MLL
fusion itself and/or its activated target genes also actively repress and activate other genes via al-ternative mechanisms. For instance, we found significant enrichment of the genes activated
after knock-down of theMLLfusions in our previously published gene signatures associated
with promoter hypermethylation in t(4;11)+and t(11;19)+infant ALL samples. [10] This
un-derscores the importance of the role of DNA methylation inMLL-rearranged infant ALL, as it
appears, to some extent, to be influenced by the presence of the MLL fusion.
Yet, the data presented here should be interpreted with caution as we were not able achieve
complete repression of theMLLfusions, which may have affected the results. On the other
hand, a full knock-down of theMLLfusion may not have provided better data per se, as that
Fig 6. Genes responsive toAF4-MLLrepression characterizeAF4-MLLexpressing (4;11)+infant ALL patients.(A) Heatmap visualization and hierarchical clustering of primary t(4;11)+ infant ALL samples exhibitingAF4-MLLexpression (n = 15, red), or lackingAF4-MLLexpression (n = 11, blue), based on the top 50 most differentially expressed genes between both patient groups. Up-regulated genes are depicted in red, down-regulated genes are depicted in blue. (B) Gene set enrichment analysis (GSEA) of AF4-MLL (upper panel) and MLL-AF4 (lower panel) target genes inAF4-MLLpositive patients (‘1’) versusAF4-MLLnegative t (4;11) patients (‘0’). Probe sets and HGNC Gene Symbols are listed inS10andS11Tables.
may have generated more non-specific effects due to enhanced apoptosis induced by the loss of
MLL-AF4. [13,17] Other points of concern may be the slight down-regulation of wild-type
AF4in SEMK2 cells transfected with siRNAs againstMLL-AF4, as well as the fact that siRNAs
directed against AF4-MLL also affected wild-typeMLLexpression. A possible explanation for
this phenomenon is thatMLLandAF4are downstream effectors of the fusion protein.
Howev-er, we confirmed significant enrichment of differentially regulated genes upon repression of the different MLL fusions in recently published gene signatures consisting of MLL-AF4 target genes (7,8), and a gene signature associated with the loss of AF4-MLL. (17) Moreover, we also
demonstrate that our identified genes accurately characterizeMLL-rearranged ALL patient
samples. Furthermore, Ingenuity pathway analysis (IPA) suggested that potential regulators of our gene signature consisting of genes transcriptionally responsive to the knock-down of MLL
fusion genes, involve several miRNAs that supposedly target eitherMLL(i.e. KMT2A) and/or
AF4(i.e. AFF1). This again implies that our gene signatures indeed consist of genes controlled
by MLL fusion proteins. Therefore we believe that the obtained data is valid and informative, despite the limited levels of knock-down and the induced suppression of either AF4 or MLL. Among the here observed genes that are down-regulated after knockdown of the MLL fu-sions we found several genes that potentially play important roles in leukemia maintenance
and/or leukemogenesis. For instance, cyclin-dependent kinase 6 (CDK6), which was identified
Fig 7. Genes up-regulated in response toMLL-AF4andMLL-ENLrepression include genes normally silenced by promoter methylation inMLL-rearranged infant ALL.Gene set enrichment analysis (GSEA) of hypermethylated promoter regions in t(4;11) and t(11;19) patients (Stumpelet al[10]) inMLLfusion positive (‘na_pos’) versusMLLfusion negative (‘na_neg’) samples.
doi:10.1371/journal.pone.0120326.g007
as one of theMLLfusion target genes, as the genomic region encompassingCDK6revealed
en-hanced occupancy of both MLL-AF4 and H3K79 dimethylation.[8] We recently reported data
showing the important role of CDK6 in the proliferation ofMLL-rearranged ALL cells,
demon-strating experimentally that inhibition of CDK6 readily induces impairment of leukemic cell
proliferation. [21] Other genes in our core signature of genes transcriptionally responsive to
the loss of MLL fusion expression are potentially important in leukemogenesis. For example, high expression of the Ets family transcription factor ERG, which is down-regulated after MLL fusion knock-down, is associated with a poor clinical outcome in both acute myeloid leukemia
(AML) and T-cell acute lymphoblastic leukemia (T-ALL). [22,23] Moreover, enforced ERG
expression induces both T-ALL and AML in murine models [24,25], suggesting that ERG
con-tributes to leukemia development. As the inhibition of ERG could possibly benefit the survival
ofMLL-rearranged ALL patients as well as patients suffering from AML and T-ALL, this gene
represents an interesting candidate target gene for therapeutic intervention. More genes that are down-regulated after knockdown of the MLL fusions, and that have been associated with
oncogenesis include SATB1 [26–28], KAT7 [29–31], ADA [32], PPM1F [33,34], and HOXA7
[35].
Likewise, potential therapeutic targets can also be found among genes that are up-regulated upon knock-down of the MLL fusions. Among these genes we found regulator of G-protein
signaling protein-2 (RGS2), which has been demonstrated to contribute to myeloid
differentia-tion and its repression is considered to be an important event in leukemic transformadifferentia-tion of
FLT3-ITD+AML. [36] Moreover, RGS2 functions as a tumor suppressor in various human
cancers. [37–39] Hypothetically, induction of this protein may suppressMLL-rearranged
ALL progression.
In conclusion, we strongly believe that the genes identified in the present study represent genes which directly and readily respond to the loss of the MLL-AF4, MLL-ENL, or AF4-MLL, and that these genes potentially include attractive therapeutic targets and provide important
in-sights into the biology underlyingMLL-rearranged acute leukemias.
Supporting Information
S1 File. Materials and Methods.(DOCX)
S1 Table. Differentially expressed genes in response to the repression of MLL-AF4 and MLL-ENL as compared to the siAGF1control or the pulse control.
(DOCX)
S2 Table. Differentially expressed genes in response to the repression of MLL-AF4 and MLL-ENL as compared to the siAGF1control and the pulse control combined.
(DOCX)
S3 Table. Leading edge of GSEA comparing MLL-fusion knockdown samples versus control samples using MLL-AF4 target genes dataset from Guentheret al.
(DOCX)
S4 Table. Leading edge of GSEA comparing MLL-fusion knockdown samples versus control samples using MLL-AF4 target genes from Krivtsovet al.
(DOCX)
S5 Table. Differentially lower expressed genes in response to the repression of MLL-AF4 and MLL-ENL as compared to the siAGF1control and the pulse control combined.
S6 Table. Leading edge of GSEA comparingMLL-rearranged patients versus wild-type
MLLpatients using 57 MLL-AF4 target gene probe sets.
(DOCX)
S7 Table. Upstream regulators of the differentially lower expressed genes in response to the repression of MLL-AF4 and MLL-ENL.
(DOCX)
S8 Table. Differentially expressed genes in response to the repression of MLL-AF4 and MLL-ENL as compared to the siAGF1control or the pulse control.
(DOCX)
S9 Table. Differentially expressed genes in response to the repression of MLL-AF4 and MLL-ENL as compared to the siAGF1control and the pulse control combined.
(DOCX)
S10 Table. Down-regulated genes inAF4-MLLsignature.
(DOCX)
S11 Table. Down-regulated genes inMLL-AF4signature.
(DOCX)
S12 Table. Leading edge of GSEA comparing AF4-MLL positive patients versus AF4-MLL negative t(4;11) patients using 58 AF4-MLL target gene probe sets.
(DOCX)
S13 Table. Leading edge of GSEA comparing MLL fusion knockdown versus control sam-ples using dataset from Stumpelet al.
(DOCX)
Acknowledgments
The authors would like to thank Dr. Olaf Heidenreich for critically reviewing the manuscript. We thank the members and participating institutes of the INTERFANT study for generously providing leukemic samples. M.H.v.d.L. is a PhD candidate at the Erasmus University and this work is submitted in partial fulfillment of the requirement for the PhD. This research was funded by KIKA (Stichting Kinderen Kankervrij), and R.W.S. was financially supported by KWF Kankerbestrijding (Dutch Cancer Society).
Author Contributions
Conceived and designed the experiments: MHvdL RP RWS. Performed the experiments: MHvdL LS PS EMCD PGC DS JdB OW. Analyzed the data: MHvdL EvR. Wrote the paper: MHvdL RP RWS.
References
1. Greaves MF. Infant leukaemia biology, aetiology and treatment. Leukemia. 1996 Feb; 10(2):372–7. PMID:8637251. Epub 1996/02/01. eng.
2. Pieters R, Schrappe M, De Lorenzo P, Hann I, De Rossi G, Felice M, et al. A treatment protocol for in-fants younger than 1 year with acute lymphoblastic leukaemia (Interfant-99): an observational study and a multicentre randomised trial. Lancet. 2007 Jul 21; 370(9583):240–50. PMID:17658395. Epub 2007/07/31. eng.
3. Meyer C, Kowarz E, Hofmann J, Renneville A, Zuna J, Trka J, et al. New insights to the MLL recombi-nome of acute leukemias. Leukemia. 2009 Aug; 23(8):1490–9. PMID:19262598. Epub 2009/03/06. eng. doi:10.1038/leu.2009.33
4. Jansen MW, Corral L, van der Velden VH, Panzer-Grumayer R, Schrappe M, Schrauder A, et al. Immu-nobiological diversity in infant acute lymphoblastic leukemia is related to the occurrence and type of MLL gene rearrangement. Leukemia. 2007 Apr; 21(4):633–41. PMID:17268512. Epub 2007/02/03. eng.
5. Armstrong SA, Staunton JE, Silverman LB, Pieters R, den Boer ML, Minden MD, et al. MLL transloca-tions specify a distinct gene expression profile that distinguishes a unique leukemia. Nat Genet. 2002 Jan; 30(1):41–7. PMID:11731795. Epub 2001/12/04. eng.
6. Yeoh EJ, Ross ME, Shurtleff SA, Williams WK, Patel D, Mahfouz R, et al. Classification, subtype dis-covery, and prediction of outcome in pediatric acute lymphoblastic leukemia by gene expression profil-ing. Cancer Cell. 2002 Mar; 1(2):133–43. PMID:12086872. Epub 2002/06/28. eng.
7. Krivtsov AV, Feng Z, Lemieux ME, Faber J, Vempati S, Sinha AU, et al. H3K79 methylation profiles de-fine murine and human MLL-AF4 leukemias. Cancer Cell. 2008 Nov 4; 14(5):355–68. PMID:
18977325. Pubmed Central PMCID: 2591932. Epub 2008/11/04. eng. doi:10.1016/j.ccr.2008.10.001
8. Guenther MG, Lawton LN, Rozovskaia T, Frampton GM, Levine SS, Volkert TL, et al. Aberrant chroma-tin at genes encoding stem cell regulators in human mixed-lineage leukemia. Genes & development. 2008 Dec 15; 22(24):3403–8. PMID:19141473. Pubmed Central PMCID: 2607073. Epub 2009/01/15. eng.
9. Wilkinson AC, Ballabio E, Geng H, North P, Tapia M, Kerry J, et al. RUNX1 is a key target in t(4;11) leu-kemias that contributes to gene activation through an AF4-MLL complex interaction. Cell reports. 2013 Jan 31; 3(1):116–27. PMID:23352661. Pubmed Central PMCID: 3607232. doi:10.1016/j.celrep.2012. 12.016
10. Stumpel DJ, Schneider P, van Roon EH, Boer JM, de Lorenzo P, Valsecchi MG, et al. Specific promoter methylation identifies different subgroups of MLL-rearranged infant acute lymphoblastic leukemia, influ-ences clinical outcome, and provides therapeutic options. Blood. 2009 Dec 24; 114(27):5490–8. PMID: 19855078. Epub 2009/10/27. eng. doi:10.1182/blood-2009-06-227660
11. Schafer E, Irizarry R, Negi S, McIntyre E, Small D, Figueroa ME, et al. Promoter hypermethylation in MLL-r infant acute lymphoblastic leukemia: biology and therapeutic targeting. Blood. 2010 Jun 10; 115 (23):4798–809. PMID:20215641. Pubmed Central PMCID: 2890186. Epub 2010/03/11. eng. doi:10. 1182/blood-2009-09-243634
12. Bursen A, Schwabe K, Ruster B, Henschler R, Ruthardt M, Dingermann T, et al. The AF4.MLL fusion protein is capable of inducing ALL in mice without requirement of MLL.AF4. Blood. 2010 Apr 29; 115 (17):3570–9. PMID:20194896. Epub 2010/03/03. eng. doi:10.1182/blood-2009-06-229542
13. Kumar AR, Yao Q, Li Q, Sam TA, Kersey JH. t(4;11) leukemias display addiction to MLL-AF4 but not to AF4-MLL. Leuk Res. 2011 Mar; 35(3):305–9. PMID:20869771. Pubmed Central PMCID: 3011030. Epub 2010/09/28. eng. doi:10.1016/j.leukres.2010.08.011
14. Stong RC, Korsmeyer SJ, Parkin JL, Arthur DC, Kersey JH. Human acute leukemia cell line with the t (4;11) chromosomal rearrangement exhibits B lineage and monocytic characteristics. Blood. 1985 Jan; 65(1):21–31. PMID:3917311.
15. Pocock CF, Malone M, Booth M, Evans M, Morgan G, Greil J, et al. BCL-2 expression by leukaemic blasts in a SCID mouse model of biphenotypic leukaemia associated with the t(4;11)(q21;q23) translo-cation. Br J Haematol. 1995 Aug; 90(4):855–67. PMID:7669664.
16. Drexler HG, Quentmeier H, MacLeod RA. Malignant hematopoietic cell lines: in vitro models for the study of MLL gene alterations. Leukemia. 2004 Feb; 18(2):227–32. PMID:14671638.
17. Thomas M, Gessner A, Vornlocher HP, Hadwiger P, Greil J, Heidenreich O. Targeting MLL-AF4 with short interfering RNAs inhibits clonogenicity and engraftment of t(4;11)-positive human leukemic cells. Blood. 2005 Nov 15; 106(10):3559–66. PMID:16046533. Epub 2005/07/28. eng.
18. Heidenreich O, Krauter J, Riehle H, Hadwiger P, John M, Heil G, et al. AML1/MTG8 oncogene suppres-sion by small interfering RNAs supports myeloid differentiation of t(8;21)-positive leukemic cells. Blood. 2003 Apr 15; 101(8):3157–63. PMID:12480707. Epub 2002/12/14. eng.
19. Stam RW, Schneider P, Hagelstein JA, van der Linden MH, Stumpel DJ, de Menezes RX, et al. Gene expression profiling-based dissection of MLL translocated and MLL germline acute lymphoblastic leu-kemia in infants. Blood. 2010 Apr 8; 115(14):2835–44. PMID:20032505. Epub 2009/12/25. eng. doi: 10.1182/blood-2009-07-233049
20. Gaussmann A, Wenger T, Eberle I, Bursen A, Bracharz S, Herr I, et al. Combined effects of the two re-ciprocal t(4;11) fusion proteins MLL.AF4 and AF4.MLL confer resistance to apoptosis, cell cycling ca-pacity and growth transformation. Oncogene. 2007 May 17; 26(23):3352–63. PMID:17130830. Epub 2006/11/30. eng.
21. van der Linden MH, Willekes M, van Roon E, Seslija L, Schneider P, Pieters R, et al. MLL fusion-driven activation of CDK6 potentiates proliferation in MLL-rearranged infant ALL. Cell cycle. 2014 Mar 1; 13 (5):834–44. PMID:24736461. Pubmed Central PMCID: 3979919. doi:10.4161/cc.27757
22. Marcucci G, Baldus CD, Ruppert AS, Radmacher MD, Mrozek K, Whitman SP, et al. Overexpression of the ETS-related gene, ERG, predicts a worse outcome in acute myeloid leukemia with normal karyo-type: a Cancer and Leukemia Group B study. J Clin Oncol. 2005 Dec 20; 23(36):9234–42. PMID: 16275934.
23. Marcucci G, Maharry K, Whitman SP, Vukosavljevic T, Paschka P, Langer C, et al. High expression lev-els of the ETS-related gene, ERG, predict adverse outcome and improve molecular risk-based classifi-cation of cytogenetically normal acute myeloid leukemia: a Cancer and Leukemia Group B Study. J Clin Oncol. 2007 Aug 1; 25(22):3337–43. PMID:17577018.
24. Thoms JA, Birger Y, Foster S, Knezevic K, Kirschenbaum Y, Chandrakanthan V, et al. ERG promotes T-acute lymphoblastic leukemia and is transcriptionally regulated in leukemic cells by a stem cell en-hancer. Blood. 2011 Jun 30; 117(26):7079–89. PMID:21536859. doi:10.1182/blood-2010-12-317990
25. Goldberg L, Tijssen MR, Birger Y, Hannah RL, Kinston SJ, Schutte J, et al. Genome-scale expression and transcription factor binding profiles reveal therapeutic targets in transgenic ERG myeloid leukemia. Blood. 2013 Oct 10; 122(15):2694–703. PMID:23974202. Pubmed Central PMCID: 3795462. doi:10. 1182/blood-2013-01-477133
26. Zhang Y, Tian X, Ji H, Guan X, Xu W, Dong B, et al. Expression of SATB1 promotes the growth and me-tastasis of colorectal cancer. PloS one. 2014; 9(6):e100413. PMID:24971456. Pubmed Central PMCID: 4074063. doi:10.1371/journal.pone.0100413
27. Niu Y, Wang L, Cheng C, Du C, Lu X, Wang G, et al. Increased expressions of SATB1 and S100A4 are associated with poor prognosis in human colorectal carcinoma. APMIS: acta pathologica, microbiolo-gica, et immunologica Scandinavica. 2014 Sep 25. PMID:25257341.
28. Zhang L, Cheng F, He R, Chen H, Liu Y, Sun J. Inhibition of SATB1 by shRNA suppresses the prolifera-tion of cutaneous malignant melanoma. Cancer biotherapy & radiopharmaceuticals. 2014 Mar; 29 (2):77–82. PMID:24392879. Pubmed Central PMCID: 3929234.
29. Hu X, Stern HM, Ge L, O'Brien C, Haydu L, Honchell CD, et al. Genetic alterations and oncogenic path-ways associated with breast cancer subtypes. Molecular cancer research: MCR. 2009 Apr; 7(4):511– 22. PMID:19372580. doi:10.1158/1541-7786.MCR-08-0107
30. Duong MT, Akli S, Macalou S, Biernacka A, Debeb BG, Yi M, et al. Hbo1 is a cyclin E/CDK2 substrate that enriches breast cancer stem-like cells. Cancer research. 2013 Sep 1; 73(17):5556–68. PMID: 23955388. Pubmed Central PMCID: 3773499. doi:10.1158/0008-5472.CAN-13-0013
31. Iizuka M, Susa T, Takahashi Y, Tamamori-Adachi M, Kajitani T, Okinaga H, et al. Histone acetyltrans-ferase Hbo1 destabilizes estrogen receptor alpha by ubiquitination and modulates proliferation of breast cancers. Cancer science. 2013 Dec; 104(12):1647–55. PMID:24125069. doi:10.1111/cas. 12303
32. Morisaki T, Fujii H, Miwa S. Adenosine deaminase (ADA) in leukemia: clinical value of plasma ADA ac-tivity and characterization of leukemic cell ADA. American journal of hematology. 1985 May; 19(1):37– 45. PMID:3985005.
33. Susila A, Chan H, Loh AX, Phang HQ, Wong ET, Tergaonkar V, et al. The POPX2 phosphatase regu-lates cancer cell motility and invasiveness. Cell cycle. 2010 Jan 1; 9(1):179–87. PMID:20016286.
34. Jurmeister S, Baumann M, Balwierz A, Keklikoglou I, Ward A, Uhlmann S, et al. MicroRNA-200c re-presses migration and invasion of breast cancer cells by targeting actin-regulatory proteins FHOD1 and PPM1F. Mol Cell Biol. 2012 Feb; 32(3):633–51. PMID:22144583. Pubmed Central PMCID: 3266604. doi:10.1128/MCB.06212-11
35. Ayton PM, Cleary ML. Transformation of myeloid progenitors by MLL oncoproteins is dependent on Hoxa7 and Hoxa9. Genes & development. 2003 Sep 15; 17(18):2298–307. PMID:12952893. Pubmed Central PMCID: 196466.
36. Schwable J, Choudhary C, Thiede C, Tickenbrock L, Sargin B, Steur C, et al. RGS2 is an important tar-get gene of Flt3-ITD mutations in AML and functions in myeloid differentiation and leukemic transforma-tion. Blood. 2005 Mar 1; 105(5):2107–14. PMID:15536149.
37. Ying L, Lin J, Qiu F, Cao M, Chen H, Liu Z, et al. Epigenetic repression of RGS2 by UHRF1 promotes bladder cancer progression. The FEBS journal. 2014 Oct 16. PubMed PMID: 25323766.
38. Lyu JH, Park DW, Huang B, Kang SH, Lee SJ, Lee C, et al. RGS2 suppresses breast cancer cell growth via a MCPIP1-dependent pathway. Journal of cellular biochemistry. 2014 Sep 4. PubMed PMID: 25187114.
39. Cao X, Qin J, Xie Y, Khan O, Dowd F, Scofield M, et al. Regulator of G-protein signaling 2 (RGS2) inhib-its androgen-independent activation of androgen receptor in prostate cancer cells. Oncogene. 2006 Jun 22; 25(26):3719–34. PMID:16449965.