SUSHI: Scoring Scaled Samples for Server Selection
Paul Thomas
CSIRO Canberra, AustraliaMilad Shokouhi
Microsoft Research Cambridge, UKABSTRACT
Modern techniques for distributed information retrieval use a set of documents sampled from each server, but these sam-ples have been underutilised in server selection. We describe a new server selection algorithm, SUSHI, which unlike ear-lier algorithms can make full use of the text of each sampled document and which does not need training data. SUSHI can directly optimise for many common cases, including high precision retrieval, and by including a simple stopping con-dition can do so while reducing network traffic.
Our experiments compare SUSHI with alternatives and show it achieves the same effectiveness as the best current methods while being substantially more efficient, selecting as few as 20% as many servers.
Categories and Subject Descriptors
H.3.3 [Information Storage and Retrieval]: Information Search and Retrieval—selection process; H.3.4 [Information Storage and Retrieval]: Systems and Software— distrib-uted systems
General Terms
Experimentation, Measurement
Keywords
Document samples1.
SAMPLES FOR SERVER SELECTION
Distributed information retrieval (DIR) systems present a single search interface which can cover several independent collections, exposed through several independent servers. A
broker forwards users’ queries to each server independently, collates the results, and presents a single result set.
It is not always feasible to forward every query to every server, as costs will be incurred both in network traffic and potentially in fees for use. Brokers may therefore include a
Permission to make digital or hard copies of all or part of this work for personal or classroom use is granted without fee provided that copies are not made or distributed for profit or commercial advantage and that copies bear this notice and the full citation on the first page. To copy otherwise, to republish, to post on servers or to redistribute to lists, requires prior specific permission and/or a fee.
SIGIR’09,July 19–23, 2009, Boston, Massachusetts, USA. Copyright 2009 ACM 978-1-60558-483-6/09/07 ...$5.00.
process of server selection, which identifies for each query the most promising servers; only these servers receive the forwarded query and contribute to the final result set. As a general rule, we would like to forward queries to as few servers as possible, to minimise cost and delay, and decrease the chance of one or more servers being unavailable. As well as minimising costs, there is some evidence that a suffi-ciently accurate selection algorithm can improve the quality of results even above that from a single large index (see for example Abbaci et al. [1]).
A carefully-chosen sample of a server’s documents, or a large enough sample chosen by a random process, can be representative of the total holdings of a server. Brokers typ-ically therefore use such a sample to characterise a server’s holdings. A sample may be used to generate a language model [5]; to classify a server’s subject matter [17]; to esti-mate overlap with other servers [4]; to merge results from multiple servers [7]; or repeated samples may be used to es-timate the number of documents which a server indexes [15]. It is also possible to use samples to inform server selection. This paper presents SUSHI: a server selection algorithm which extrapolates scores for unseen documents from a sam-ple, and which uses these extrapolated scores to optimise for some desirable quality (such as precision) in the final result set. Experiments indicate it is as effective as the state-of-the-art ReDDE and CRCS algorithms while being substan-tially more efficient.
2.
SIMILAR SYSTEMS
A great many server selection techniques have been de-scribed in the literature. Two recent techniques, ReDDE and CRCS, have performed well in previous evaluations; they are also the two methods most like SUSHI in that they both make use of a central set of sampled documents.
2.1
ReDDE
The ReDDE (relevant document distribution estimation) method of Si and Callan [23] attempts to estimate the dis-tribution of relevant documents across servers; the intuition is that if all documents were ranked by an effective method, the toprdocuments would be relevant.1
Since this ranking cannot be computed by a broker, the distribution is esti-mated based on sampled documents.
For any sampled document d, let |c| be the number of documents in the collectioncwhichdwas drawn from; and 1
As originally presented,ris a proportion of the total num-ber of documents in all collections rather than a fixed cut-off. The two formulations are interchangable.
let |s| be the number of documents in the corresponding samples. Assuming that the sample is representative,dcan then stand for|c|/|s|documents from the original collection. To score servers for a query, every sampled document is scored and ranked. ReDDE starts with the highest-ranked sampled document—call thisd1—and allocates the associ-ated server a score proportional to|c|/|s|. The process con-tinues with d2, the second highest-ranked sampled docu-ment, and so on down the list until the assumed number of documents in the complete ranking,P
d|c|/|s|, is greater
thanr. At this point, where any lower-ranked document it
not likely no be relevant, no more documents are considered, and the server(s) with the highest scores are selected.
Evaluating ReDDE and several other methods and on a TREC-based testbed, Si and Callan found ReDDE had somewhat better recall in cases where collection sizes were uniform and markedly better recall when sizes were more variable [22, 23]. Other evaluations have shown ReDDE to be one of the most effective selection techniques, although subject to some bias towards larger collections [13].
ReDDE provides a score for each server, and so a ranking, but does not indicate how many servers should be selected. This is generally addressed simply by choosing a fixed cutoff ahead of time—Si and Callan use five to twenty [23].
2.2
CRCS
Shokouhi’s central-rank-based collection selection (CRCS) algorithms also make use of sampled documents as repre-sentatives of each collection [19]. Again, the sampled doc-uments are ranked for each query, and those servers which contribute highly-ranked sampled documents are selected.
Using ReDDE, each highly-ranked sampled document is worth the same fixed score. Shokouhi argues that this does not properly reflect the likely utility of each collection, since higher-ranked documents will generally be more useful than those of lower ranks. Instead of allocating a fixed score CRCS therefore allocates a score based on the rank of each of the topγsampled documents.
In the simple linear version, CRCS(l), the score is (|c|/|s|)γ for the first document, (|c|/|s|)(γ−1) for the second, etc. In the exponential version, CRCS(e), the score is (|c|/|s|)αe−β
for the first document, (|c|/|s|)αe−2β for the second, and so
on. α,β, andγ are all tunable parameters.
In experiments by Shokouhi [19], a simulated broker in-cluding CRCS performed slightly better than one includ-ing ReDDE (although on a precision measure, when Si and Callan considered recall). Thomas [27] saw recall similar to ReDDE, but with less bias toward large collections. CRCS(e) appeared slightly better than CRCS(l) in both sets of exper-iments, and we use this version here.
As with ReDDE, CRCS can only provide scores for servers; the decision of how many to use must be tackled separately.
2.3
Other methods
The UUM and RUM methods of Si and Callan [25, 26], like ReDDE and CRCS, use a central index of documents which is ranked for each query. UUM extends the basic model by learning, ahead of time, a function to map scores from the central index to probabilities of relevance: this can be used to select servers for either high precision or high recall. This is similar to our SUSHI algorithm, described below; UUM does however need training data, which may not be available, and therefore is not applicable to brokers
in the most general case. RUM extends UUM by taking into account the effectiveness of each server.
The decision-theoretic framework (DTF) of Fuhr [9] also takes a similar approach, and aims to minimise the over-all cost of retrieval including the cost of interrogating each server and retrieving documents. Early versions used a lin-ear, learned, approximation of a precision-recall curve for each server; later versions used more complex variants [18]. In each case, however, a large amount of training data is required as well as an estimate of the various costs involved. As for UUM and RUM, we argue that this is not feasible in the general case.
In our experiments we use three further selection methods for comparison. CORI [6] adapts the INQUERY document-scoring formula to score servers according to their vocab-ulary and term frequencies. This is commonly estimated based on sampled documents, but for CORI only aggregate data is used and document boundaries are not retained. CORI has been used as a baseline in much previous work [e.g. 13, 19, 23, 25].
We also consider a relevance-based ranking (RBR)—an oracular method which ranks servers according to the num-ber of relevant documents they hold—and a central-index model. The former allows us to compare performance with a “perfect” broker, and the latter allows us to determine the performance loss due to the DIR model.
3.
SCORING SCALED SAMPLES
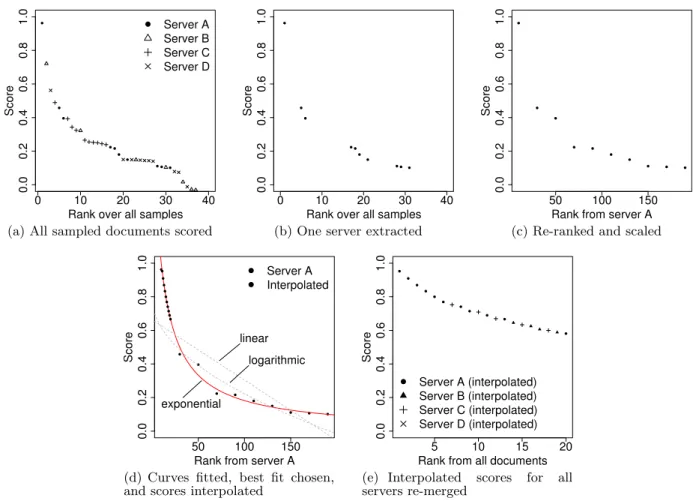
SUSHI incorporates three key ideas. First, where ReDDE rewards servers based on the presence of a sampled docu-ment in the top ranks, and CRCS rewards servers based on these ranks, SUSHI uses the score assigned to the docu-ments themselves. Second, SUSHI uses curve fitting to map scores from sampled documents to estimate scores from un-seen documents. Third, SUSHI uses these fitted curves to directly maximise for the metric of interest. Figure 1 illus-trates the process.
Scoring and ranking.
First, we score each sampled doc-ument with regard to the query and the (estimated) term statistics across all collections; this is the same as for ReDDE and CRCS. (Figure 1(a).) Second, we can then extract for each server just the documents sampled from that server’s collection (Figure 1(b)).Adjusting ranks.
Third, we adjust the rank of each sam-pled document. Since each document in the sample is as-sumed to stand for some number of documents from the server, we use adjusted ranks (x+ 0.5)(|c|/|s|) for x∈N0. For example, in Figure 1(b), the sample is 1/20th the size of the server, so each sampled document stands for 20 and the ranks in Figure 1(c) are adjusted to (10,30,50,· · ·).Occasionally, only very few documents from a server score above zero. If there are fewer thanZnon-zero scores, SUSHI assumes that these are the only relevant documents from the collection and does not adjust ranks or attempt to fit a curve (see following). In principleZ could depend on sample and collection sizes, but in this work we subsitute a fixed value. Early experiments suggested that Z = 5 documents was a fair cutoff: higher values resulted in too few curves being fitted and lower values resulted in inaccurate fitting.
● ● ● ● ● ● ● ● ● ● 0 10 20 30 40 0.0 0.2 0.4 0.6 0.8 1.0
Rank over all samples
Score
● Server A Server B Server C Server D
(a) All sampled documents scored
● ● ● ● ● ● ● ● ●● 0 10 20 30 40 0.0 0.2 0.4 0.6 0.8 1.0
Rank over all samples
Score
(b) One server extracted
● ● ● ● ● ● ● ● ● ● 50 100 150 0.0 0.2 0.4 0.6 0.8 1.0
Rank from server A
Score
(c) Re-ranked and scaled
● ● ● ● ● ● ● ● ● ● 50 100 150 0.0 0.2 0.4 0.6 0.8 1.0
Rank from server A
Score exponential linear logarithmic ● ● ● ● ● ● ● ● ● ● ● ● Server A Interpolated
(d) Curves fitted, best fit chosen, and scores interpolated
● ● ● ● ● ● ● ● ● ● ● 5 10 15 20 0.0 0.2 0.4 0.6 0.8 1.0
Rank from all documents
Score
● Server A (interpolated) Server B (interpolated) Server C (interpolated) Server D (interpolated)
(e) Interpolated scores for all servers re-merged
Figure 1: SUSHI scoring four servers.
Curve fitting.
In order to estimate the scores of documents we have not seen, SUSHI fits a curve to the re-ranked sam-pled documents (Figure 1(d)). We try a linear, logarithmic, and exponential curve at query time and choose the one which fits best; this follows earlier work by Shokouhi and Zobel [20] but excludes the SQRT curve. Fit is measured withR2.
It is generally recognised that scores from a matching func-tion are best modelled not by one but by two curves: often a Gaussian (for the scores from relevant documents) mixed with an exponential (for irrelevant documents) [12, 16]. In this work we only fit one curve, since we expect there to be very few relevant documents in our small samples and this would make any more sophisticated fitting error-prone.
Re-ranking and optimising.
The interpolated scores from the first steps are, by assumption, representative of the top few documents from this server for this query. By repeat-ing for each server, and sortrepeat-ing the interpolated scores, it is possible to estimate the top scores across all servers (Fig-ure 1(e)). Note that up to this point document scores have been calculated and manipulated at the broker without pass-ing any queries to servers; and that the estimated scores are comparable across servers since they are produced with ref-erence to the same index.Finally, again on the assumption that these interpolated and re-ranked scores represent the best documents from each
server, we can optimise for whichever characteristic we pre-fer. In the experiments here we are concerned mainly with precision: we optimise for P@10 since studies suggest users only consider the first few results [14]. If document scores are proportional to probability of relevance—and some scoring functions expressly calculate this—then a server’s expected contribution to P@10 is proportional to the sum of the scores of its documents in the top ten. We rank servers according to this expected contribution. Servers with no documents in the top ten are not selected.
SUSHI may choose fewer thannservers when optimising for P@n, and in fact could even choose only one if that server is likely to provide thentop-scoring documents. This con-trasts with ReDDE, CRCS, CORI, and many other selection techniques where the number of servers to include must be fixed ahead of time.
Although we are mainly concerned here with precision, SUSHI can in principle optimise for some other desirable feature. For example, it is easy to rank servers according to the estimated number of relevant documents at each, which optimises for recall. Other alternatives including MRR are discussed in Section 5 following.
4.
SIMULATIONS
We have tested SUSHI, ReDDE, CRCS, and CORI in sev-eral simulated DIR environments. Our experiments address three questions:
1. How does SUSHI’s selection performance compare with other methods?
2. Does SUSHI’s ability to select fewer servers result in improved efficiency?
3. On our testbeds, how do realistic server selection tech-niques compare with an (impossible) oracle; and with a central index of the same documents?
4.1
Testbeds
Our experiments use six testbeds. By dividing the docu-ments between artificial “collections”, each represents a DIR system with a different distribution of collection sizes and a different distribution of relevant documents.2
The first five testbeds are based on documents from the TREC ad-hoc track [11]. None of the five models a real DIR system, where documents will be arranged strictly by source but most likely with a much wider range of sizes, document types, and densities of relevant documents. There is still however enough difference in these characteristics that we can spot trends.
Uniform.
In the uniform testbed (also called trec123-100col-bysource), documents from TREC CDs 1, 2, and 3 are dis-tributed across 100 collections according to their publica-tion source and date [28]. No collecpublica-tion contains documents from two different publication sources, and collection sizes are very homogeneous.Relevant.
Also called trec123-AP-WSJ-60col [22]. In this testbed documents in the 24 Associated Press collections from the uniform testbed are merged in a single collection (AP), and documents in the 16 Wall Street Journal tions from the uniform are collapsed into a separate collec-tion (WSJ). The other colleccollec-tions in the uniform testbed remain as before; AP and WSJ are therefore an order of magnitude larger than the remainder. When TREC ad-hoc topics are used, AP and WSJ have a higher density of rele-vant documents than the other collections in this testbed.Nonrelevant.
The nonrelevant testbed (“trec123-FR-DOE-81col” [22]) combines all documents from the Federal Regis-ter in a single collection (FR), and those from the Depart-ment of Energy into another (DOE). In this testbed, the FR and DOE collections are relatively large but have the lowest density of relevant documents.Representative.
The representative testbed (“trec123-2ldb-60col” [23]) is also based on the uniform testbed, with some collections aggregated into two larger ones. In this case col-lections are sorted by their names; every fifth collection starting from the first collection is merged into a single collection (COL1), and every fifth collection starting from the second collection is merged into a separate collection (COL2). These large collections are again an order of mag-nitude larger than the other 60, which remain unchanged, but should have the same density of relevant documents.2
Previous research has shown that the effectiveness of col-lection secol-lection methods may vary according to the distri-bution of relevant documents in collections [8, 23].
k-means.
Around 568,000 documents from the TREC 4 data set are clustered via thek-means algorithm, to obtain 100 collections of approximately equal size and which are assumed to be topically coherent [28].Web.
Our sixth testbed is derived from the WT10g corpus used by the TREC web track [3]. We divide the corpus so that documents from each host appear as a separate collec-tion: we suggest that this more accurately represents a real DIR application, in particular matching web search portals offered by for example FedLemur [2].Queries.
Experiments on the uniform, relevant, nonrele-vant, and representative testbeds used queries from the ti-tles of TREC topics 51–100, and associated relevance judge-ments. The k-means testbed used the description fields of TREC topics 201–250; the web testbed used titles from TREC web track topics 451–500.4.2
Metrics
We use two effectiveness metrics for each testbed and se-lection method. To estimate final system performance as seen by a user, we simulate a full broker by retrieving doc-uments from each selected server, merging these with the SSL algorithm [24], and using the standard precision metric P@10 on the merged list. This approximates a real instal-lation: SSL is a state-of-the-art merging technique, and we assume a user will look at the first ten results. P@10 ranges from 0 to 1, although (since there may be fewer than ten relevant documents, and since merging is subject to error) the best possible selection may not score 1.
P@10 gives a measure of overall performance. We also use Rk, which is a rough analogue of classical recall and
consid-ers the effectiveness of the selection method alone [10]. Ifk servers are selected, Rk is the ratio of relevant documents
held by these servers to relevant documents held by the k servers in a relevance-based ranking. Rk ranges from 0—
meaning there are no relevant documents in thek selected servers—to 1—meaning thekselected servers are those with the highest number of relevant documents.3
The cutoffk is an upper bound, not a fixed parameter, for SUSHI since it may select fewer servers if this seems appropriate.
We evaluate the efficiency of a selection method by consid-ering the number of interactions with servers—in this case, the number of servers selected.
4.3
Configuration
We have tested SUSHI and alternatives in two scenar-ios. A “cooperative” scenario assumes that servers cooper-ate with a broker and make full information available on documents and scores; an “uncooperative” scenario assumes brokers must instead estimate this information using sam-pling techniques.
It seems unlikely that a web-scale broker would ever have full information, so we consider our web testbed in the un-cooperative scenario only.
Cooperative scenario.
The first scenario provides a best case for comparison. Each method was run inside the lemur3
This metric is normally calledRn. We usek for the
num-ber of servers selected andn for the number of documents considered in evaluation; henceRk and P@n.
toolkit4
with parameters set as originally described. • ReDDE assumed that the topr= 50 documents were
relevant.
• CRCS usedα= 1.2,β= 0.28, and considered the top γ= 20 documents.
• CORI used default belief b = 0.4, df base = 50, and
df factor= 150 (after Callan et al.[6]).
• SUSHI fitted three curves to each set of samples— linear, logarithmic, and exponential—and took the best-fitting of the three. The fittest curve was allowed to vary for each query and server.
All simulated servers used lemur’s implementation of IN-QUERY scoring, and returned 100 documents for each query. “Samples” of each collection had 100% coverage, and re-sulting models were completely accurate; ReDDE, CRCS, and SUSHI used a “sample” index of all documents and scored them with INQUERY. Size “estimates” were also cor-rect. In each case the SSL “single model” algorithm was used, and document scores were reported by each server.
Uncooperative scenario.
The cooperative scenario ass-umes perfect knowledge of each collection, which is not fea-sible in a real broker. We expect that any real-world imple-mentation must make use of partial samples and imperfect estimates, so each method was re-run to estimate its perfor-mance under these conditions. Samples of 300 documents per server were drawn using query-based sampling [5], with uniform term selection and four documents at a time down-loaded. Although this is known to produce significantly bi-ased samples, it is commonly used in DIR applications. In this scenario, simulated “servers” were evenly divided be-tween language modelling, Okapi BM25, or INQUERY scor-ing, and returned only ten documents per query.Server sizes were estimated by capture history [21], using 140 queries. The SSL “multi model” technique, with pseu-doscores, is used for merging.
This scenario includes common DIR algorithms and re-strictions, and more closely represents a working broker.
4.4
Results
Cooperative scenario.
SUSHI should select fewer servers than other methods, but if it is behaving correctly we would expect it to be choose collections with enough relevant docu-ments that overall system performance is not affected. This is in fact the case: overall system performance is remarkably similar across all methods and testbeds (see Figures 2(a) and (b)). All selection methods perform about as well as each other and about as well as a central index; the only exception is CORI, which generally performs poorer and which is significantly worse than others on the representa-tive testbed whenk <7. (Significance tests in this section are Wilcoxon matched-pairs signed-rank tests,α= 0.05.)These experiments also allow us to compare a central in-dex with our oracular relevance-based ranking (RBR). There is no significant difference between P@10 scores in any of the uniform, relevant, nonrelevant, and representative testbeds; and precision scores improve significantly (although only 4
http://www.lemurproject.org/
slightly) when selection is used on the k-means testbed and five or more servers are selected. We can conclude that— given a good enough selection algorithm—the DIR model need not be less precise than a complete index.
Figures 2(c) to (e) plot Rk for each testbed and each
method as k, the number of servers selected, varies. (Re-call that a selection method which ranks according to the number of relevant documents will scoreRk= 1 for allk.)
There are some differences apparent. ReDDE performs well on the representative testbed. Since the density of rele-vant documents is more or less uniform across all collections in this testbed, and since we assume an effective ranking technique at each server, it is worthwhile selecting the two larger collections since they will have a higher number of relevant results. ReDDE’s selection is biased towards large collections, which in this case improves performance.
Unlike the other methods,Rkfor SUSHI starts somewhat
low and levels out or even drops as the cutoffkis increased on any testbed. (This is also true for ReDDE and CRCS on the representative testbed.) This indicates that SUSHI is not selecting further servers with relevant documents: this is because in many cases there appear to be enough relevant documents before k = 10, and SUSHI will therefore not select further servers. The decrease is less marked in the relevant testbed, where collections after the large two add relatively little merit.
SinceRkdoes not vary with peformance as seen by a user,
we suggest it may not be a useful metric in most cases and should be used with caution.
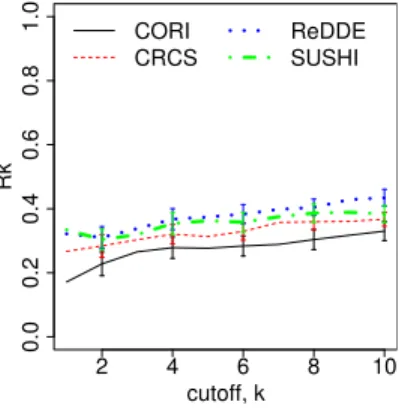
Uncooperative scenario.
Figure 3 summarises selection and overall performance. All selection methods tend to per-form worse with poorer samples, which is consistent with earlier work, and SUSHI’s performance is again comparable to other methods. Although precision scores for the oracu-lar relevance-based ranking (RBR) vary somewhat—the SSL merging method uses 300-document samples here instead of full collection information—they are still not significantly worse than those from a central index (with the sole excep-tion ofk= 10 on the k-means testbed). On the web testbed, RBR selection with SSL merging is substantially and signif-icantly better than retrieval from a cental index. Again, with good enough server selection a broker need not be less effective than a centralised tool.On the web testbed, which we believe is most like a real-world installation, SUSHI is again as effective as other meth-ods although scores are lower across the board (Figure 3(c)). As before,Rk scores from SUSHI level out or drop ask
increases and SUSHI does not select more servers, but again final precision is not affected and the only significant dif-ference is with ReDDE on the relevant testbed. We can conclude that SUSHI is able to pick an appropriate cutoff. ReDDE continues to produce highRkon the representative
testbed as well as the relevant testbed; again, this obser-vation can be explained by ReDDE’s bias toward selecting large collections, and the characteristics of the two testbeds.
4.5
Efficiency
By design, SUSHI selects fewer thankservers when pos-sible. Table 1 summarises the number of servers actually se-lected in the cooperative and uncooperative cases, for each testbed: recall that ReDDE, CRCS, and CORI must select a fixed number of servers for each query. For similar values
2 4 6 8 10 0.0 0.2 0.4 0.6 0.8 1.0 cutoff, k P@ 10 CORI CRCS ReDDE SUSHI RBR Central (a) P@10, uniform testbed; the nonrelevant and k-means testbeds are very similar
2 4 6 8 10 0.0 0.2 0.4 0.6 0.8 1.0 cutoff, k P@ 10 CORI CRCS ReDDE SUSHI RBR Central (b) P@10, relevant testbed; the represen-tative testbed is very similar 2 4 6 8 10 0.0 0.2 0.4 0.6 0.8 1.0 cutoff, k Rk CORI CRCS ReDDE SUSHI (c)Rk, uniform testbed;
the nonrelevant testbed is similar 2 4 6 8 10 0.0 0.2 0.4 0.6 0.8 1.0 cutoff, k Rk CORI CRCS ReDDE SUSHI (d)Rk, relevant testbed;
the k-means testbed is similar 2 4 6 8 10 0.0 0.2 0.4 0.6 0.8 1.0 cutoff, k Rk CORI CRCS ReDDE SUSHI (e) Rk, representative testbed
Figure 2: Precision andRk as cutoff varies, cooperative scenario.
2 4 6 8 10 0.0 0.2 0.4 0.6 0.8 1.0 cutoff, k P@ 10 CORI CRCS ReDDE SUSHI RBR Central (a) P@10, uniform testbed; the nonrele-vant, representative, and k-means testbeds are similar 2 4 6 8 10 0.0 0.2 0.4 0.6 0.8 1.0 cutoff, k P@ 10 CORI CRCS ReDDE SUSHI RBR Central (b) P@10, relevant testbed 2 4 6 8 10 0.0 0.2 0.4 0.6 0.8 1.0 cutoff, k P@ 10 CORI CRCS ReDDE SUSHI RBR Central (c) P@10, web testbed 2 4 6 8 10 0.0 0.2 0.4 0.6 0.8 1.0 cutoff, k Rk CORI CRCS ReDDE SUSHI (d)Rk, uniform testbed;
the nonrelevant testbed is fairly similar 2 4 6 8 10 0.0 0.2 0.4 0.6 0.8 1.0 cutoff, k Rk CORI CRCS ReDDE SUSHI
(e)Rk, relevant testbed;
the representative testbed is fairly similar
2 4 6 8 10 0.0 0.2 0.4 0.6 0.8 1.0 cutoff, k Rk CORI CRCS ReDDE SUSHI (f)Rk, k-means testbed
SUSHI
Testbed Coop. Uncoop Others uniform 2.3±2.2 4.5±3.0 10 relevant 1.4±0.8 3.9±2.5 10 nonrelevant 2.2±2.0 4.9±3.3 10 representative 1.6±0.8 3.6±2.6 10 k-means 1.8±0.8 2.1±1.4 10 web — 6.0±2.3 10
Table 1: Mean number of servers selected when
opti-mising for P@10,k= 10. ReDDE, CRCS, and CORI
select a fixed number of servers.
2 4 6 8 10 2 4 6 8 10 cutoff, k Number selected uniform relevant nonrelevant representative k−means wt10g
Figure 4: Servers selected as cutoff varies, uncoop-erative scenario.
of P@10, SUSHI is able to select as few as 14% as many servers and typically around 40% as many.
Since for all testbeds P@10 does not change greatly withk (Figures 2 and 3), it may seem reasonable to simply choose a lower cutoff—sayk= 4 or 5—and use an existing selection method. We make two observations. First, this cutoff must be chosen in advance of selection, ideally taking into account the query type (informational or navigational); it is not clear how to do this, and there is scope for error. Our method subsumes this decision. Second, while the cutoffk is fixed for most methods it is only a ceiling for SUSHI and (as long
ask >1) it is always possible to choose still fewer servers.
This second observation is illustrated in Figure 4, which plots the actual number of servers selected against k for the uncooperative case. SUSHI will always select at most kservers, and can select substantially fewer without losing final performance. The effect is most pronounced on the topically coherent collections of the k-means testbed.
4.6
Further observations: P@5, R
SUSHI’s scoring can easily be adapted to metrics other than P@10. We have considered two further alternatives.
To optimise for early precision—here P@5—we used the same technique as for P@10, but ranked servers according to their expected number of relevant documents in the global top five. Figure 5 illustrates this. Again, SUSHI is as effec-tive as other methods, but substantially more efficient: for example, it selects between 1.6±0.9 servers (on the k-means testbed) and 3.1±1.7 (on the nonrelevant testbed).
We have also adapted SUSHI to select servers according to their estimated contribution to recall, by considering the
2 4 6 8 10 0.0 0.2 0.4 0.6 0.8 1.0 cutoff, k P@ 5 CORI CRCS ReDDE SUSHI RBR Central
Figure 5: P@5 as cutoff varies, uniform testbed, un-cooperative scenario. Other testbeds are similar.
2 4 6 8 10 0.0 0.2 0.4 0.6 0.8 1.0 cutoff, k Rk CORI CRCS ReDDE SUSHI
Figure 6: Rkas cutoff varies, uniform testbed,
unco-operative scenario, with SUSHI selecting for recall. Other testbeds are similar.
sum of all non-zero document scores. Since there are typi-cally many more then ten servers with at least one relevant document, we would expect SUSHI to keep selecting servers and for the reportedRkscores to increase withk, instead of
flattening out as before. This is indeed the case, and SUSHI is once again competitive with other methods (Figure 6).
5.
SUPPLEMENTARY SUGGESTIONS
There are several opportunities to further improve SUSHI. At present, SUSHI’s curve fitting is fairly crude (although the fitted curves did match the data fairly closely in ear-lier work [20]). It would be worthwhile investigating more sophisticated fitting.
In particular, SUSHI fits only one curve to the full set of scores from sampled documents. Fitting two curves to the scores, in the manner suggested especially by Manmatha [16], would allow us to consider the probably-relevant and probably-irrelevant sampled documents separately and op-timise accordingly: for example, by taking into account the point where the probability densities for each type of docu-ment intersect we could disregard docudocu-ments which are high-scoring but more likely irrelevant than relevant.
SUSHI can also be used to select servers for qualities other than precision or recall. For example, it is possible to select servers according to their expected contribution to MRR—if
document scores can be interpreted as probabilities of rele-vance (as for example from INQUERY), the expected MRR score isd1 + 1/2 (1−d1)d2 + 1/3 (1−d1)(1−d2)d3 +· · ·, whered1, d2, . . . are document scores from the global inter-polated list. A server’s contribution is then just that from its own documents—some subset ofd1, d2, . . .—in the above. Similar scoring is possible for DCG, if binary gains are used: the expected score is P
if(i)di, wheref(i) is the discount
function, and servers can be scored according to their docu-ments as for MRR.
Finally, it is possible to use SUSHI to suggest not just which servers to select but how many documents to request from each. This would introduce further approximation and hence further chance for error, but may be worthwhile in cases where (for example) per-document or per-download fees are charged.
6.
SUMMARY
Although sets of sampled documents are generally avail-able to DIR brokers, they have been relatively under-utilised for server selection despite being in principle good repre-sentatives of each server’s holdings. The SUSHI algorithm makes use of document scores to inform selection, rather than the ranks used by ReDDE and CRCS, and directly es-timates the contribution each server would make to a desired metric. Unlike similar algorithms, it does not need training and is therefore more generally applicable; it can also select servers for a variety of tasks.
We have experimented with SUSHI on a variety of testbeds, using three different metrics, and it appears as effective al-ternatives while its built-in stopping condition makes it sub-stantially more efficient. We expect it could be further im-proved, and that it could be used to select servers for further metrics as well as to suggest how many documents to retrieve from each server.
7.
REFERENCES
[1] F. Abbaci, J. Savoy, and M. Beigbeder. A
methodology for collection selection in heterogeneous contexts. InProc. IEEE Conference on Information Technology, 2002.
[2] T. T. Avrahami, L. Yau, L. Si, and J. Callan. The FedLemur project: Federated search in the real world.
JASIST, 57(3), 2006.
[3] P. Bailey, N. Craswell, and D. Hawking. Engineering a multi-purpose test collection for web retrieval
experiments.Information Processing and Management, 39(6), 2003.
[4] K. Bharat and A. Broder. A technique for measuring the relative size and overlap of public web search engines. InProc. WWW, 1998.
[5] J. Callan, M. Connell, and A. Du. Automatic discovery of language models for text databases. In
Proc. ACM SIGMOD, 1999.
[6] J. P. Callan, Z. Lu, and W. B. Croft. Searching distributed collections with inference networks. In
Proc. ACM SIGIR, 1995.
[7] N. Craswell, D. Hawking, and P. Thistlewaite. Merging results from isolated search engines. In
Proc. Australasian Database Conference, 1999. [8] D. D’Souza, J. Zobel, and J. A. Thom. Is CORI
effective for collection selection? An exploration of
parameters, queries, and data. InProc. Australasian Document Computing Symposium, 2004.
[9] N. Fuhr. A decision-theoretic approach to database selection in networked IR.ACM Trans. Info. Systems, 17(3), 1999.
[10] L. Gravano and H. Garc´ıa-Molina. Generalizing GlOSS to vector-space databases and broker hierarchies. InProc. VLDB, 1995.
[11] D. K. Harman. The TREC test collections. In E. M. Voorhees and D. K. Harman, editors,TREC: Experiment and Evaluation in Information Retrieval. MIT Press, 2005.
[12] D. Hawking and S. Robertson. On collection size and retrieval effectiveness.Information Retrieval, 6, 2003. [13] D. Hawking and P. Thomas. Server selection methods
in hybrid portal search. InProc. ACM SIGIR, 2005. [14] T. Joachims, L. Granka, B. Pan, H. Hembrooke, and G. Gay. Accurately interpreting clickthrough data as implicit feedback. InProc. ACM SIGIR, 2005. [15] K.-L. Liu, A. Santoso, C. Yu, W. Meng, and
C. Zhang. Discovering the representative of a search engine. InProc. CIKM, 2001.
[16] R. Manmatha and H. Sever. A formal approach to score normalization for meta-search. InProc. Human Language Technology Research, 2002.
[17] W. Meng, W. Wang, H. Sun, and C. Yu. Concept hierarchy based text database categorization.
Knowledge and Information Systems, 4(2), 2002. [18] H. Nottelmann and N. Fuhr. Combining CORI and
the decision-theoretic approach for advanced resource selection. InProc. ECIR, 2004.
[19] M. Shokouhi. Central-rank-based collection selection in uncooperative distributed information retrieval. In
Proc. ECIR, 2007.
[20] M. Shokouhi and J. Zobel. Robust result merging using sample-based score estimates.ACM Trans. Info. Systems, 27(3), 2009. Article 14.
[21] M. Shokouhi, J. Zobel, F. Scholer, and S. M. M. Tahaghoghi. Capturing collection size for distributed non-cooperative retrieval. InProc. ACM SIGIR, 2006. [22] L. Si and J. Callan. The effect of database size
distribution on resource selection algorithms. In
Proc. ACM SIGIR, 2003.
[23] L. Si and J. Callan. Relevant document distribution estimation method for resource selection. In
Proc. ACM SIGIR, 2003.
[24] L. Si and J. Callan. A semisupervised learning method to merge search engine results.ACM Trans. Info. Systems, 21(4), 2003.
[25] L. Si and J. Callan. Unified utility maximization framework for result selection. InProc. CIKM, 2004. [26] L. Si and J. Callan. Modeling search engine
effectiveness for federated search. InProc. ACM SIGIR, 2005.
[27] P. Thomas.Server Characterisation and Selection for Personal Metasearch. PhD thesis, Australian National University, 2008.
[28] J. Xu and W. B. Croft. Cluster-based language models for distributed retrieval. InProc. ACM SIGIR, 1999.