2016
Improving rural business development, one firm at
a time: A look at the effects of the USDA's
Value-Added Producer Grant on firm survival
Marcie Elaine Stevenson
Iowa State University
Follow this and additional works at:https://lib.dr.iastate.edu/etd
Part of theAgricultural and Resource Economics Commons,Agricultural Economics Commons, and theEntrepreneurial and Small Business Operations Commons
This Thesis is brought to you for free and open access by the Iowa State University Capstones, Theses and Dissertations at Iowa State University Digital Repository. It has been accepted for inclusion in Graduate Theses and Dissertations by an authorized administrator of Iowa State University Digital Repository. For more information, please [email protected].
Recommended Citation
Stevenson, Marcie Elaine, "Improving rural business development, one firm at a time: A look at the effects of the USDA's Value-Added Producer Grant on firm survival" (2016).Graduate Theses and Dissertations. 15815.
Improving rural business development, one firm at a time: A look at the effects of the USDA’s Value-Added Producer Grant on firm survival
by
Marcie Stevenson
A thesis submitted to the graduate faculty
in partial fulfillment of the requirements for the degree of MASTER OF SCIENCE
Co-majors: Agricultural Economics; Sustainable Agriculture Program of Study Committee:
Georgeanne M. Artz, Major Professor Carmen M. Bain
Peter F. Orazem
Iowa State University Ames, Iowa
2016
DEDICATION
I would like to dedicate this thesis to all of my educators in life. From early childhood to the present, you have all instilled a love of learning in me that I will continue to carry with me. It is this love that pushed me to pursue further education and for that I am forever grateful. Though I greatly value all that I have learned from my most formal of educators, it goes without saying that my parents, Terry and Mary Stevenson, and grandparents, John and Marilyn Stevenson and Hub and the late Dorothy Hughes, have been some of the best educators in my life. Without them, I would not be where I am today.
TABLE OF CONTENTS Page LIST OF FIGURES ... v LIST OF TABLES ... vi NOMENCLATURE ... viii ACKNOWLEDGMENTS ... ix ABSTRACT………. ... x CHAPTER 1 INTRODUCTION ... 1
CHAPTER 2 LITERATURE REVIEW ... 4
2.1 Value-Added Agriculture ... 4
2.2 USDA Value-Added Producer Grant... 6
2.2.1 Grant establishment ... 7
2.2.2 Grant changes and revisions ... 8
2.2.3 Current application requirements ... 11
2.3 Previous Analyses of the USDA VAPG ... 13
2.4 Firm Survival ... 14
2.4.1 Age ... 15
2.4.2 Location ... 16
2.4.3 Capital acquisition ... 17
2.5 Contribution to Literature ... 21
CHAPTER 3 DATA AND METHODS ... 23
3.1 Data Description ... 23 3.1.1 VAPG data ... 23 3.1.2 NETS data ... 27 3.1.3 Available data ... 28 3.1.4 Data preparation ... 29 3.2 Methods ... 41 3.2.1 Survival analysis ... 41
CHAPTER 4 RESULTS ... 48
4.1 Survival Analysis ... 48
4.1.1 Test for randomness ... 48
4.1.2 Clustering ... 50
4.1.3 Model specific results ... 50
4.1.4 Survivor probability estimates ... 54
4.1.5 Survival time estimates ... 57
4.1.6 Survival estimate scenarios ... 58
CHAPTER 5 SUMMARY AND CONCLUSIONS ... 61
5.1 Results Summary ... 61
5.2 Conclusions ... 63
REFERENCES ... 65
APPENDIX: SUPPLEMENTARY MATERIALS... 73
Table A.1 Changes to USDA VAPG, 2001 to 2011 ... 73
Table A.2 Unmatched VAPG recipients, 2001 to 2011... 77
Table A.3 Miscoded VAPG recipients, 2001 to 2011 ... 78
Table A.4 Recipients with no control group, 2001 to 2011 ... 78
Table A.5 Association recipients, 2001 to 2011 ... 79
Table A.6 Recipients with maturity error, 2001 to 2011 ... 80
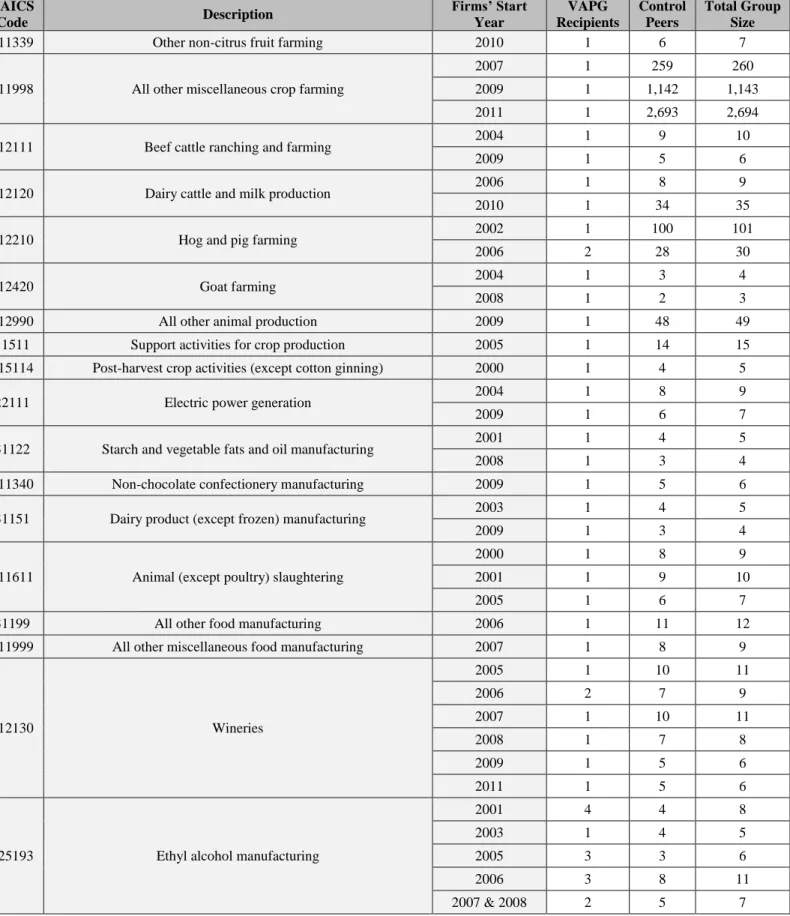
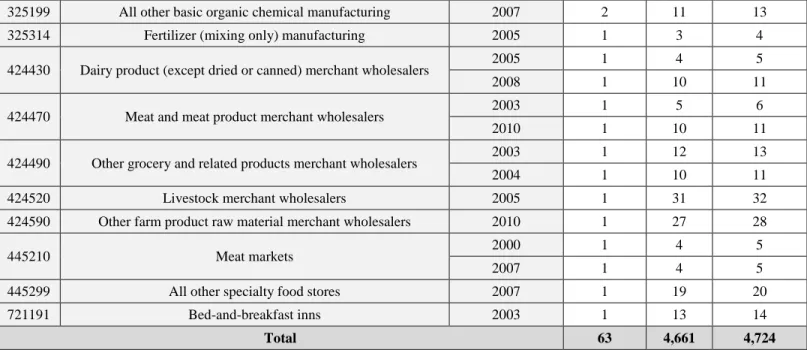
Table A.7 Start-up recipients retained, 2001 to 2011 ... 81
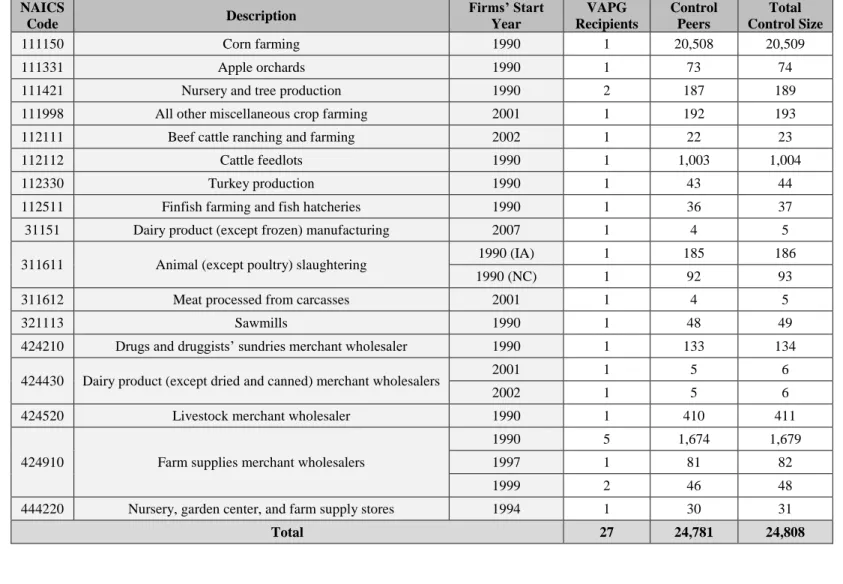
Table A.8 Established recipients retained, 2001 to 2011... 83
LIST OF FIGURES
Page
Figure 1 States by percentage of total grant recipients, 2001 to 2011 ... 25
Figure 2 States by percentage of total grants received, 2001 to 2011 ... 25
Figure 3 States by percentage of total grant monies awarded, 2001 to 2011 ... 26
LIST OF TABLES
Page Table 1 Top 5 states with the highest number of VAPG
recipients, 2001 to 2011 ... 24
Table 2 Bottom 6 states with the lowest number of VAPG recipients, 2001 to 2011 ... 24
Table 3 Results from matching VAPG recipients with NETS... 29
Table 4 Firms removed due to miscoded NAICS code ... 30
Table 5 Firms removed due to lack of control group ... 32
Table 6 Associations removed ... 32
Table 7 Firms removed due to maturity error ... 33
Table 8 Retained firms by state included in complete dataset ... 34
Table 9 Subset distribution between VAPG recipients and non-recipients ... 34
Table 10 Control group sizes for start-up recipients ... 35
Table 11 Control group sizes for established recipients ... 37
Table 12 Comparison of firm size for treatment and control groups for start-up subset ... 37
Table 13 Comparison of firm location for treatment and control groups for start-up subset ... 38
Table 14 Comparison of firm size for treatment and control groups for established subset ... 38
Table 15 Comparison of firm location for treatment and control groups for established subset ... 39
Table 16 Comparison of firm location for retained firms versus removed firms as a percentage of all VAPG recipients, 2001 to 2011 ... 39
Table 17 Comparison of VAPG size for retained firms versus removed firms ... 40
Table 18 Comparison of grant types received for retained recipients by subset ... 40
Table 19 Variables used in survival analysis models ... 46
Table 20 Results of probability estimation models by subset ... 49
Table 21 Results of start-up firm subset survival models ... 53
Table 22 Results of established firm subset survival models ... 55
Table 23 Survivor probability estimation results by subset and frailty condition .... 56
Table 24 Median survival time estimation results by subset and frailty condition... 58
NOMENCLATURE
D&B Dun & Bradstreet
DUNS Data Universal Number System
GRP Gross Regional Product
NAICS North American Industry Classification System
NETS National Establishment Time-Series
NOFA Notice of Funds Availability
USDA United States Department of Agriculture
VADG Value-Added Agricultural Product Market Development Grant
ACKNOWLEDGMENTS
This thesis would not have been possible without out the help, support, and
encouragement of many. To these individuals, I owe great thanks. First, I would like to thank my major professor, Georgeanne Artz, for all of her kindness, friendship, support, and patience. Not only did she have an open door at all times, but she very typically could lend me a few books from her personal library. You truly made this a great experience and I am indebted to you for this. Next, I would like to thank my committee members, Carmen Bain and Peter Orazem. Dr. Bain provided great perspective and new ideas for the thesis. As another frequent visitor of Georgeanne’s office, Dr. Orazem provided great guidance, support, and comic relief throughout this experience.
In addition, I would also like to thank my family and friends, near and far, for all of your support whether it was sending words of encouragement from miles away or offering to sit with me in Heady Hall on Saturdays while I worked on my thesis. I owe many thanks to my fiancé, Ryan Fahn, for standing by me through this whole process and pushing me to always do my best. Additionally, I would like to thank my peers as well as Iowa State University faculty and staff in the College of Agriculture and Life Sciences for all of the words of encouragement and making my experience one I will never forget.
Lastly, I would like to thank Dr. Michael Boland for releasing the Value-Added Producer Grant dataset to me for use in this thesis. Without this dataset, this research would not have been possible.
ABSTRACT
The rural economy has been declining over the past decade and a half. With the removal of farm subsidies, the U.S. Department of Agriculture has been looking for ways to help these suffering economies throughout the U.S. In 2001, under the supervision of the USDA’s Rural Business-Cooperative Service, the Value-Added Producer Grant program was established to help aid and support independent producers and similar organizations who are directly involved in the production of value-added agricultural products. Economic studies of firm survival suggest that capital acquisition and asset fixity are some of the biggest challenges facing start-up firms today, especially in rural areas where venture capital is limited. By utilizing information on Value-Added Producer Grant recipients from 2001 to 2011 in Iowa and North Carolina coupled with National Establishment Time-Series data from 1990 to 2011, this study will be using survival analysis to determine the effects of the USDA Value-Added Producer Grant on firm survival. Recipients will be matched with similar, non-recipient peers that represent the plausible outcome of the recipient firm had they not received the grant. The difference in length of survival time will measure the effect of the grant on firm survival.
The results of the study show that for both start-up and established firms, receiving a VAPG had a positive and significant impact on firm survival length. The value of the first grant received, conditional on having received a VAPG, as well as the total value of all grants received (in $100,000 increments) increases the estimated survival times though the size effect is not statistically significant. The estimated time ratios for the effect of the grant on firm survival varied greatly between the models suggesting that the grant may have different impacts on firm survival depending on the maturity of the business. Further evaluations were completed to
determine if the control groups established within the study represented a good match to the treatment firms. Using probability estimation, we determined that grant selection, conditional on the matching process for the study, appeared to be approximately random.
CHAPTER I INTRODUCTION
Over the past decade and a half, rural economies across the United States have been declining largely due to their ties to the agricultural industry. The U.S. Department of
Agriculture, as a part of their mission, has taken interest in preserving these rural economies. As of recently, the Department has been looking to value-added agriculture as a means for helping to support these declining regions (Kilkenny & Schluter, 2001). Farm subsidies were previously used as a rural development strategy, but left much to be desired. These subsidies favored larger farming operations leading to increased farm sizes, a decline in the number of farms, and fewer individuals involved in production agriculture. These subsidies, ultimately, did not achieve their goal of improving the rural farm economy.
Value-added agriculture has the potential to aid in the development and revitalization of rural economies across the United States. Though the definition of value-added agriculture can vary, studies are beginning to show some of the impacts these new agricultural systems included in value-added agriculture are generating. Revenues from value-added agricultural operations and activities are many times distributed within the communities nearest to the operation (Drabenstott & Meeker, 1997). These operations have the ability to increase local economic growth through linkages to other business and potential job creation (Monchuk, 2006). Producers of value-added agriculture products have increased risks, yet are typically rewarded with higher profits than their commodity producing peers (Brees, Parcell, & Giddens, 2010).
The USDA Value-Added Producer Grant, which focuses on supporting independent producers and similar producer groups involved in value-added agriculture operations, was
created in 2001 as a competitive grant program. The USDA Rural Business-Cooperative Service administered the grant program to help achieve the Service’s goals of increasing rural business development. Later, the program was introduced formally to the 2002 Farm Bill were funding priorities were established.
Economic literature on firm survival suggests that age, location, and capital acquisition are key determinants of firm success. This is no different for firms involved in agricultural operations. Younger firms are susceptible to a higher risk of failure relative to established firms (Caves, 1998). Within the first five years of operation, roughly 50 percent of firms will fail or exit the market (Dunne, Roberts, & Samuelson, 1989). Metropolitan regions naturally appear to be the more ideal location for start-up firms given the proximity to essential resources (Renski H. , 2008).One of the biggest challenges that rural start-ups face is access to capital, leaving them worse off relative to their urban peers who can more readily access and utilize capital to develop and grow their firms (Renski & Wallace, 2013). Rural firms also face the issue of asset fixity which requires a firm to have a higher probability of survival before entering a market given that the assets are less likely to be transferred to another firm and therefore, will have a lower salvage value or increased losses from failure relative to urban peers (Yu, Orazem, & Jolly, 2009). These issues dampen rural business development. However, there is evidence that rural firms survive longer than firms in urban regions (Stearns, Carter, Reynolds, & Williams, 1995; Yu, Orazem, & Jolly, 2009). Reducing the barriers to entry for rural start-ups can boost local economies for many years as the firm becomes more stable over time.
Given that the USDA Value-Added Producer Grant program is one form of capital acquisition for rural firms, this study looks to evaluate the impact the grant has on firm survival. Utilizing data on grant recipients from Iowa and North Carolina between 2001 to 2011 along
with National Establishment Time-Series data from 1990 to 2011, recipient firms will be matched with similar peer firms within the time-series data to create control groups. These control groups will aid in determining the effect of the grant on firm survival using the survival analysis method as they represent the probable case for the recipient firms’ survival had they not received a grant. The survival analysis is based on receiving a grant (a form of capital
acquisition), as well as firm specific characteristics like size and location.
Results from our study suggest that receiving a grant has a positive and significant impact on firm survival, especially start-up firms. The more money a firm received, both from their first VAPG and from all VAPG’s, the longer the firm survived, although conditional on receiving a grant, the size of the grant did not significantly increase firm survival. Receiving a relatively small (planning) grant did not have a significant effect on survival. Further evaluations were done to determine if the established control group represented good matches for the treatment group. We estimated the probability of firms in the dataset receiving a VAPG, conditional on the matching process, and results suggest that, though small and medium sized firm are more likely to be selected, recipients of the grant are approximately randomly selected with some preference for those who appear to be most successful. Other results from this study begin to provide some direction for areas of future research related to the grant program and firm survival. For
example, future research might further explore the influence of the VAPG program on firm survival across different industries, the effects of differing funding levels, and the impacts on job creation.
CHAPTER II LITERATURE REVIEW
2.1 Value-Added Agriculture
To increase both rural development and agricultural entrepreneurship, many have been looking to value-added agriculture (Coltrain, Barton, & Boland, 2000; Kilkenny & Schluter, 2001; Womach, 2005). In the past, rural farm subsidies were viewed as an avenue for rural development. However, these farm subsidies were largely based on farm size, encouraging producers to seek low-cost methods and obtain economies of scale. In order to achieve
economies of scale, many farmers were pushed to consolidate, leaving a smaller rural population than before. Ultimately, farm subsidies did not achieve the goals of rural development as the number of jobs in agriculture and rural communities fell (Schenheit, 2013).
The role of value-added agriculture has been increased and promoted during the last few years given the weakening role of production agriculture as well as increased job loss and
reduced workforces in rural areas (Clemens, 2004). Studies have been conducted on value-added agriculture as a development strategy for rural areas, especially those involved highly in
agriculture. One study of county level economic growth factors in the Midwest indicated that more economic growth stemmed from farmers who engaged in value-added livestock production that their peers who did not (Monchuk, 2006). Additionally, increased revenues are distributed throughout the community from value-added agricultural operations (Drabenstott & Meeker, 1997). Counties with greater reliance on agriculture displayed less growth than those with less reliance, except for those counties which had a greater share of valued-added agriculture (Monchuk, 2006).
Value-added agriculture can be viewed in two different ways. First, the “typical” form of value-added agriculture consists of raw product processing (Coltrain, Barton, & Boland, 2000; Amanor-Boadu, 2003). In order to create more value, one must complete an activity that would have otherwise occurred farther down the processing chain after leaving the producer (Brees, Parcell, & Giddens, 2010). Typically, some degree of vertical integration can be seen in value-added agriculture. Increased vertical coordination boosts the farm’s ability to decrease farm-to-retail price spreads through the integration of production, processing, and sometimes, farm-to-retail. This can increase profits, but also leads to more risk falling onto the producer (Schenheit, 2013).
Second, the concept of value-added agriculture has recently expanded to include
particular characteristics of goods which set their identity apart from other similar goods, such as local or organic labels (Womach, 2005; Ernst & Woods, 2011; U.S. Department of Agriculture Rural Business-Cooperative Service, 2015). Local foods have become ever more popular among consumers and producers as a means of value-added agriculture (Liang, 2015; Woods, Velandia, Holcomb, Dunning, & Bendfeldt, 2013; Hardesty, 2010; Onken & Bernard, 2010). Many farmers and consumers prefer local foods due to the mutually beneficial relationship that is built. Farmers are able to receive a premium from their customers’ preferences and consumers are able to have their specific preferences met which may include knowing the source of the product (sometimes down to the farmer level.) This relationship gives value-added agriculture producers a
competitive advantage over their commodity producing peers (Born, 2001; Brees, Parcell, & Giddens, 2010).
Competitive advantages can be gained by being the lowest-cost producer, the most consistent producer or being the first to market with a new practice. Such advangtage helps the farmers to gain increased income and profitability. (Born, 2001; Brees, Parcell, & Giddens,
2010). By partaking in value-added agriculture, the producer weighs their potential for increased profits against their increased risks. Producers who engage in “new” value-added agriculture activities, where consumers prefer a particular trait, generally have decreased risks relative to those producers who are more focused on “typical” valued-added agriculture activities, where value shifts within the production sequence (Brees, Parcell, & Giddens, 2010).
Given that a variety of groups including farmers, policymakers, funders, and researchers are involved in value-added agriculture in some manner, the need for a consistent definition can be seen, especially when working on funding projects (Lu & Dudensing, 2015). However, many definitions for value-added agriculture exist today and are often inconsistent with one another. For example, the United States Department of Agriculture (USDA)’s definition of value-added agriculture focuses heavily on the revenues received by the producers. Others, such as
economists and policymakers may be more likely to define value-added agriculture by the firm’s input into the gross regional product (GRP). Smaller, more rural communities may benefit from these increases in GRP as the local value chain now receives extra income relative to other agricultural systems where processing of raw commodities is conducted outside of the region, redistributing the value from the producers to the processors. Differing definitions for value-added agriculture can hinder the ability for unified goals and analysis for the success of programs and policies related to value-added agriculture. (Lu & Dudensing, 2015).
2.2 USDA Value-Added Producer Grant
One of the many grants that supports value-added agriculture is the Value-Added Producer Grant (VAPG). The VAPG is a competitive grant administered through the USDA’s Rural Business-Cooperative Service to aid and support value-added agricultural operations. The
grant program aids farmers and ranchers, as well as similar groups and organizations, involved in value-added agriculture enterprises by providing funds for the planning and capital investment of such operations (Leval, Tuttle, & Bailey, 2005). The VAPG is one of the many programs that the USDA Rural Business-Cooperative Service employs to achieve their mission of supporting rural business development. The government has maintained the rural economy as a priority since the 1950’s.
Federal and state governments have continued interests in rural business development as a strategy for rural development (Kilkenny & Schluter, 2001). While agricultural employment in rural communities has declined dramatically over the past half century, agriculture remains an important driver in rural regions of the United States. As a result, policies that promote the development and flow of capital to the agricultural sector are viewed as a logical and effective strategy for rural business development (Van Auken & Carraher, 2012). The VAPG was established with the objective of aiding independent producers, producer groups, farmer or rancher cooperatives, and majority-owned producer businesses in the development of business plans and marketing opportunities into new or emerging markets (Young, 2006).
2.2.1 Grant establishment
In 1998, A Time to Act, a report by the USDA National Commission on Small Farms was
released. Within the pages of the report, the Commission outlined suggestions on how the USDA could further their efforts in the promotion of value-added processing and marketing of goods from small farmers and ranchers. One of the main recommendations was the creation of new programs specifically targeting the enhancement of value creation within and on small farms so as to allow the producers an opportunity for increased profits (National Commission on Small
Farms, 1998). The USDA implemented their first program, the Value-Added Agricultural Product Market Development Grant (VADG) in 2001 as a part of the Agricultural Risk
Protection Act of 2000 code 231(a), a crop insurance reform bill. For the first time, $10 million was provided to fund grants for value-added agricultural activities (Rural Business-Cooperative Service, 2001).
The VADG program was administered by the USDA Rural Business-Cooperative Service (Rural Business-Cooperative Service, 2001). Later, another round of funding, consisting of an additional $10 million, became available from an emergency supplemental appropriation bill. The initial $20 million provided grants received during 2001 and 2002 (Leval, Bailey, Powell, & Tuttle, 2006). During this time, the grant funds could be used in two different ways: (1) develop a business and marketing plan for a product or (2) investment in value-added business activities which enhance the producer’s ability to compete in the market (Rural Business-Cooperative Service, 2001). The VADG program became the USDA Rural Development’s first initiative to focus on value-added activities helping them to make further strides in achieving their mission to “improve the economy and quality of life in all of rural America (U.S. Department of
Agriculture Rural Development, n.d.).”
2.2.2 Grant changes and revisions
Though the program was first established in 2001, it was not until May 2002 when the Farm Security and Rural Investment Act (2002 Farm Bill) was passed that the program was formally included in legislation (Hunt, 2002). Under the 2002 Farm Bill the program was formally renamed the Value-Added Producer Grant (VAPG) program. In order to be included in the 2002 Farm Bill, details of the grant needed to be better defined, including the definition of a
“value-added product.” The initial definition given in the 2001 Notice of Funds Availability (NOFA) was solely focused on the processing of a product in which the value therefore was increased (Rural Business-Cooperative Service, 2001). Once placed in the Farm Bill, the definition was expanded to include three different dimensions of “value-added” which include:
i. a change in the physical state of form of the product (such as milling wheat into
flour or making strawberries into jam);
ii. the production of a product in a manner that enhances its value, as demonstrated
through a business plan (such as organically produced products);
iii. the physical segregation of an agricultural commodity or product in a manner that
results in the enhancement of the value of that commodity or product (such as an identity preserved marketing system) (Rural Business-Cooperative Service, 2002).
This grant program was seen as a way to improve coordination between economic development and farm subsidies, improve producer incomes and profits, build rural amenities, and to increase rural employment opportunities. Relative to other competitive grants, the VAPG was unique given that the money awarded could be utilized to pay for a variety of expenses the firms may have ranging from labor to marketing expenses and working capital. One exception to the use of funds is that it cannot be used for certain types of physical infrastructure such as buildings. The idea behind the grant was to promote smart business investments while reducing the amount of risk and uncertainty taken on from these investments (Boland, Crespi, & Oswald, 2009). Priority was given for funding the VAPG in the 2002 Farm Bill for the first time as well (Rural Business-Cooperative Service, 2002).
Since 2002, the VAPG has undergone a number of changes and revisions ranging from a reduction in the maximum grant amounts to changes in eligibility criteria. Over this time though, the grant has maintained its goal of increasing producer profitability and aiding market
expansion. More recently, preferences have been introduced which reflect more urgent categories for funding projects such as bio-based projects like manure digesters (Schenheit, 2013).
From 2001 to 2004, there was only one type of VAPG and the maximum funding level was $500,000 (Rural Business-Cooperative Service, 2001; Rural Business-Cooperative Service, 2002; Rural Business-Cooperative Service, 2003; Rural Business-Cooperative Service, 2004). In 2005, two types of grants, a planning grant and a working capital grant, were created to better focus grant dollars. The planning grant had a maximum grant amount of $100,000 while the working capital grant’s maximum amount was $150,000 (Rural Business-Cooperative Service, 2005a). Maximum grant amounts for the working capital grant were increased to $300,000 from
2006 to 20121 while planning grant limits remained unchanged (Rural Business-Cooperative
Service, 2005b; Rural Business-Cooperative Sevice, 2007; Rural Business-Cooperative Service, 2008; Rural Business-Cooperative Service, 2009a; Rural Business-Cooperative Service, 2009b).
In 20142, both grant types saw a reduction in funding as planning grants were limited to $75,000
and working capital grants at $200,000 (Rural Business-Cooperative Service, 2013). For 2015, and currently in 2016, the maximum funding level for planning grants has remained stable while the maximum funding level for working capital grants have been increased to $250,000 (Rural Business-Cooperative Service, 2015; Rural Business-Cooperative Service, 2016).
1 Due to NOFA posting errors, 2009 grants were not awarded until 2010. Additionally, due to budgetary issues, 2011 and 2012 grant payments were bundled.
When the grant was first developed very few priorities for who should receive the grants were made. Over time, as the grant has evolved and become more refined, preferences and special emphases have been developed to award particular groups a larger share of the grants. These groups include beginning, socially-disadvantaged, and veteran farmers as well as tribal groups. Additionally, the definition of a value-added product has continued to evolve, slowly becoming more descriptive and targeting certain types of value-added agriculture. The current definition now has five dimensions versus the 2002 Farm Bill version which had just three. Many of these changes have been made through public comments during open comment periods as well as through the direction of the presiding President’s initiatives. Further details about changes made to the VAPG between 2001 and 2016 can be found in Appendix table A.1.
2.2.3 Current application requirements
The most recent VAPG NOFA is for fiscal year 2016. The notice invites applications from independent producers, agricultural producer groups, farmer and rancher cooperatives, and majority-controlled producer-based businesses. Grant funding priorities currently include producers with small and medium-sized operations, especially those operating as a family farm or ranch. Ten percent of funds are reserved for beginning, veteran, and socially-disadvantaged farmers or ranchers. Another ten percent is held for producers proposing projects which develop
mid-tier value chains3. Grant funds can be used for starting or expanding processing or
3The definition of mid-tier value chains as defined by the 2009 Notice of Funds Available released by the USDA’s Rural
Business-Cooperative Service is as follows: “Local and regional supply networks that link independent producers with businesses and cooperatives that market Value-Added Agricultural Products in a manner that—
(1) Targets and strengthens the profitability and competitiveness of small and medium-sized farms and ranches that are structured as a family farm; and
(2) Obtains agreement from an eligible Agricultural Producer Group, Farmer or Rancher Cooperative, or Majority-Controlled Producer-Based Business Venture that is engaged in the value chain on a marketing strategy.
marketing initiatives for value-added agricultural products (Rural Business-Cooperative Service, 2016).
The current definition of a value-added agricultural product is:
(1) The agricultural commodity must meet one of the following five value-added
methodologies:
i. Has undergone a change in physical state;
ii. Was produced in a manner that enhances the value of the agricultural
commodity;
iii. Is physically segregated in a manner that results in the enhancement of
the value of the agricultural commodity;
iv. Is a source of farm- or ranch-based renewable energy, including E-85
fuel; or
v. Is aggregated and marketed as a locally-produced agricultural food
product.
(2) As a result of the change in physical state or manner in which the agricultural
commodity was produced, marketed, or segmented:
i. The customer base for the agricultural commodity is expanded and
ii. A greater portion of the revenue derived from the marketing,
processing, or physical segregation of the agricultural commodity is
(3) For Mid-Tier Value Chain projects the Agency recognizes that, in a supply chain network, a variety of raw agricultural commodity and value-added product ownership and transfer arrangements may be necessary. Consequently, applicant ownership of the raw agricultural commodity and value-added product from raw through value-added is not necessarily required, as long as the mid-tier value chain proposal can demonstrate an increase in customer base and an increase in revenue returns to the applicant producers supplying the majority of the raw agricultural commodity for the project.”
available to the producer of the commodity (Rural Business-Cooperative Service, 2016).
Planning grants can be awarded with amounts up to $75,000 and used for the development of planning activities in order to conclude if a value-added venture is viable. Specifically, planning grants can be used to carry out a feasibility study, design a business plan or to create a marketing plan for a value-added agricultural product. Working capital grants can fund up to $250,000 with monies being used on operations related to the value-added product or project. These funds should be utilized to cover expenses aiding processing activities as well as fulfilling marketing strategies. All grant funds received through the VAPG program require a $1 to $1 match from the recipient (Rural Business-Cooperative Service, 2016).
2.3 Previous Analyses of the USDA VAPG
Few others have researched the United States Department of Agriculture’s (USDA) Value-Added Producer Grant (VAPG). Leval, Bailey, Powell, and Tuttle (2006), on behalf of the Center for Rural Affairs, conducted a comparison of VAPG program funding relative to three other USDA grant programs by measuring the number of projects funded and the quality of the projects funded based on the VAPG application. The report concluded that the VAPG did a better job than the three other grants at targeting small and medium-sized farmers and ranchers (Leval, Bailey, Powell, & Tuttle, 2006).
Another study of the VAPG was done by Boland, Crespi, and Oswald (2009) and updated by Schenheit (2013). In this particular study, they found that large firms are more likely to
receive a grant and receive a greater proportion of these grants than small firms. Larger grants went to existing firms who were looking to diversify by expanding into new, value-added
markets. Their findings suggest that when an existing firm chooses to expand they have good information and knowledge about the market they are pursuing. Such knowledge is used to determine market potential before entering. Very few new firms were given grants of similar size, but rather received smaller grants. Additionally, some states have designated job positions to help with business development and feasibility studies before smaller firms apply for a VAPG to help them compete against the larger, existing firms (Boland, Crespi, & Oswald, 2009).
The main purpose of these studies was to determine the impact of business success in terms of growth through nine start-up business steps (Boland, Crespi, & Oswald, 2009; Schenheit, 2013). In both studies, no control groups were implemented to determine a
benchmark when evaluating for success. For our study, in order to better measure the impact of the VAPG funding on business success, we have matched recipient firms to similar firms who did not received a VAPG in order to create a benchmark for determining what would have likely occurred if the recipient had not received the grant. Our study then utilizes these control groups to determine the effect of the grant on the survival of the recipients relative to their non-recipient peer group. If the grant is effective, we would expect for the VAPG recipient firms to survive longer than their peer group. Currently, none of the existing studies of the VAPG program have assessed the impact of funding on firm performance by assessing how the funding impacts firm survival.
2.4 Firm Survival
A firm’s survival rate is the probability that a firm survives over a given period of time and is driven largely by market attributes and individual firm characteristics. Additionally, the survival of a firm may also be based on the stage of development the firm is in, which may be
affected by the market as well as by the factors which link entry, exit and survival to the market (Agarwal & Gort, 1996).
Survival analysis has been utilized to study the survival of firms. Datasets which are capable of such analysis are hard to come across or create (Risch, Boland, & Crespi, 2014). Results from a number of survival analysis studies propose that larger, older firms tend to survive longer relative to smaller, newer firms (Disney, Haskel, & Heden, 2003). Hazard rates, the probability of a firm failing, are the highest when a firm is new, operating as a start-up, versus when older and producing closer to their minimum efficient scale (Audretsch & Mahmood, 1995).
2.4.1 Age
Studies have shown that firm risk decreases as the firm ages (Dunne, Roberts, & Samuelson, 1989; Audretsch D. B., 1991; Baldwin & Gorecki, 1991). Age is closely related to the stage of development. Firms who are active in the market longer are more likely to learn and observe the true costs of remaining in that market while also increasing their efficiency. This decreases their risk of failure (Jovanovic, 1982). Younger firms are exposed to higher levels of risk, especially during their first few years (Geroski, 1995; Caves, 1998). A variety of studies covering different industry sectors across numerous countries have revealed that within the first five years of operation more than 50 percent of new firms are likely to fail (Dunne, Roberts, & Samuelson, 1989; Geroski, 1995; Audretsch, Santarelli, & Vivarelli, 1999).
Established firms are not immune to risk and failure. Typically, established firms have a higher probability of surviving, but they must still overcome economic shocks such as changes in the industry like new technologies (Utterback & Abernathy, 1975; Gort & Klepper, 1982). By
taking on innovative activities and strategies, established firms are able to combat some of these market changes and will improve their capabilities (Banbury & Mitchell, 1995; Christensen, 1997).
2.4.2 Location
Another factor affecting firm survival is firm location. Generally, rural business
development theory has suggested that metropolitan areas favor entrepreneurship more so than rural areas. Within these metropolitan areas, firms are able to create niche markets for
themselves by utilizing new technologies or tapping into specific preferences of the consumer base (Hoover & Vernon, 1959; Leone & Struyk, 1976; Renski, 2008). New firms are highly susceptible to the local economic environments and markets (Renski & Wallace, 2013).
Rural regions tend to have lower financial costs as well as non-monetary costs relative to larger cities (Atkinson, 2004). Similarly, these rural regions can easily leverage their natural resources in order to attract new firms (Drabenstott, 2003). However, rural areas are subject to limited local demand from smaller consumer bases, lack of crucial services or supporting organizations, seclusion from bigger markets, and absence of specialized infrastructure. These factors represent some of the barriers to entry for new firms in rural locations (W.K. Kellogg Foundation & Corporation for Enterprise Development, 2003). Given the disadvantages that rural regions seem to be faced with, it could easily be anticipated that new firms would be more attracted to the advantages of an urban setting and choose to locate in these markets rather than more rural markets (Renski H. , 2008). Therefore, one could say that urban areas have an advantage over rural areas (Monchuk, 2006).
Survival rates of new firms by geographical location has been studied very little. Those who have delved into this area of research suggest that there is very little difference between survival rates of new firms between urban and rural areas (Reynolds, 1987; Buss & Lin, 1990; Forsyth, 2005). Stearns, Carter, Reynolds and Williams (1995) on the other hand find that rural firms have increased survival rates relative to urban firms. Similar results have been echoed by Yu, Orazem, and Jolly (2009) who found that rural firms have a 25 percent advantage for survival over their urban peers.
2.4.3 Capital acquisition
A number of studies have shown that lack of access to capital is one of the biggest challenges that start-up entrepreneurial firms face (Markley, 2001; Barkley, 2003; Wiklund & Shepherd, 2003; Rubin, 2010). The acquisition of capital for new firms plays a significant role in business operations, risk, and the firm’s overall performance (Cassar, 2004). Securing capital for new firms may be tricky, especially in rural areas, as banks tend to prefer lending to less risky firms with stable revenue streams (Renski & Wallace, 2013). Acquiring external funding can be costly for new firms as they must fulfill the requirements of the private lenders. Some firms, therefore, choose to operate with internal funds only given the extra cost and effort needed to obtain external funding when the amount sought may be quite small relative to this premium (Holmes, Dunstan, & Dwyer, 1994; Stouder & Kirchoff, 2004). Lack of capital can put firms at a disadvantage relative to other, more adequately capitalized firms in the market (Wiklund & Shepherd, 2003).
Compounding the problem of acquiring adequate capital during the start-up or expansion phases, rural firms may also face an asset fixity problem. Yu, Orazem, and Jolly (2009) pitch
asset fixity as a plausible cause for longer survival of rural firms. Because of thinner markets for capital assets in rural areas, rural firms have a lower expected salvage value relative to urban peers and therefore, have increased barriers to exit. If a rural firm fails, or decides to exit, it will have a harder time selling fixed assets or finding a successor than would an urban firm. As a result, the expected salvage value of the firm at the time of entry is lower in rural areas. These large investments with low salvage values can be viewed as a sunk cost (Johnson & Quance, 1972; Abel & Eberly, 1994; Chavas, 1994). Rural firms must in turn have a higher probability of
success to justify the investment in the firm (Yu, Orazem, & Jolly, 2009)4. Asset fixity occurs
most frequently when an asset is designed to use a very specific input or for limited production and cannot be easily adapted for use with other inputs or for the production of other goods. These constraints create barriers to exit for firms investing in assets as the salvage value of the asset diminishes quickly once the good or input is no longer demanded or readily available. These are assets which typically cannot be sold or transferred (Williamson, 1979).
Chambers and Vasavada (1983) empirically tested the hypothesis of asset fixity, but there was no significant empirical support. Though the hypothesis was not supported, their study changed the way many researchers viewed capital formation. In 1999, Ward and Hite linked the lack of autonomous rural development across regions with asset fixity (Ward & Hite, 1999). Slow exit rates for farmers in the dairy industry were explained using asset fixity by Foltz (2004) while the same explanation was used by Boetel, Hoffman, and Liu (2007) to explain the delayed response of hog production to changes in pork prices. The ethanol industry was studied by Wlodarz (2013) who concluded that one of the major barriers to ethanol production was asset
4 Johnson (1956) proposed this idea to explain the overproduction of commodities during the 1950’s and 1960’s even though many farmers were facing economic losses.
fixity given the limited ability to utilize production facilities or convert assets to handle different inputs after failure of the initial operation.
Firms in rural regions who are faced with asset fixity must evaluate the expected losses from failure, which is largely a function of the salvage value of the assets. In urban regions, where markets are thicker, firms are less prone to asset fixity and therefore, marginal firms will enter the market knowing that there are more opportunities for liquidating assets. Rural peers have a more difficult time moving these assets between firms given the location and costs to move. In order to combat the issue of asset fixity, policies should be developed to help lower costs of entry into rural markets to offset firms for low salvage values if the firm fails (Yu, Orazem, & Jolly, 2009).
Funding grants and forms of lending require matching characteristics of firms with the requirements of funders. This can be a difficult process for small firms, especially those in rural areas, as they do not always fit the requirements (Richards & Bulkley, 2007). Rural America has always consisted of deeply rooted family owned businesses, sometimes for multiple generations. Due to this nature, funders may be less likely to provide capital to these firms as their exit strategies do not align with that of the funders, which typically include options for corporate acquisition or public offerings (Markley, 2001). Niche agricultural markets can help to alleviate some of these funding issues as the producer has the ability to leverage a variety of
characteristics for higher income given consumer preferences which include quality, locality of production, history or heritage, and superior craftsmanship (Dabson, 2001).
Federal, state, and local governments and development organizations, as well as private agencies, have made efforts to boost capital acquisition for rural firms, especially those in niche sectors through the funding of projects (Kilkenny & Schluter, 2001). Even with these efforts,
many rural areas are still being highly underserved (Goreham, 2005). Korsching and Jacobs (2005) stated that these institutions and agencies are needed to help improve the flow of capital into such rural regions and firms. When producers of niche products receive capital, these producers are better off than without such capital. This in turn has a larger effect on the rural communities in which these firms are located, aiding more than just the firm originally funded (Van Auken & Carraher, 2012).
Studies which have used survival analysis in economic research have varied greatly. Esteve-Perez and Manez-Castillejo (2008) determined through their study that research and development, advertising, and age are all related to the amount of risk a Spanish manufacturing firm has. Holmes, Hunt and Stone (2010) studied variables which impact UK firm survival including plant size, exchange rates, and interest rates. The survival of U.S. banks was studied by Wheelock and Wilson (2000). Audretsch and Mahmood (1995) incorporate
establishment-specific features into a previous study using a hazard function with the conclusion that these characteristics play an important role in determining an establishment’s risk. In 2006, Keys and Roberts used this method in agricultural economics to analyze the effect of government
programs on farm survival. Using 1987, 1992, and 1997 USDA Census of Agriculture data, they
determined that the program favored larger farming operations, lowering their risk of failure and increasing survival rates (Key & Roberts, 2006). Continuing the applications of survival analysis in the realm of agricultural economics, Risch, Boland, and Crespi (2014) determined the effect of government policies on the survival of U.S. sugar beet plants from 1897 to 2011. Survival
analysis can be a beneficial means of analysis and we look to contribute to this body of literature further through the use of this method.
2.5 Contribution to Literature
Van Auken and Carraher (2010) suggested that further research should be conducted to examine variables which contribute to firm success and performance, especially within value-added operations. Schenheit (2013) states that receiving a VAPG does not guarantee success, but rather can help to mitigate some risks (while not encouraging extreme risks to be taken.)
This thesis looks to evaluate the effect of receiving a VAPG on firm survival by
comparing a VAPG recipient to a non-receiving peer group using the survival analysis method. The results of such a study will be able to determine the effect of the VAPG, a form of capital acquisition, on recipient’s survival versus their peers’ survival while also including maturity of the firm (start-up or established) and location (urban versus rural.) Descriptive statistics from this study will help to explain who has currently been receiving the grants.
Schenheit (2013) includes a variety of reasons for why there is difficulty in determining the success of the USDA’s VAPG which include: (1) the grant evolving over its lifetime, (2) grants can be given out to both existing and new firms (each receiving the grants for a different focus), and (3) the characteristics of the recipients can vary greatly. Efforts in this study have been made to help address some of these challenges. A comprehensive history of the USDA VAPG, from 2001 to 2016, has been provided to help further explain the grant program and the changes that have occurred since its early beginnings. In order to address concerns regarding the two types of grants awarded, our dataset has been divided into two subsets: start-up firms and established firms. Additionally, utilizing control groups which were created by matching characteristics of VAPG recipients with characters of non-recipient peer firms, we are able to control for some of the other effects between firms. To date, none of the other studies conducted
on the VAPG have taken such approaches, limiting their ability to identify the effects of the grant program.
A study of this type can inform policy and program evaluation as it has been recognized that firm entry rates do not provide a comprehensive understanding of rural entrepreneurship. Many development strategies focusing on entrepreneurship are not solely aiming for new business development, but also striving for growth and survival (Renski H. , 2008). This study will help to shed more light on the success of the VAPG by analyzing firm performance beyond the entry stage to provide a more detailed account of whether, and how, the VAPG enhances firm survival over time and is therefore, an effective use of government dollars for rural development.
CHAPTER III DATA AND METHODS
3.1 Data Description
The goal of this study is to analyze the effectiveness of the VAPG funding on firm success. Using data on VAPG recipients from 2001 to 2011 paired with the National
Establishment Time-Series (NETS) data on all firms in Iowa and North Carolina over the time period from 1990 – 2011, we analyze the impact of the VAPG on firm survival by comparing VAPG recipients with similar firms that did not receive a VAPG. Each recipient firm is matched with non-recipient peers with similar characteristics. These peer groups represent the scenario of what would have happened to the recipient firm had the firm not received a grant. The difference in outcomes between the treatment and control groups within this study will represent the effect of the VAPG on firm survival.
3.1.1 VAPG data
This dataset was created and released for use by Dr. Michael Boland. In order to create the dataset, Dr. Boland compiled a list of USDA VAPG recipients by collecting annual press releases from the USDA Rural Business-Cooperative Service announcing the recipients. In order to gain more information, the recipients were contacted via surveys, personal interviews, and phone calls (Boland, Crespi, & Oswald, 2009). Independent producers were the most difficult group to find information on and some cases, the dataset lacks adequate information on these firms. Unfortunately, more information could not be collected about these recipients from the USDA as they are restricted by privacy laws (Schenheit, 2013). The dataset contains information
about recipients of the VAPG from 2001 to 2011. Variables contained within the dataset include: name of recipient, year grant was received, state where business resides, and grant amount awarded.
From 2001 to 2011, the VAPG program awarded $249,370,918 in grants to 1,460 unique
recipients in the form of 1,706 grants5. The average grant size was $146,173, though grants
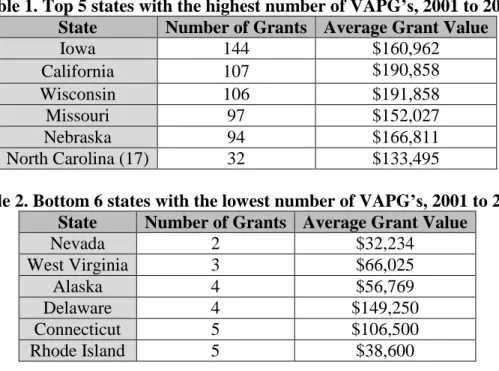
ranged in size from $1,250 to $500,000. Below table 1 and table 2 show which states had the highest and lowest number of grants awarded, respectively.
Table 1. Top 5 states with the highest number of VAPG’s, 2001 to 2011 State Number of Grants Average Grant Value
Iowa 144 $160,962 California 107 $190,858 Wisconsin 106 $191,858 Missouri 97 $152,027 Nebraska 94 $166,811 North Carolina (17) 32 $133,495
Table 2. Bottom 6 states with the lowest number of VAPG’s, 2001 to 2011 State Number of Grants Average Grant Value
Nevada 2 $32,234 West Virginia 3 $66,025 Alaska 4 $56,769 Delaware 4 $149,250 Connecticut 5 $106,500 Rhode Island 5 $38,600
Viewing the recipients from a variety of angles allows us to get a better picture of the grant recipients. Figure 1, figure 2, and figure 3 show how each state plus U.S. territories
compare based on the percentage of grant recipients, grants received, and grant monies awarded, respectively. Orange colored states in the following figures indicate the top five ranking states
5 Firms are not limited to the number of grants they can receive over their lifetime; only by the fact that one (either planning or working capital) grant can be funded at one time by a USDA VAPG.
for the particular figure. The darker the shade of orange, the higher the ranking (ie: Iowa is the darkest shade of orange in figure 1 which represents the state’s top ranking by percentage of total grant recipients.) All blue colored states are states which are not in the top five ranking states. North Carolina has been shaded a dark blue as it is a relevant state for this study as well, but does not fall in the top five ranking states.
Figure 1. States by percentage of total grant recipients, 2001 to 2011
Figure 2. States by percentage of total grants received, 2001 to 2011
0.00% 1.00% 2.00% 3.00% 4.00% 5.00% 6.00% 7.00% 8.00% 9.00% 10.00% Alab am a Arizo n a Cali fo rn ia Con n ec ticu t Flori d a H awaii Illino is Io w a Ke n tu ck y Ma in e Mas sac h u se tt s Min n es o ta Mis so u ri N eb ra sk a N ew H amp sh ire N ew M exi co N o rth C ar o lina Ohio Ore gon Rh o d e I slan d Sou th Da ko ta Te xa s Ve rm o n t Wa sh in gt o n Wis con si n Pu erto Ric o 0.00% 1.00% 2.00% 3.00% 4.00% 5.00% 6.00% 7.00% 8.00% 9.00% 10.00% Alab am a Arizo n a Cali fo rn ia Con n ec ticu t Flori d a Ha w aii Illino is Io w a Ke n tu ck y Ma in e Ma ss ac h u se tt s Min n es o ta Mis so u ri N eb ra sk a N ew H amp sh ire N ew M exi co N o rth C ar o lina Ohio Ore gon Rh o d e I slan d Sou th Da ko ta Te xa s Ve rm o n t Wa sh in gt o n Wis con si n Pu erto Ric o
Figure 3. States by percentage of total grant monies awarded, 2001 to 2011
Iowa has the greatest number of recipients, grants, and total grant dollars awarded. Other Midwestern states with commodity based agriculture rank in the top five states for all three categories along with California and Oregon. These figures, coupled with the information from table 1 and table 2, give a very general picture of what types of firms have received the grants between 2001 and 2011. Additionally, others have reported that many recipients of the VAPG were focused on bio-based and ethanol projects, given the Presidential initiatives, and therefore, a large proportion of the recipients and grant monies were going to producer-owned cooperatives who had the ability to invest in these new, highly technical and capital intensive markets. As of 2001, roughly 16 percent of the grants were awarded to energy related projects, but by 2004, this number had increased to 21 percent (Leval, Bailey, Powell, & Tuttle, 2006).
0.00% 1.00% 2.00% 3.00% 4.00% 5.00% 6.00% 7.00% 8.00% 9.00% 10.00% Alab am a Arizo n a Cali fo rn ia Con n ec ticu t Flori d a H awaii Illino is Io w a Ke n tu ck y Ma in e Mas sac h u se tt s Min n es o ta Mis so u ri N eb ra sk a N ew H amp sh ire N ew M exi co N o rth C ar o lina Ohio Ore gon Rh o d e I slan d Sou th Da ko ta Te xa s Ve rm o n t Wa sh in gt o n Wis con si n Pu erto Ric o
3.1.2 NETS data
Walls & Associates utilizes Dun & Bradstreet (D&B) information on established firms to convert data from annual snapshots into a time-series database called the National Establishment Time-Series (NETS) database. This database provides longitudinal data on the U.S. economy including a variety of dynamics like job creation, survival of firms, changes in markets, historical payment and credit records, sales growth metrics, and patterns in firm movement (Walls & Associates, 2011). The dataset used in this study follows firms from January 1990 until January 2011 in the state of Iowa and North Carolina. Variables found in the dataset include, but are not limited to, name of firm, state, first year of business, last year of business, location (given by the
rural-urban continuum code6), and industry (provided by the North American Industry
Classification System7) (Walls & Associates, 2011).
This particular dataset has been utilized in other studies related to business and
entrepreneurship. Neumark, Wall, and Zhang (2011) used NETS data in a study to determine the role of small businesses in job creation. Lee (2012) used the same dataset to study how
children’s exposure to different food outlets affects their health over time. Additionally, Goetz, Flemming, and Rupasingha (2012) determined the impact of self-employed individuals on the economy by incorporating the NETS data into their study. These studies, along with others who have used this dataset, have coupled it with other less descriptive datasets for greater research
6 A system of classification, as defined by the USDA Economic Research Service (ERS), which differentiates counties by their population and adjacency to a metropolitan area. The codes range from 1 – 9, with 1 being the largest metro area and 9 being the most rural and least population regions. Further details about the rural-urban continuum codes are provided in the appendix.
7 Used by Federal statistical agencies as the standard classification system of business establishments, the North American Industry Classification System (NAICS) uses a set of 6 digit codes to represent industries within North America. The more digits provided in the classification code, the more description is being given about the industry.
potential. Though there are places were this dataset may have flaws, it is still considered to be one of the best sources of longitudinal data when looking into firm survival (Reedy, 2011).
3.1.3 Available data
By pairing information on the VAPG recipients with the NETS data, we are able to track entry and exit of grant recipient firms and their peers from 1990 to 2011, even though the VAPG program began in 2001. Given that our NETS database is limited to Iowa and North Carolina, our finalized dataset for this study will only include VAPG recipients from these two states as well as their respective peer groups. The descriptive statistics from the VAPG data shows us that Iowa is the top grant receiving state while North Carolina falls somewhere in the middle. The two states are geographically different and have differing agricultural industries. This increases the likelihood that the results of the study will generalize to other regions of the United States.
Over the study time period, Iowa and North Carolina were facing their own changes within the local agricultural industry, which also makes them interesting states to study. With the decline of the rural economy and removal of farm subsidies, many Iowa farms were consolidated into larger farms which focused on commodity crops and large-scale, low-cost livestock
production. Meanwhile in North Carolina, tobacco subsidies had been removed following the 1964 U.S. Surgeon General announcement linking smoking to lung cancer. In a similar fashion to Iowa, North Carolina’s small tobacco farmers needed a new source of income pushing them to move away from their farms. Both states have begun to see new sectors within their agricultural industries appear to combat the declining rural economy. Iowa has seen a transition into value-added renewable energy and specialty crops such as grapes and vegetables. Organizations in
North Carolina have been established to help aid farmers interested in marketing value-added crops through farmer’s markets, producer-owned cooperatives, and other similar outlets.
3.1.4 Data preparation
The first step in constructing the dataset for analysis was to match the VAPG recipients with the NETS database. Table 3 shows results from the matching process.
Table 3. Results from matching VAPG recipients with NETS State Matched Recipients Total Recipients Percent Matched
Iowa 101 121 83.5%
North Carolina 27 29 93.1%
We were able to match 101 of the 121 (83.5%) Iowa grant recipients and 27 of the 29 (93.1%)
North Carolina grant recipients8. Unmatched firms are provided in the Appendix table A.2. Next,
the matched recipients were researched to determine what the primary purpose of the firm was and the NAICS codes were checked to make sure they appropriately reflected this. NAICS codes provide a six-digit code that represents the industry in which the firm generally operates. Some of the firms’ NAICS codes were not appropriately identified in the NETS data, and therefore,
their NAICS codes were recoded to better reflect the industry in which the firm operates9. Firms
8 Matching of firms between the two datasets was not a particularly easy and straight forward process as the two datasets were put together using different information sources. A few of the recipient firms matched directly however, many required more effort. Matching some firms required creative searches within the NETS dataset; for example, Central Iowa Renewable Energy LLC was spelled differently in the two datasets. Even some creative searches were unable to yield a match; for example, Iowa Choice Harvest, a frozen food manufacturer who received a 2010/2011 VAPG for planning and marketing expenses could not be located in the NETS database. In this case, given that the grant was for planning and the firm could have received a grant in 2011, it may not have been in existence January 2011, the time which the NETS dataset was compiled for 2011, and the last year available at the time of this study. It is also possible that some unmatched firms may have formed and failed between two NETS dataset “snapshots” and therefore, never been accounted for in the dataset.
9 This is one flaw of the NETS dataset that could be corrected to some degree. For example, Picket Fence Creamery, a dairy farm and dairy product retailer, was coded as “All other specialty trade contractors.” We corrected this to more appropriately reflect what the firm does or what aspect of the business the grant was used for.
which were miscoded, but could not be adequately recoded were removed10. Results from the NAICS recoding process are shown in table 4.
Table 4. Firms removed due to miscoded NAICS code
State Removed Recipients Total Recipients Percent Removed
Iowa 5 121 4.1%
North Carolina 1 29 3.4%
For Iowa, 5 firms (4.1%) were miscoded and ultimately removed. For North Carolina, the same was true for 1 firm (3.4%.) These firms are included in Appendix table A.3.
After recoding the NAICS codes, we constructed control groups for each of the recipients. Comparison groups are a popular strategy amongst evaluators as they can help to better assess the impact of a policy or program. Such methods are used as an alternative to randomized experiments when trying to determine the effects of specific programming.
Additionally, this method can isolate the effects of a particular program in order to provide better information for evaluation. Control groups allow the researcher to ask, “What would have
happened if the program were not to exist?” By pairing the treatment group with a set of peers which represent the control group, the different outcomes of the two groups can be compared in order to determine the effects of the program or policy. Unlike randomly assigned treatment and control groups, the control groups in comparison group designs are selected with the expectation that they should be as similar to the treatment group as possible. Comparison group design, just like many other experimental designs, has flaws, but this method can also be very useful and
10 A firm was removed if their NAICS code was not appropriately coded as determined by the firm name, a website, press release or from any other method of obtaining information about the firm. For example, two firms which were removed, BioMass Agri-Products, LLC and Heartland BioEnergy, operate in industries which (as of the last NAICS code revisions in 2012) do not have appropriate groups. These firms are a biorefinery for converting feedstocks to fiber-based products (many times used in landscaping) and a biorefinery with a biochar plant, respectively. Given their inappropriate NAICS codes, we chose to remove these firms and ones with similar scenarios as the control groups would ultimately not be representative peers.
help to build a simple enough story that can easily be interpreted by the audience, which typically consists of the public or policymakers (Henry, 2010).
In this particular study, our comparison groups are constructed by matching our treatment group to their control group based on a few key characteristics. This type of design is referred to as matching group design. By matching treatment and control groups, we are able to make sure the two groups are as similar as possible. Though the two groups are matched, there will still be some unobserved effects that may show up in the estimates. One way to help reduce the amount of unobserved effects between the two groups’ estimates is to match the groups on as many variables as possible (Henry, 2010).
Our treatment group (VAPG recipients) are matched with peer firms from the NETS database which are located in the same state, started in the same year, and have the same NAICS code (or are operating in the same industry.) We required each control group to consist of at least
three non-recipient peers11. In order to meet this threshold, some of the matching criteria were
loosened so that we could maintain as many VAPG observations as possible. In cases where there were not at least three non-recipient peers starting in the same industry and same year, we
matched at a five-digit NAICS level12 or included firms in the same industry that began up to
two years before or after the recipient firm13. We did not allow matching across states however.
That is, all Iowa recipients are matched only with other Iowa firms and all North Carolina
11 Most firms in the dataset were able to have control groups established by matching the state, start-up year, and NAICS code while maintaining at least three non-recipient peers. These firms were typically conducting business similar to many other firms in the state, but focusing on a niche market such as Delaware County Meats, a small scale meat processor, or Green Visions Inc., an organic farm.
12 Yamco LLC did not have three non-recipient peers at the six-digit NAICS code level, it’s control group was formed by moving to the five-digit level which increased the group to 14 non-recipient peers.
13 For example, Golden Grain Energy’s control group includes non-recipient firms from the year below their start-up year. This is due to the fact that, at least as reported in the NETS dataset, no more than two non-recipient firms in 2003 started in the recipient’s NAICS code.
recipients are matched with other North Carolina firms. Due to the inability to create a control
group some firms were removed14. Results from this process are in table 5.
Table 5. Firms removed due to lack of control group
State Removed Recipients Total Recipients Percent Removed
Iowa 6 121 4.9%
North Carolina 1 29 3.4%
In Iowa, 6 (4.9%) recipients were removed while 1 (3.4%) North Carolina recipient was removed. In Appendix table A.4 removed firms are listed.
Additionally, commodity groups and agricultural associations are eligible to receive a VAPG. Given that associations can vary greatly, especially in terms of funding sources, and
operate differently than a typical firm, we have removed them from this study15. Table 6 shows
these results.
Table 6. Associations removed
State Removed Recipients Total Recipients Percent Removed
Iowa 9 121 7.4%
North Carolina 5 29 17.2%
14 Tabor Home Vineyards & Winery was removed due to the inability to establish a control group. This particular firm existed before wineries became popular in Iowa. To get at least three non-recipient peers into a control group for this firm we would have had to expand to at least three years after the firm’s start-up year making them less like the recipient as the probability of failure begins to decrease around three years.
15 Some of the associations removed are large, commodity groups within the states funded through check-off dollars such as the Iowa Corn Growers Association and Iowa Pork Producers Association. We know that the effect of the funding on firm survival is very low given that they will be funded as long as their respective commodity is
produced. Additionally, some other non-commodity groups and associations were removed like Practical Farmers of Iowa, Smoky Mountain Native Plants Association, and Grow You Small Market Steering Committee as they likely do not operate like a for-profit firm.