D I F F U S I O N T E N S O R I M A G I N G
N I K O S M A K R I S G . M . P A P A D I M I T R I O U A . J . W O R T H B R U C E G . J E N K I N S L . G A R R I D O A . G R E G O R Y S O R E N S E N V . J . W E D E E N D A V I D S . T U C H O . W U M E R I T E . C U D K O W I C Z V . S . C A V I N E S S J R . B . R . R O S E N D A V I D N . K E N N E D YThe central nervous system (CNS) spans across different levels of organization, covering the gamut from genes to behavior. It is the aim of neuroscience to elucidate all these levels at a gross and an ultrastructural resolution and to define the relationships among them. One of the highest levels of organization is the systems level, which includes the motor, sensory, and central neural systems. Among the central systems are included those related to cognitive func-tion, such as attenfunc-tion, memory, language, and executive function. Each system can be considered as a set of intercon-nected processors or centers constituted by nerve cells. Their physical connections are composed of axons of different lengths that can form fascicles as they run from origin to destination. Within the neocortex, these connections are selective and architectonic (1). Howcytoarchitecture, con-nections, and function relate within the neocortex is a fun-damental problem in neuroscience. This question addresses basic organizational principles of the nervous system and aims to elucidate the mechanisms through which the cere-brum mediates behavior (2,3). Behavior, to a large extent the product of cerebral function and at the same time a modulator of this function, is certainly the key to solving the problem of meaning related to any neural system. To explore thoroughly the behavioral dimension of an organ-ism, it appears necessary to perform studiesin vivo.If
experi-Nikos Makris, G. M. Papadimitriou, A. J. Worth, Bruce G. Jenkins, L. Garrido, A. Gregory Sorensen, V. J. Wedeen, David S. Tuch, O. Wu, Merit E. Cudkowicz, V. S. Caviness, Jr., B. R. Rosen, and David N. Ken-nedy: Massachusetts General Hospital, Harvard Medical School, Boston, Massachusetts.
ments were designed in such manner that information re-lated to structure was gathered along with behavioral information, we would have an ideal setting for struc-tural–functional or, in the case of disease, anatomic–clinical correlation. This can be done in the domain of neuroimag-ing by usneuroimag-ing currently available technology in an unprece-dented way. In the past two centuries, functional–structural correlations were derived mostly from experimental nonhu-man material, whereas anatomic–clinical correlations were derived principally from human behavioral and, eventually, postmortem lesion analyses. With the tremendous develop-ment of magnetic resonance imaging (MRI) technol-ogy—both structural and functional MRI (fMRI) and mag-netic resonance spectroscopy (MRS)—the study of the structure, function, and metabolism of the living human is an ongoing reality.
One of the latest advancements of MRI technology has beendiffusion tensor imaging (DTI), a technique capable of measuring the diffusivity of water molecules and rendering visible the preferential orientation of their movement. As water molecules diffuse within the brain, their movement is constrained by the structural ‘‘fingerprint’’ of the tissue. If the tissue is equally distributed in all directions, like light in a room, then a ‘‘random walk’’ of water molecules occurs and their diffusion isisotropic (i.e., ‘‘equally behaving’’ in all directions). On the other hand, within a strongly ori-ented tissue such as a white matter tract, water diffusion is not equal in all directions but is insteadanisotropic, specifi-cally predominant along the direction of the tissue. The strongly parallel axonal arrangement within a fiber bundle creates a highly oriented and anisotropic environment for
water molecules. Because DTI can measure the anisotropy and orientation of a tissue, and because brain white matter can be characterized to a large extent by its orientation and anisotropy, the detection of white matter fiber pathways has become feasible in the living brain.
Tractography(i.e., the ‘‘writing’’ or tracing of tracts) has been considered to be the most difficult task in neuroana-tomy (4). To delineate neuroanatomic connections exactly, white matter fiber tracts have been traced systematically in postmortem experimental material during the last decades. It has emerged from studies in nonhuman primates that fiber pathways establish connections between distinctive ar-chitectonic cortical areas, and that they constitute funda-mental components of neural systems that subserve specific functions (1,5,6). Extensive research during the past two centuries in higher brain function (and aphasiology in par-ticular) has demonstrated the tight relationship between damage of commissural or associational fiber tracts and breakdown in cognitive human behavior (7–9). In the light of brain organization at a systems level in terms of architec-ture and its connections, it becomes evident howrelevant the precise knowledge of neocortical pathways is to the un-derstanding of human behavior in normal and disease states. Although the delineation of fiber tracts has been accom-plished precisely and comprehensively in postmortem non-human primates, this goal has not been met in non-humans satisfactorily. Moreover, the study of fiber tractsin vivo is only beginning and is largely based on MRI techniques. DTI is one avenue that may provide solutions to the connec-tional structure of the CNS. Even though the identification and reconstruction of major fiber bundles has been accom-plished with the use of DTI and computational techniques, the basic problems related to the biological sources of the DTI signal remain to be clarified. Thus, to achieve a com-prehensive understanding of the sensitivity and specificity of the DTI technique, studies addressing both the gross and ultrastructural level of the white matter are necessary.
In this chapter, we overview the connectional composi-tion of the cerebrum, emphasizing the morphology and ar-chitectonic structure of its pathways. Subsequently, we over-viewthe DTI technique and illustrate its use at an ultrastructural and a gross neuroanatomic level. In this per-spective, we elaborate on three representative white matter fiber pathways of the brain and emphasize how they can be mapped in terms of computational MRI neuroanatomy. Additionally, we discuss the utility, potential, and limita-tions of the DTI technique in the context of its applicalimita-tions and its integration within a larger neurofunctional MRI examination. For this purpose, we present a case of amyotro-phic lateral sclerosis that we studied with MRI, DTI, MRS, and fMRI.
OVERVIEW OF WHITE MATTER PATHWAYS Anatomic Connections
The white matter of the CNS contains axons serving corti-cocortical, commissural, cortico-subcortical, and cerebellar
connections. These connections can be categorized in three principal classes—namely, associational, commissural, and projectional. Intrahemispheric associational corticocortical connectivity in particular is accomplished in general by (a) short U fibers that constitute the local circuitry within a gyrus, (b) intermediate-range fibers within the extent of a lobe, and (c) long association pathways that connect differ-ent lobes (10). A tract can be described at a morphologic level in terms of a set of descriptors (i.e., its stem, splay, and origins and terminations), whereas the set or map of its architectonic connections is its principle structural de-scriptor.
Morphologic Descriptors of a Fiber Pathway
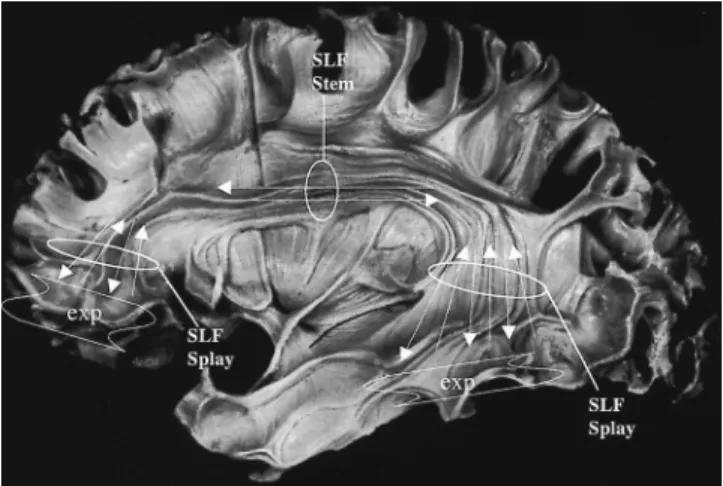
Conceptually, a white matter fiber pathway is a group of axons that originate from a set of neuronal bodies and end on one or more sets of target neurons. Morphologically, we can distinguish three different components in a fiber bundle—namely (a) a compact portion or ‘‘stem’’ or ‘‘stalk’’ (11), where the axons run together to form a fascicle; (b) a zone of divergence/convergence calledspray(12) orsplay, where the axons fan out; and (c) the distal, peripheralorigins andterminations, where the axons either originate or end. However, in current MRI research, the termextreme periph-eryseems more practical than the termsoriginand termina-tionfor a couple of reasons. First, DTI does not allowthe identification of this portion of a fiber pathway clearly enough to justify the application of such specific terminol-ogy. Second, both the corticocortical associational and the commissural connections are generally bidirectional, mean-ing that within the stem of a tract fibers are runnmean-ing in both directions; thus, origins and terminations pertaining to the same fiber tract occur in adjacent locations. The dif-ferentiation of these features is well beyond the current spa-tial resolution capabilities of DTI. Therefore, at a morpho-logic level, a comprehensive delineation of a fiber pathway should include its stem, splay, and extreme periphery. A description of the extreme periphery of an association fiber tract is related to a cortical field of origin or termination (Fig. 27.1).
Architectonic Connections
The detailed characterization of a fiber pathway in terms of its cytoarchitectonic correlates is a fundamental step for the understanding of cerebral structural and functional or-ganization. These issues have been addressed at the architec-tonic level in experimental animals and in human postmor-tem material. In particular, cerebral cytoarchitecture has been described precisely in both the human and the experi-mental animal, such as the macaque. In the experiexperi-mental nonhuman primate, the white matter fiber pathways have been delineated precisely and comprehensively (i.e., in terms
FIGURE 27.1. Morphologic description of a fiber pathway. In this lateral preparation of Ludwig and Klingler (53), the sample tract is the human superior longitudinal fasciculus, which is a long, associational, corticocortical connection. Its three compo-nents are (a) the stem, where axons run compactly and in a bidi-rectional fashion; (b) the splays or sprays, where the axons diverge or converge; and (c) the extreme peripheries, the cortical regions within which the axons originate or terminate.Arrowsdenote the bidirectionality of axons within the stem and the splays of the fiber tract as they run from origin to termination.
of their stems, splays, and origins and terminations). Al-though this is currently the case for the nonhuman primate, the status of research in human brain anatomic connectivity is very different.
Studies in Human Postmortem Material In human postmortem material, traditional techniques such as myelin stain, bichromate fixation, and gross anatomic dissection allowvisualization of the stems of these fiber bun-dles (10). With very fewexceptions, in which dyes such as the carbocyanine dye (DiI) were used for very short connec-tions (13), histologic description of human fiber pathways is incomplete because it does not provide a detailed under-standing of their origins and terminations, and no technique is available that can identify with certainty the origin and distal terminations of a fiber pathway satisfactorily in the human. The closest inferences at this level of description are obtained from white matter degeneration studies of brains with specific neurologic damage. Most of these stud-ies deal with cortico-subcortical connections and are not specific because the cortical lesions that cause the remote degeneration are very large (10,14).
Studies in the Experimental Nonhuman Primate
Experimental approaches with available techniques have ad-dressed the problem of origin and termination of fiber path-ways in the monkey. The injection of radioactively labeled
amino acids (15) into nonhuman primate brain with appro-priate histologic processing techniques permits the accurate and reliable interpretation of the origins, trajectories, and terminations of the subcomponents of the various fiber pathways of the CNS. With this technique, a number of studies of the fiber connections between the different lobes of the cerebral cortex, between the two hemispheres, and between the cerebral cortex and subcortical regions have been carried out in the monkey. These studies have demon-strated that the various fiber bundles are distinct and occupy unique trajectories from origin to termination.
Extrapolation from Animal Experimental Material to Human Material
In the monkey, it is known how different pathways correlate with radioactively labeled material, so that their origin and termination can be delineated. Because the stems of the major pathways are similar in the monkey and the human, one can extrapolate the origins and terminations of the ob-served pathways in the human to correlate specific fiber pathways with cortical architectonic fields. Drawing these inferences, we can formulate for each individual fiber bun-dle a specific map that characterizes the tract in terms of its connections.
Maps of Anatomic Connectivity
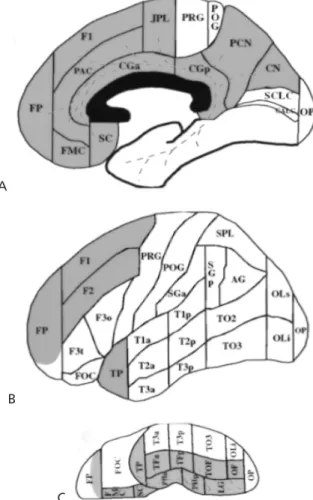
A map of anatomic connectivity (MAC) is aset of neuroana-tomic regions interconnected by a particular white matter fiber pathway,and we can symbolize it as PATHWAYMAC. For instance, the MAC for cingulum bundle (CB) would be CBMAC(Fig. 27.2). Whereas in the human we have precise knowledge only of the stem of this bundle, the architectonic connections in the nonhuman primate are well docu-mented. A comprehensive description of maps for anatomic cerebral connectivity has been formulated, derived from an-atomic studies in the human and by extrapolation from experimental material, and has been integrated in the con-text of a methodology for topographic characterization and quantification of human forebrain white matter (16,17). Because of their versatility, MACs could be relevant in the formulation of more sophisticated tractographic experi-ments and in interpreting neurofunctional data. Integrating the neuroanatomic knowledge of fiber tracts within an fMRI experiment is an additional challenge, but at the same time it seems to be key if we are to study behavior in normal and clinical conditions, which implies the study of fiber pathwaysin vivo.
In Vivo Analysis of Fiber Pathways
The capability of studying tracts in the living human brain opens up a newwindowin structural–functional and ana-tomic–clinical relationships. Currently, the detection of
A
B
C
FIGURE 27.2. Map of cortical anatomic connectivity (MAC) for the cingulum bundle (CB), or CBMAC. The connections of the CB
are represented in the mesial(A), lateral(B), and ventral(C)views of the human brain on a cortical parcellation system (46). The shaded areain blue within the frontal pole in the ventral view corresponds approximately to the rostral part of the frontoorbital cortexthat is anterior to the transverse orbital sulcus. AG, angular gyrus; CALC, intracalcarine cortex; CGa, cingulate gyrus, anterior; CGp, cingulate gyrus, posterior; CN, cuneiform cortex; CO, central operculum; F1, superior frontal gyrus; F2, middle frontal gyrus; F3o, inferior frontal gyrus, pars opercularis; F3t, inferior frontal gyrus, pars triangularis; FMC, frontal medial cortex; FO, frontal operculum; FOC, frontal orbital cortex; FP, frontal pole; H1, Heschl gyrus; INS, insula; JPL, juxtaparacentral cortex; LG, lingual gyrus; OP, occipital pole; OF, occipital fusiform gyrus; OLi, lateral occipi-tal cortex, inferior; OLs, lateral occipioccipi-tal cortex, superior; PAC, paracingulate cortex; PCN, precuneus; PHa, parahippocampal gyrus, anterior; PHp, parahippocampal gyrus, posterior; PO, pari-etal operculum; POG, postcentral gyrus; PP, planum polare; PRG, precentral gyrus; PT, planum temporale; SC, subcallosal cortex; SCLC, supracalcarine cortex; SGa, supramarginal gyrus, anterior; SGp, supramarginal gyrus, posterior; SPL, superior parietal lobule; T1a, superior temporal gyrus, anterior; T1p, superior temporal gyrus, posterior; T2a, middle temporal gyrus, anterior; T2p, mid-dle temporal gyrus, posterior; T3a, inferior temporal gyrus, ante-rior; T3p, inferior temporal gyrus, posteante-rior; TFa, temporal fusi-form, anterior; TFp, temporal fusifusi-form, posterior; TO2, middle temporal gyrus, temporooccipital; TO3, inferior temporal gyrus, temporooccipital; TOF, temporooccipital fusiform gyrus; TP, tem-poral pole. See color version of figure.
fiber tractsin vivo has been addressed by MRI techniques such as DTI. DTI analysis enables us to characterize a white matter fiber pathway in terms of its orientation, location, and size. To date, tractography has been performed in two different ways. Usingmanualormodel-independent methods, we can derive the trajectory of the fiber bundle and approxi-mate its extreme peripheries (12). Using mathematically driven model-based methods,we can also trace a fiber path-way (18–20). In the section on applications, we give exam-ples in which both methods are used and different tracts are visualized in two and three dimensions. Although the field of DTI-based brain tractography is expanding rapidly with impressive results, it has to be pointed out that certain basic conceptual obstacles still need to be overcome. For instance, in this stage, it has not been demonstrated that we are able to delineate completely and precisely a fiber tract in the brain by means of any DTI analysis technique. At the most, we can identify and characterize the stems of the major fiber tracts (12,21); however, the problem of elucidating the splays and extreme peripheries of the bun-dles remains to be solved reliably. Therefore, when we use the termpathway, tract,orbundle,we currently refer to its stem.
OVERVIEW OF DIFFUSION TENSOR IMAGING
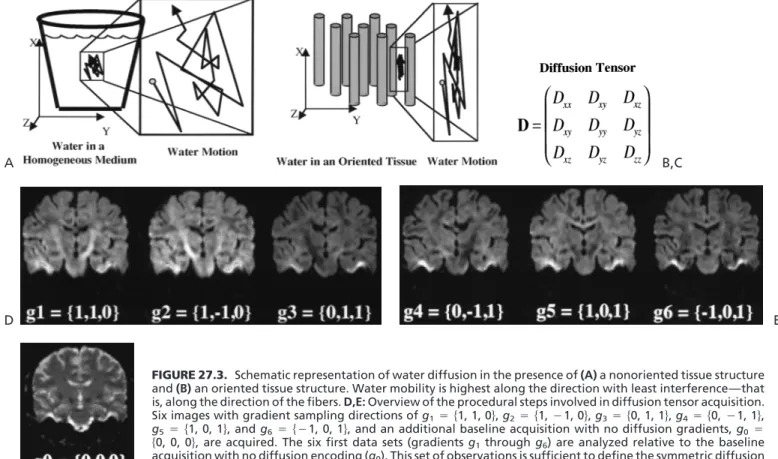
Self-diffusion of molecules has been studied with magnetic resonance methodologies for several decades (22,23). For comprehensive reviews of the use of diffusion in nuclear magnetic resonance, we refer the reader to other sources (24–26). With respect to the physical principles underlying diffusion (also known asbrownian motion), water in tissues with an oriented structure tends to diffuse morealong the orientation of the tissue structure (Fig. 27.3). The incoher-ent motion of the diffusing water, when it occurs in the presence of a magnetic field gradient, leads to dephasing of the MR signal. This dephasing produces signal attenuation (SA), which is related to the magnitude of diffusivity of the water along the direction and magnitude of the applied gradient in an exponential fashion. For anisotropic gaussian diffusion, the SA is proportionate to e␥2␦2(⌬␦
3)gTDg. For isotropic diffusion, this reduces to the Stejskal–Tanner rela-tion: SASA0ebD, whereDis the diffusion coefficient and b is the diffusion sensitivity factor. Note that b
␥2g2␦2(⌬␦/3), where the values ofg,␦,and⌬correspond to the values of the gradient amplitude, duration, and spac-ing, respectively, and␥is the hydrogen gyromagnetic ratio (27). The diffusion process can be parameterized by a 3 3 symmetric tensor, which can be represented by an ellips-oid, as shown in Fig. 27.3.
B,C A
E D
FIGURE 27.3. Schematic representation of water diffusion in the presence of(A)a nonoriented tissue structure and(B)an oriented tissue structure. Water mobility is highest along the direction with least interference—that is, along the direction of the fibers.D,E:Overview of the procedural steps involved in diffusion tensor acquisition. Siximages with gradient sampling directions ofg1兵1, 1, 0其,g2兵1,1, 0其,g3兵0, 1, 1其,g4兵0,1, 1其,
g5兵1, 0, 1其, andg6兵1, 0, 1其, and an additional baseline acquisition with no diffusion gradients,g0
兵0, 0, 0其, are acquired. The sixfirst data sets (gradientsg1throughg6) are analyzed relative to the baseline
acquisition with no diffusion encoding (g0). This set of observations is sufficient to define the symmetric diffusion
tensor representation of water self-diffusion, shown in(C). F
HOW DO WE ‘‘BUILD’’ A DIFFUSION IMAGE?
The acquisition of the DTI requires the acquisition of six directionally weighted samples of the effect of the diffusion process relative to the axes of the imaging system. Specifi-cally, the magnitude of the diffusion attenuation in MR signal along the x, y,and z axes themselves, as well as in thexy,xz, andyzdirections, must be measured. The attenu-ation of MR signal in the presence of gradients in each of these directions is calculated relative to an image acquired with no diffusion encoding (baseline). Hence, seven (six directions, one baseline) acquisitions for each slice level are required. Once the tensor is sampled, the magnitude calcu-lated from the trace expresses thetotal (no directionality) diffusivity at each voxel location (Fig. 27.4).
The directionality of diffusion is assessed by an eigen decomposition of the diffusion tensor. The largest eigen-value corresponds to the major axis of the diffusion ellipsoid and so represents the major directionality of diffusion at that location.
Color Coding
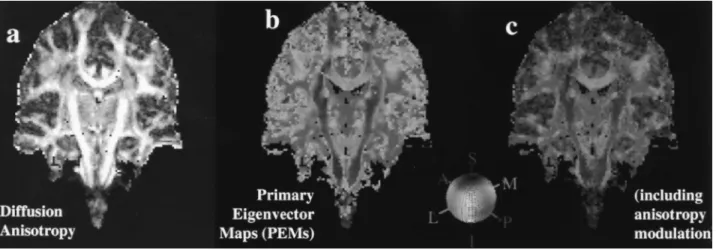
A color is assigned for each voxel location by using the primary eigenvector (corresponding to the largest
eigen-value) of the diffusion tensor. At each voxel, the absolute values of the x, y,and z components are used as the red, green, and blue color values, respectively, such that a red voxel in the image means the vector points left–right (or right–left), green means anteroposteriorly (or posteroanteri-orly), and blue represents superoinferiorly (or inferosuperi-orly). For instance, if a vector points mostly in the red direc-tion, then the xvalue of the vector will be large and the color will be pure red; otherwise, the color will be a mixture of red, green, and blue, depending on the magnitudes of the vector components (i.e., on the direction of the vector). In Fig. 27.4, this color coding scheme is shown with the appropriate color painted onto a sphere, and the principal eigenvector map (PEM) is the result of color-coding a tensor image (Fig. 27.4).
Modulation by Anisotropy
To further distinguish white matter fiber pathways from other regions, the color is modulated by a measure of aniso-tropy of the voxel. This emphasizes the stems (i.e., the com-pact portions of the fiber tracts) by diminishing the bright-ness of everything else. Here,anisotropycan be either lattice (21,28,29) or fractional (30) anisotropy. Figure 27.4C shows the effect of anisotropy modulation.
FIGURE 27.4. The tensor representation can be visualized in many ways.A:Diffusion anisotropy, defined as the relative magnitude of the major axis of the diffusion ellipsoid in comparison with the minor axes, can be visualized; in this figure, regions of high anisotropy are bright, yielding an observable substructure within the cerebral white matter.B:A primary eigenvector map (PEM) can be generated to observe the orientation of the major axis of the diffusion ellipse in three-dimensional space; red indicates medial–lateral, blue indicates superior–inferior, and green indi-cates anterior–posterior orientation, respectively.C:The PEM can include anisotropy modulation if the intensity of the color is made proportional to the degree of anisotropy present in each voxel. Regions of high anisotropy can be colored with intense color, whereas regions of low anisotropy have a pale coloring, so that the underlying anatomic image can be viewed. See color version of figure.
‘‘ZORRO’’
In the section on applications, we illustrate tractographic representations of different pathways that have been created with use of a novel tool for DTI data analysis. This tool, which we call zorro(for its capability to create masks), is described here.
Zorro is a program for visualization and quantitative measurement of diffusion-weighted MR tensor scans. It was written with the ‘‘visualization toolkit’’ (31). Its main pur-pose is to create ‘‘masks’’ interactively that designate regions of voxels in the three-dimensional (3D) data. The masks are then used to make 3D visualizations and quantitative measurements, such as volume, anisotropy, and direction. The program loads both tensor files and their registered nonattenuated baseline echo-planar imaging (T2-EPI) files. Anisotropy values are calculated from the tensor data (e.g., fractional, lattice), or they are loaded if they were previously calculated. A rough segmentation into brain, background (air), and cerebrospinal fluid is performed with use of the T2-EP image, and this facilitates visualization of the data by providing an anatomic context. Zorro can display all three colorized diffusion eigenvectors, anisotropy images, the T2-EP image, the segmented image, and all mask im-ages. A mouse click prints all numeric data for a given voxel (the full tensor, anisotropy values, and mask values). The brightness and contrast can be adjusted for both color (vec-tor) and grayscale (scaler) images, and there are options to showand hide the background and cerebrospinal fluid in
the color images and to enable and disable the anisotropy modulation of colors. Any number of different voxel ‘‘masks’’ can be created by clicking on particular voxels. One click adds the voxel to the mask being edited, and another turns it off. Once chosen, various statistics may be calculated from any value associated with every voxel in the mask. Different masks may be combined in binary opera-tions (and, or, xor).
Masks may be semiautomatically created by using ‘‘re-gion growing.’’ For this, a mouse click starts the re‘‘re-gion at a ‘‘seed’’ voxel, and then each of the seed’s neighbors in 3D is added to the region if the neighbor is similar enough to the seed voxel. A voxel is ‘‘similar enough’’ if, for instance, its anisotropy and primary diffusion direction differ from the seed’s by less than some given threshold. Once a neigh-bor is included, it becomes a seed, and its neighneigh-bors are checked to see if they should be included in the result. In zorro, the three kinds of region growing are direction of interest, change in angle,andflow.For all types, one can also specify an anisotropy threshold, so that if the anisotropy of the neighbor is belowthis threshold, it will not be included in the result. Region growing can also be 2D instead of 3D and can be prevented in cerebrospinal fluid regions or the background region.
Flow Region Growing
Flowregion growing involves three vectors: the seed voxel’s primary diffusion vector, the neighbor’s primary diffusion
vector, and the displacement vector (a vector from the seed voxel location to the neighbor voxel location). A neighbor voxel is included if the displacement vector matches both the seed and neighbor voxels’ primary diffusion vectors. This match is determined by comparing a threshold to the product of the dot products of the displacement vector with the seed and the neighbor’s primary diffusion vectors. This means that both primary diffusion vectors are pointing in a direction similar to that of the displacement vector.
Change-in-Angle Region Growing
Here, a neighbor is included in the mask if its direction is close enough to the seed direction. This match is deter-mined by comparing a threshold to the acrcosine of the dot product of the seed’s and neighbor’s primary diffusion vectors. As the region grows, the angle is defined by the newseeds.
Direction of Interest
Here, an absolute direction is specified and each neighbor is included if its direction is close enough to a user-specified direction of interest. This match is determined by compar-ing a threshold to the acrcosine of the dot product of the user-specified direction of interest and the neighbor’s pri-mary diffusion vector. Again, growing can be limited in each of these region-growing methods by providing a threshold for anisotropy and by choosing not to growout of the 2D slice or into the background or cerebrospinal fluid.
The problem with region growing is that noisy data may cause the region to ‘‘escape’’ and growout of a region where it might be expected to remain. Besides allowing the interac-tive examination of tensor and anisotropy data, zorro also produces three kinds of output: mask statistics, angular his-tograms, and 3D visualization with the use of ‘‘boxels.’’
Mask Statistics
After all voxels in a mask have been chosen by manual edit-ing, region growedit-ing, or a combination thereof, zorro prints the average and variance of fractional and lattice anisotropies taken over all voxels in the given mask.
Angular Histogram
The primary diffusion direction (an angle in 3D) can be represented by two angles (q1, q2). An angular histogram then can be presented as a 2D image in which each pixel is a bin of the histogram and the brightness of a pixel repre-sents the height of that bin. The size of the image reprerepre-sents the number of bins chosen to characterize each angle, n.
Angles are calculated and then scaled to a range ofn/2. For a given primary diffusion vector (x,y,z):
q1atan(z/x) /n/2 q2atan(y/h) / p/2 where hsqrt(z2x2).
To create the histogram, for each voxel of the mask, the bin (pixel location) indicated by these two scaled angles for the primary diffusion vector is incremented.
3D Visualization by ‘‘Boxels’’
‘‘Boxels’’ are a method for visualizing DTI data in which all tensor information can be seen at the same time. Along with color coding and modulation by anisotropy, boxes are drawn to indicate the directions and relative lengths of all three vectors. The orientation and lengths of the three paral-lel faces are proportional to the eigenvectors and eigenval-ues, respectively.
APPLICATIONS AND DISCUSSION
Diffusion tensor imaging tractography has opened up the capability to study white matter fiber pathways in the living brain in clinical conditions and in normality, and can be integrated within more general structural–functional, clini-cal, and behavioral paradigms. However, basic problems re-main to be elucidated. At an anatomic level, fiber tracts can be delineated precisely only at the level of their stems, not at their splays and extreme peripheries. This is a challenging problem that should be solved if DTI is to enable us to delineate tracts in their entirety. At a signal analysis level, a fundamental question relates to the source of the DTI signal. For instance, the relative contributions of the intra-cellular and extraintra-cellular compartments to the diffusion sig-nal are not known with certainty (32–35). One powerful approach to the solution of this problem is study at the ultrastructural level.
Ultrastructural Studies
To acquire a better understanding ofin vivodiffusion MR measurements in the nervous system, we investigated the diffusion of water in excised sciatic nerve of mice. Fixed and freshly excised nerves were placed straight in a tube and immersed in Fluorinert (Sigma, St. Louis, Missouri). The sample was positioned in a solenoid with its axis coinciding with the nerve axis and perpendicular to B0. Also, it was possible to exploit the particular geometry of the sample to align the nerve axis with one of the field gradients (in these experiments, thegygradient, or 0, 1, 0). The diffusion MRI experiments were performed at 2.0 tesla (T) (proton
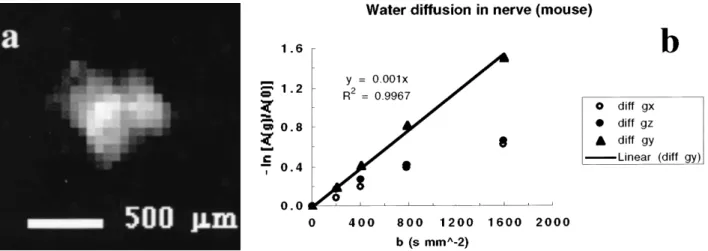
fre-FIGURE 27.5. A:Transaxial proton image of the sciatic nerve of a mouse.B:Graph illustrating the variation of the magnetic resonance signal as a function of the orientation of the diffusion gradient. Thecircles(open and closed) correspond to measurements with the diffusion gradients applied in the plane perpendicular to the nerve axis. Thetrianglescorrespond to diffusion mea-surements obtained by using the gradient parallel to the nerve axis. The anisotropy of the restric-tion to the diffusion of water molecules in the cellular compartments is clearly shown.
quency of 84.74 MHz) on a SISCO (Varian Associates, Palo Alto, California) system equipped with an 18-cm horizontal-bore superconducting magnet (Nalorac, Martinez, California) and a set of coils capable of producing 120-mT/m field gradients. Proton MR diffusion-weighted images were obtained by using a spin-echo sequence with an echo time of 50 ms and a repetition time of 1 s. The measurements were performed at room temperature (21⬚C). Typically, 12 scans were averaged. Theb values used for diffusion weighting were 0, 200, 400, 800 and 1,600 s• mm2. The slice thickness was 2 mm, and the field of view was 7.57.5 mm2with an in-plane resolution of 256 128 pixels. Figure 27.5A shows a transaxial proton image of a nerve obtained with abvalue of 0.
The effect of restriction to molecular diffusion within the nerve is shown in Fig. 27.5B. Diffusion gradients ap-plied along directionsgx(1,0,0) andgz(0,0,1), which were perpendicular to the nerve axisgy(0,1,0) in these experiments, showthat the presence of more barriers (i.e., cell membranes and cytoplasmic fibers) hinder molecular diffusion across rather than along the nerve.
Macroscopic Studies
In a sense, the cerebral white matter can be considered as a finite set of discrete and topographically organized fiber pathways or connections that convey connectivity within the brain, and the physical connections in their entirety would make upanatomic connectivity.On the other hand, the physiologic outcome of activities of neuronal assemblies, which is coherent in nature and is expressed in the correlated time structure of the firing pattern of its member neurons, would be the basis offunctional connectivity(i.e., the tem-poral correlation between remote neurophysiologic events)
(36). In the context of a functional experiment, functional connectivity would allow us an array of possible interpreta-tions. The simplest of these solutions that can replicate the observed functional connectivity describes the interactions and connections that are sufficiently active to be detectable at the time of observation. This simplest solution is the effective connectivity,which accounts for the interaction that one neural system exerts on another (37).
In vivoDTI-based fiber tract analysis is relevant for the study of structural–functional and anatomic–clinical rela-tionships. The details of systems neuroanatomy are critical for studies of lesion analysis and for the analysis and inter-pretation of metabolic and functional neuroimaging data. Damage to specific fiber pathways correlates with the de-creased cerebral metabolism pattern observed in stroke pa-tients. Functional activation studies in which PET and fMRI are used contribute to the knowledge of the spatial distribution of cortical and subcortical processing elements. In the creation of effective connectivity models, actual knowledge of brain anatomy is an integrative part because it is utilized for the design of the a priori model used in structural equation modeling (38–41). Use of actual indi-vidual information regarding in vivo white matter fiber pathway topography and volumetry may optimize and in-crease the predictive power of these models. These anatomic and neuroimaging studies of the constituents of the fiber tracts and the connections of the human cerebral cortex will be important in acquiring an understanding of the distrib-uted neural circuits that subserve normal brain function. They will also pave the way for future morphometric studies of the white matter fiber systems in normal populations, and for lesion–deficit correlations in patients with focal brain lesions.
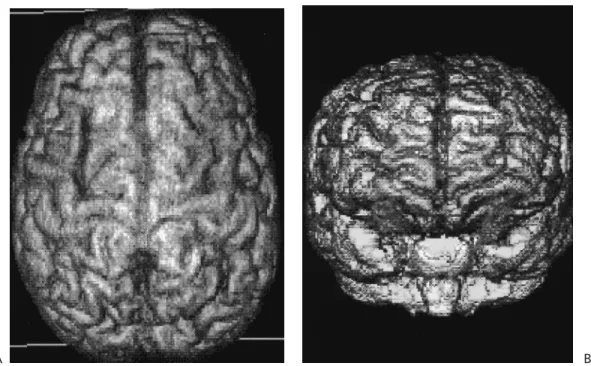
The significance of this method is underscored in the study of normal white matter neuroanatomy and also of severaldiseases that affect the cerebral white matter,such as stroke, head trauma, spinal cord injury, and neurodegenera-tive diseases. Applications of the DTI technique in white matter pathway analysis in normal persons and in cases of amyotrophic lateral sclerosis are illustrated. Three normal tracts—the corticospinal projection, the corpus callosum, and the cingulum fiber system—have been selected for the illustration because of their different orientations and also because they represent distinctive classes of connection (i.e., projectional, commissural, and associational, respectively). We have used ‘‘zorro’’ in these examples to showthe various ways in which tractography can be performed. Specifically, the corpus callosum and the corticospinal tracts were hand-picked, whereas the cingulum fiber system was recon-structed automatically in three dimensions. The results are shown in Figs. 27.6 and 27.7.
Amyotrophic Lateral Sclerosis
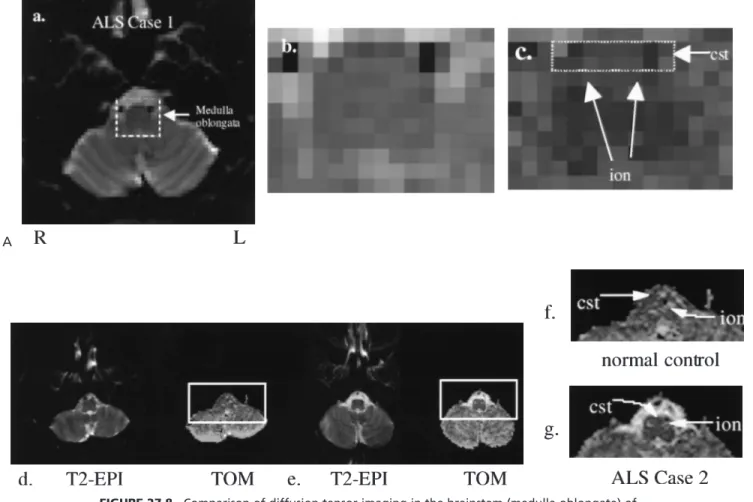
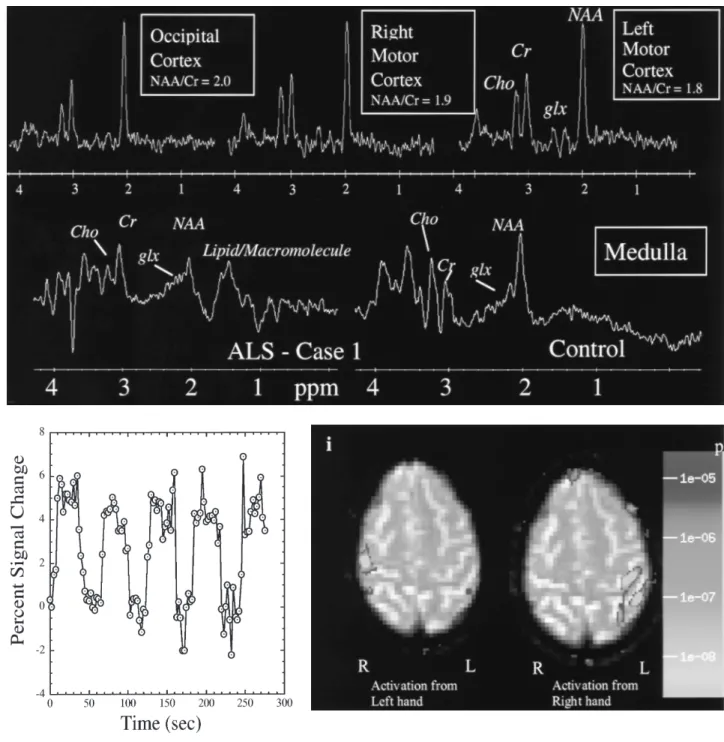
In amyotrophic lateral sclerosis (ALS), as degeneration of the upper motor neuron occurs, a progressive damage to the corticospinal tract has been documented in the caudorostral direction (42–45). We used DTI in two patients (cases 1 and 2) to document pronounced bilateral reduction in the size of the corticospinal tract at the level of the medulla oblongata. Case 1 illustrates an integrated MRI examination of structure, function, and metabolism. A change in mor-phology of the corticospinal tract can be appreciated in con-ventional MR images or in the T2-EP images at its ventral surface shown in Fig. 27.8 A,D. However, these MRI tech-niques do not allowan accurate definition of the borders of the tract. With the aid of tractographic DTI, the cortico-spinal tract is readily visualized as it courses rostrocaudally. In addition, bordering structures can be visualized, such as the inferior olivary nucleus; thus, a more precise definition of the caudal borders of the corticospinal tract allows quanti-fication of the fiber pathway at this anatomic level. Frac-tional and lattice anisotropy indices were measured in a 13-voxel region (voxel size 2 2 2 mm3) for the corticospinal tract in the medulla, as shown in Fig. 27.8C. The average fractional anisotropy index was .49.02, and the lattice anisotropy index was .30.01. In this case, in addition to DTI, we collected single-voxel MRS measure-ments in medulla, and the data indicated metabolic changes—loss of NAA (Nacetylaspartate) and possibly elevated glutamate/glutamine (glx), shown in Fig. 27.8H. Similarly, we acquired MRS measurements in the right and left primary motor cortex, shown in Fig. 27.8H. Of note is that the observed metabolic pattern showed a slightly decreased NAA/Cr (creatine) ratio in the left motor cortex in comparison with the contralateral counterpart. Finally, fMRI was acquired while flexion was performed (frequency of 1.5 Hz) with either the left or right hand. An expanded
area of activation was observed in the left hemisphere that corresponded with this patient’s motor symptomatology (i.e., right-hand weakness much greater than left-hand weakness) (Fig. 27.8I).
Integrated Magnetic Resonance Neurologic Examination
Diffusion tensor imaging can be an important part of a comprehensive neurofunctional MRI examination. Quanti-tative assessment of anatomic volume as measured by mor-phometric MRI (46), of fiber pathway anisotropy and size by DTI, of metabolic state by MRS, and of functional state by fMRI provides a highly multidimensional data space for the elucidation of structural, functional, behavioral, and clinical correlates. For instance, the relative contributions of each of these imaging modalities can be assessed for any developmental, aging, or degenerative process with the use of principal component analysis. This leads to an optimized, temporally efficient MRI neurologic examination that cap-tures the salient feacap-tures of the structural, metabolic, and functional states as they change over time. Monitoring these manifestations enables us to elucidate the neurobiological underpinnings of normal brain development and aging in addition to the endpoints of etiology, natural history, and therapeutic intervention in disease states (47). The ALS case 1 is an example of this application. We have proposed using this technique to assess the changes in both motor cortical ‘‘remapping’’ and recruitment of additional cortical areas that may occur progressively in ALS. We successfully per-formed fMRI in this same patient (Fig. 27.8A), in addition to MRS and DTI. The data indicated larger areas of activa-tion in the left than in the right hemisphere and reflected the motor asymmetry of this patient. The pattern of activa-tion in the right hemisphere was essentially normal, whereas that in the left hemisphere showed recruitment of posterior parietal and association areas. This pattern of ‘‘expansion’’ of cortical activation has also been observed in other neuro-degenerative conditions, such as Parkinson disease (48,49) and stroke (50–52).
CONCLUSION
An understanding of the human cerebral white matter, spe-cifically its fiber pathways, is needed. Historically, this ob-jective was achieved to a certain extent in postmortem mate-rial, and the findings were therefore of limited practical value. The advancement of neuroimaging technology with such techniques as DTI has made it possible to study human white matter fiber pathwaysin vivo,and therefore in clinical conditions. The DTI method opens up a newapproach, tractography, for studying the various white matter fiber pathways that are particularly involved in normal cognitive
A B FIGURE 27.7. Three-dimensional (3D) reconstruction of fiber tracts within the three-dimen-sionally rendered brain of a normal young adult.A:A combined 3D representation of the cingulum bundle (green) and the corpus callosum (red).B:A composite 3D rendition of the corticospinal projection (blue) and the corpus callosum (red). Red indicates medial–lateral, blue superior–infe-rior, and green anterior–posterior orientation, respectively. See color version of figure.
processing and in certain disease states, such as language, developmental, psychiatric, and demyelinating disorders. In addition, this imaging technique may allow a better under-standing of the state of white matter pathways during devel-opment, aging, and recovery following brain damage.
Fi-䉳
FIGURE 27.6. Three-dimensional reconstruction of stems of individual pathways of a living nor-mal young adult human subject. Note that scaling of tracts is unequal. Red indicates medial–lat-eral, blue indicates superior–inferior, and green indicates anterior–posterior orientation, respec-tively, as shown in the color-coded sphere in the center of the figure. For this caption, three representative fiber tracts were selected based on class of pathway provenience and orientation. The corpus callosum, a commissural tract with general mediolateral orientation, is shown in supe-rior and lateral views. Specifically, its genu, body, and splenium are colored in red because they run mediolaterally, whereas its anterior (forceps minor) and posterior (forceps major) forcipes are colored in green because they are oriented anteroposteriorly. The corticospinal tract, a projec-tional pathway with superior–inferior orientation, is depicted in blue in a frontal view. Finally, the cingulum bundle, a long, associational corticocortical fiber tract with anterior–posterior orien-tation, is colored green above the body of the corpus callosum for its major trajectory, whereas it is colored blue along its vertically oriented portions in front of the genu and behind the splenium of the corpus callosum. See color version of figure.
nally, the integration of DTI in a more comprehensive MR neurologic examination would allow us to monitor the evo-lution of a pathologic condition and thus elucidate the end-points of etiology, natural history, and therapeutic interven-tion in disease states.
A
C
B D
FIGURE 27.8. Comparison of diffusion tensor imaging in the brainstem (medulla oblongata) of a normal control(D,F)and two patients with amyotrophic lateral sclerosis, ALS case 1(A–C)and ALS case 2(E,G). A T2 echo-planar image (T2-EPI) and tensor orientation map (TOM) are included at each level. In this image, green voxels indicate anteroposteriorly, red indicate mediolaterally, and blue indicate superoinferiorly oriented diffusion directions.H:Four magnetic resonance spec-tra from an ALS patient (case 1). The specspec-tra in the top row come from a point resolved spectros-copy sequence (PRESS) with TR (repetition time)/TE (echo time) 2,000/144 ms in either left motor cortex (hand area), right motor cortex (hand area), or occipital cortex. The occipital cortex serves as a control region that is essentially unaffected by ALS. A slight asymmetry in the NAA/Cr and glx/Cr values between left and right motor cortex perhaps reflects the large motor asymmetry in this patient. Also shown on the bottom are PRESS spectra from medulla in the same patient and from a normal control (TR/TE 2,000/30 ms). Note the lower NAA/Cr values in the patient and the higher intensity in the glx region.I:This figure shows activation in the hand motor cortex after performance of hand flexion (frequency of 1.5 Hz) with either the left or right hand. Note the expanded area of activation in the left brain, which correlates with the asymmetry of symptoms. The left hand is essentially normal, whereas the right hand is much more severely affected. No difference was noted in frequency of performance of the task with the left or right hand. Also shown is a time course from a region of interest in left motor cortex showing the response of the BOLD (blood oxygenation-dependent) signal to the off and on periods. AG, angular gyrus; CALC, intracalcarine cortex; CGa, cingulate gyrus, anterior; CGp, cingulate gyrus, posterior; CN, cuneiform cortex; CO, central operculum; F1, superior frontal gyrus; F2, middle frontal gyrus; F3o, inferior frontal gyrus, pars opercularis; F3t, inferior frontal gyrus, pars triangularis; FMC, frontal medial cortex; FO, frontal operculum; FOC, frontal orbital cortex; FP, frontal pole; H1, Heschl gyrus; INS, insula; JPL, juxtaparacentral cortex; LG, lingual gyrus; OP, occipital pole; OF, occipital fusiform gyrus; OLi, lateral occipital cortex, inferior; OLs, lateral occipital cortex, superior; PAC, paracingulate cortex; PCN, precuneus; PHa, parahippocampal gyrus, anterior; PHp, parahippocam-pal gyrus, posterior; PO, parietal operculum; POG, postcentral gyrus; PP, planum polare; PRG, precentral gyrus; PT, planum temporale; SC, subcallosal cortex; SCLC, supracalcarine cortex; SGa, supramarginal gyrus, anterior; SGp, supramarginal gyrus, posterior; SPL, superior parietal lobule; T1a, superior temporal gyrus, anterior; T1p, superior temporal gyrus, posterior; T2a, middle tem-poral gyrus, anterior; T2p, middle temtem-poral gyrus, posterior; T3a, inferior temtem-poral gyrus, anterior; T3p, inferior temporal gyrus, posterior; TFa, temporal fusiform, anterior; TFp, temporal fusiform, posterior; TO2, middle temporal gyrus, temporooccipital; TO3, inferior temporal gyrus, tempo-rooccipital; TOF, temporooccipital fusiform gyrus; TP, temporal pole (46).(Figure continues.)
E
F
FIGURE 27.8. Continued.
ACKNOWLEDGMENTS
We thank the following persons for assistance in these projects: D. N. Pandya, E. Kaplan, J. P. Vonsattel, T. G. Reese, E. Kraft, D. N. Caplan, and R. H. Brown, Jr. This work was supported in part by grants from the National Institutes of Health (NS27950, DA09467, and NS34189 as part of the Human Brain Project), and from the National Alliance for Research on Schizophrenia and Depression
(NARSAD), the Fairway Trust, the Giovanna Armenise-Harvard Foundation for Advanced Scientific Research, and the Amyotrophic Lateral Sclerosis Association (ALSA).
Dr. Sorensen receives research support from, is a consult-ant for, or has spoken on behalf of the following companies within the last year: Siemens Medical Systems, General Electric Medical Systems, Neurocrine Biosciences Inc., Ma-trixPharmaceuticals Inc., Millennium Pharmaceuticals Inc., VertexPharmaceuticals Inc., and BerlexLaboratories.
In addition, Dr. Sorensen has an equity position in and holds the position of Medical Director at EPIX Medical Inc., a specialty pharmaceutical company based in Cam-bridge, Massachusetts, engaged in developing targeted con-trast agents for cardiovascular MRI.
REFERENCES
1. Pandya DN, Yeterian E. Architecture and connections of cortical association areas. In: Peters, Jones EG, eds.Cerebral cortex.New York: Plenum Publishing, 1985.
2. Mountcastle VB. The mindful brain: part I. Cambridge, MA: MIT Press, 1978.
3. Shepherd GM. Neurobiology. New York: Oxford University Press, 1994.
4. Cajal SR.Histology of the nervous system of man andvertebrates. New York: Oxford University Press, 1995.
5. Pandya DN, Kuypers HGJM. Cortico-cortical connections in the rhesus monkey.Brain Res1969;13:13–36.
6. Jones EG, Powell TPS. An anatomical study of converging sen-sory pathways within the cerebral cortexof the monkey.Brain 1970;93:793–820.
7. Sperry RW. Cerebral organization and behavior.Science1961; 133:1749–1757.
8. Geschwind N. Disconnexion syndromes in animals and man. Brain1965;88:584–644.
9. Mesulam M-M.Principles of behavioral neurology.Philadelphia: FA Davis Co, 1985.
10. Dejerine J.Anatomie des centres nerveux.Paris: Rueff et Cie, 1895. 11. Krieg WJS.Connections of the cerebral cortex. Chicago: Brain
Books, 1963.
12. Makris N, Worth AJ, Sorensen AG, et al. Morphometry ofin vivohuman white matter association pathways with diffusion-weighted magnetic resonance imaging. Ann Neurol 1997;42: 951–962.
13. Friedman DI, Johnson JK, Chorsky RL, et al. Labelling of human retinohypothalamic tract with the carbocyanine dye, DiI.Brain Res1991;560:297–302.
14. Clarke S, Miklossy J. Occipital cortexin man: organization of callosal connections, related myelo- and cytoarchitecture, and putative boundaries of functional visual areas. J Comp Neurol 1990;298:188–214.
15. Cowan WM, Gottlieb DI, Hendrickson AE, et al. The autoradio-graphic demonstration of axonal connections in the central ner-vous system.Brain Res1972;37:21–51.
16. Makris N, Meyer J, Bates J, et al. MRI-based topographic par-cellation of cerebral central white matter and nuclei: II. Rationale and applications with systematics of cerebral connectivity. Neu-roimage1999;9:18–45.
17. Meyer J, Makris N, Bates J, et al. MRI-based topographic par-cellation of the human cerebral white matter: I. Technical foun-dations.Neuroimage1999;9:1–17.
18. Mori S, Crain B, Chacko VP, et al. Three-dimensional tracking of axonal projections in the brain by magnetic resonance imaging. Ann Neurol1999;45:265–269.
19. Conturo TE, Lori NF, Cull TS, et al. Tracking neuronal fiber pathways in the living human brain.Proc Natl AcadSci U S A 1999;96:10422–10427.
20. Wedeen VJ, Davis TL, Lautrup BE, et al. Diffusion anisotropy and white matter tracts. Proceedings of the second international conference on functional mapping of the human brain 1996;3: S146.
21. Pierpaoli CJ, Basser PJ, Barnett A, et al. Diffusion tensor MR imaging of the human brain.Radiology1996;201: 637–648. 22. Hahn E. Spin echoes.Phys Rev1950;80:580–594.
23. Carr HY, Purcell EM. Effects of diffusion on free precession in nuclear magnetic resonance experiments.Phys Rev1954;94: 630–638.
24. Le Bihan D, Breton E, Lallemand D, et al. MR imaging of intravoxel incoherent motions: applications to diffusion and per-fusion in neurologic disorders.Radiology1986;161:401–407. 25. Filley CM. The behavioral neurology of cerebral white matter.
Neurology1998;50:1535–1540.
26. Rye DB. Tracking neural pathways with MRI.Trends Neurosci 1999;22:373–374.
27. Stejskal EO, Tanner JE. Spin diffusion measurements: spin echoes in the presence of a time-dependent field gradient.J Chem Phys1965;42: 288–292.
28. Pierpaoli C, Basser PJ. Toward a quantitative assessment of diffu-sion anisotropy.Magn Reson Med1996;36:893–906.
29. Pierpaoli C, Basser PJ. Toward a quantitative assessment of diffu-sion anisotropy [Erratum].Magn Reson Med1996;37:972. 30. Basser PJ, Pierpaoli C. Microstructural and physiological features
of tissues elucidated by quantitative-diffusion-tensor MRI. J Magn Reson B1996;111:209–219.
31. Schroeder W, Martin K, Lorensen B.The visualization toolkit. Upper Saddle River, NJ: Prentice Hall, 1998.
32. Nicholson C, Sykove E. Extracellular space structure revealed by diffusion analysis.Trends Neurosci1998;21:207–215.
33. Beaullieu C, Fenrich F, Allen PS. Multicomponent water proton transverse relaxation and T2-discriminated water diffusion in my-elinated and nonmymy-elinated nerve.Magn Reson Imaging1998; 16:1201–1210.
34. Norris DG, Niendorf T. Interpretation of DW-NMR data: de-pendence on experimental conditions.Nucl Magn Reson Biomed 1995;8:280–288.
35. Peled SH, Gudbjartsson H, Westin C-F, et al. Magnetic reso-nance imaging shows orientation and asymmetry of white matter fiber tracts.Brain Res1998;780:27–33.
36. Aertsen A, H. Preissl H. Dynamics of activity and connectivity in physiological neuronal networks. In: Schuster, ed.Nonlinear dynamics and neuronal networks. New York: VCH Publishers, 1991.
37. Friston K. Functional and effective connectivity in neuroimaging: a synthesis.Hum Brain Mapping1994;2:56–78.
38. McIntosh AR, Gonzalez-Lima F. Structural equation modelling and its application to network analysis in functional brain imag-ing.Hum Brain Mapping1994;2:2–23.
39. Gonzalez-Lima F, McIntosh AR. Neural network interactions related to auditory learning analyzed with structural equation modelling.Hum Brain Mapping1994;2:23–44.
40. Horwitz B, Tagamets M-A, McIntosh AR. Neural modeling, functional brain imaging, and cognition.Trends Cogn Sci1999; 3:91–98.
41. Buchel C, Coull JT, Friston KJ. The predictive value of changes in effective connectivity for human learning.Science1999;283: 1538–1541.
42. Colmant H-J. Die myatrophische Lateralsklerose.Handbuch der speziellen pathologischen Anatomie undHistologie 1958;XIII/2 Bandteil B:2624–2692.
43. Rowland L. Natural history and clinical features of amyotrophic lateral sclerosis and related motor neuron diseases. In: Calne, ed. Neurodegenerative diseases.Philadelphia: WB Saunders, 1994. 44. Martin J, Swash M, Schwartz M. New insights in motor neuron
disease.Neuropathol Appl Neurobiol1990;16:97–110.
45. Brown R. Amyotrophic lateral sclerosis. Arch Neurol1997;54: 1246–1250.
of human neocortex: an anatomically specified method with esti-mate of reliability.J Cogn Neurosci1996;8:566–588.
47. Jenkins BG. An integrated strategy for evaluation of metabolic and oxidative defects in neurodegenerative illness using magnetic resonance techniques.Ann N Y AcadSci1999;893:214–242. 48. Brooks D. The role of the basal ganglia in motor control:
contri-butions from PET.J NeurolSci 1995;128:1–13.
49. Brooks DJ. Motor disturbance and brain functional imaging in Parkinson’s disease.Eur Neurol1997;38[Suppl 2]:26–32. 50. Cramer SC, Nelles G, Benson RR, et al. A functional MRI study
Neuropsychopharmacology: The Fifth Generation of Progress.Edited by Kenneth L. Davis, Dennis Charney, Joseph T. Coyle, and Charles Nemeroff. American College of Neuropsychopharmacology䉷2002.
of subjects recovered from hemiparetic stroke.Stroke1997;28: 2518–2527.
51. Rossini PM, Caltagirone C, Castriota-Scanderbeg A, et al. Hand motor cortical area reorganization in stroke: a study with fMRI, MEG and TCS maps.Neuroreport1998;9:2141–2146. 52. Thulborn KR, Carpenter PA, Just MA. Plasticity of
language-related brain function during recovery from stroke.Stroke1999; 30:749–754.
53. Ludwig E, Klingler J.Atlas cerebri humani.Boston: Little, Brown and Company, 1956.