Livestock Gross Margin Insurance for Dairy Cattle: An Analysis of
Program Performance and Cost under Alternative Policy
Configurations
Victor E. Cabrera
Assistant Professor and
Extension Specialist in Dairy Management Department of Dairy Science University of Wisconsin Madison
Brian W. Gould
Associate Professor
Department of Agricultural & Applied Economics University of Wisconsin Madison
Mayuri Valvekar
Graduate Research Assistant Department of Dairy Science University of Wisconsin Madison
Selected Paper prepared for presentation at the Agricultural & Applied Economics Association 2009 AAEA & ACCI Joint Annual Meeting, Milwaukee, Wisconsin, July 26-29, 2009
Copyright 2009 by V.E. Cabrera, B.W.Gould and M.Valvekar. All rights reserved. Readers may make verbatim copies of this document for non-commercial purposes by any means, provided that this copyright notice appears on all such copies
Livestock Gross Margin Insurance for Dairy Cattle: An Analysis of Program Performance and Cost under Alternative Policy Configurations
Since the 1980’s there has been a significant increase in the variability of milk prices in the U.S. This price variability has had a major impact on the profitability of many dairy farms (Chidmi et al., 2005). In response to this variability there has been a resurgence in the use of dairy-based futures and options. Specifically, today there exist futures and options markets for Class III milk, butter, dry whey and non-fat dry milk. These markets are increasingly being used by dairy farm operators to control their milk price risk, by dairy manufactures to control their milk costs and by users of dairy products to control their dairy-based input costs1.
Since the early 2000’s there have existed gross margin insurance programs for
swine (LGM-Swine) and feeder cattle (LGM-Cattle) 2. These programs have been used to
establish a lower bound on gross revenue net of feed costs. Under LGM-Cattle adjusted cattle and corn futures prices are used to determine target expected and actual gross margins. For the LGM-Swine program, adjusted lean hog, corn and soybean meal futures are used to determine target expected and actual gross margins. Hart, Hayes, and Babcock (2001) and Hart, Babcock and Hayes (2003) provide an overview of these insurance programs and compare program performance with that of risk management programs based on the use of futures and options. They find that livestock producers would benefit from such insurance packages and that these insurance products provide more dollar-for-dollar benefits than the use of traditional put and call options. Further comparisons of certainty equivalent returns indicate that the insurance policies are competitive with existing options but can be ranked behind strategies based on existing futures and options contracts.
A natural extension of the LGM-Cattle and LGM-Swine programs is the Livestock Gross Margin for Dairy Cattle (LGM-Dairy) insurance program. This program is used to establish a floor on dairy producer’s gross margin where this gross margin is defined as milk revenue less imputed purchased feed costs. This program was approved by USDA’s Risk Management Agency in July 2007 with the first policy being offered in August 2008. This program is currently available in 31 states with an additional 4 states starting with the
July 2009 insurance offering. A detailed description on the policy and how it can be used
as a risk management tool has been outlined by Gould, Mitchell and Cabrera (2008)3
Cabrera and Solis (2008) evaluated the usefulness of climate forecasts on managing LGM-Dairy by Wisconsin dairy farms. They found that the seasonal climate variability impacts feed costs, milk production, feed consumption and milk price and that Dairy producers could use climate forecasting to decide if it is convenient to purchase LGM-Dairy and the level of protection. Hence, decisions like when to buy LGM-Dairy and at what levels are crucial. With these considerations, a detailed understanding of the structure of the policy and relationships between different decision parameters is very important.
THE BASIC STRUCTURE OF LGM-DAIRY
Under the LGM-Dairy program, a dairy farm operator farmer is paid an indemnity if the difference between the contract’s Gross Margin Guarantee (GMG) and Actual Gross Margin (AGM) is positive. Coverage begins one full month after the sales closing date. The Expected Gross Margin (EGM) is the difference between expected milk revenue and imputed feed costs determined at sign-up. It is important to note that actual farm-specific milk and feed prices are not used in the calculation of the EGM, but expected state average All-Milk, state average corn and U.S. average soybean meal prices. These state level prices are obtained from average futures prices for Class III milk, corn, and soybean meal, respectively. In addition, for Class III milk and corn, month and state specific basis values are added to the above average futures prices to convert them to state All-milk and received corn price values.4 Milk revenue is product of the producer’s target milk
marketings (i.e., insurable milk quantity) and the state specific All-Milk price. The feed costs are the product of quantities of corn and soybean meal equivalents and the state specific corn and U.S. soybean meal prices:
EGMt = MMt * (ECL3Pt + MBst) – CFt*(ECPt + CBst) – SMFt*ESPt [1]
t = Month s = State
MMt = Amount of milk expected to be marketed and desired to be covered by LGM-Dairy for that month (cwt)
ECL3P = Expected Class III milk price obtained from the average final settlement price calculated over the 3rd-5th last business day of the insurance purchase month ($/cwt)5 MB = Milk basis defined as the state All-Milk price – Class III milk ($/cwt)
CF = Corn equivalent expected to be fed (tons)
ECP = Expected monthly corn price obtained from the average final settlement price calculated over the 3rd-5th last business days of the insurance purchase month ($/ton) CB = Corn basis defined as the state price received for corn grain – corn ($/ton).
SMF = Soybean meal equivalent expected to be fed (ton)
ESP = Expected monthly soybean meal price obtained from the soybean meal futures average final settlement price calculated over the 3rd-5th last business days of the insurance purchase month ($/ton)
Total program expected gross margin is the sum of the monthly EGM’s over the
10 month insurance period. Dairy farm operators need to provide quantity of the milk to be insured and estimated feed use over the insurance period. In any one month the farm operators can cover 0% - 100% of monthly expected production6. In addition, the farm operator need not insure all of the gross revenue associated with the covered milk. That is, a portion of this revenue could be left uninsured, referred to as the program deductible which can range from $0 - $1.50/cwt.
According to the policy rules, for a single operation, the gross revenue associated for any amount of milk up to 240,000 cwt per insurance period can be insured. According to program rules, the total amount of corn and soybean meal equivalent to be fed is not specified but the per cwt feedings of these equivalents need to be within wide feeding ranges7. For corn equivalents, the feeding rate must be between the range of 0.00364 and 0.02912 tons per cwt milk whereas for soybean meal equivalents the allowable feeding range must lie between 0.000805 and 0.006425 tons per cwt milk.
The GMG for the tth month is calculated as that month’s EGM minus the level of deductible (DL, $/cwt) chosen times the covered milk marketings (cwt).
The sum of the gross margin guarantee across all coverage months (GMG) is the total GMG under the insurance contract. The Indemnity (IND) is the difference, if positive, between the GMG and AGM.
IND = max (GMG – AGM, 0) [3]
AGM is calculated using the actual prices of Class III milk, corn and soybean meal prices which are obtained from the futures settle prices for each commodity over the last 3 trading days prior to the last trading day at the end of each futures contract period.
Unlike some crop insurance products, there are no producer premium subsidies under LGM-Dairy. As such, to be actuarially sound, producer premiums need to equal expected indemnities. In setting premiums expected indemnities are calculated using 5,000 random draws from assumed distributions of Class III, corn and soybean meal expected prices. The premium is then calculated as the average indemnity (IND) received by the producer in the long-run by simulating 5,000 price scenarios plus a 3 % reserve load:8 5000 i i 1 Indemnity PREMIUM 1.03* 5000 = ∑ = [4]
Given the above review of the basic structure of the LGM-Dairy program, it is clear that the insured milk and feed quantities as well as deductible levels are crucial in determining the GMG and associated premium. In the next section we investigate the sensitivity of the GMG and premium to the changes in the insured feed quantity and the deductible level at a constant level of insured milk quantity.
APPLICATION OF LGM-DAIRY TO A WISCONSIN DAIRY FARM
For this analysis we adopt the extreme example of where for each insurance month the purchased insurance covers all of the production over the 10 month allowable coverage period. The premium for every insurance period depends on the insured milk quantity, insured corn and soybean meal equivalents and deductible level. The insured milk quantity for all insurance periods was considered to be at a constant level per month. The allowable bounds of corn and soybean meal equivalents were divided into five equivalent
ranges to understand the sensitivity of the GMG and premium to the change in the insured feed quantities. Thus, 25 different combinations of the feed equivalents were obtained. Table 1 represents corn and soybean meal equivalents considered for the analysis.
[Table 1 ]
We undertook a series of simulations for a hypothetical Wisconsin dairy farm using the University of Wisconsin’s LGM-Dairy premium calculator
(http://future.aae.wisc.edu/lgm_dairy.html#2) for four insurance purchase months:
August 2008 - November 2008. Constant levels of corn and soybean meal equivalents were considered for every coverage month. The resulting GMG and producer premiums were calculated for 25 different feed combinations and 16 deductible levels. Table 2 represents an example of the type of results generated under these 25 scenarios.
[Table 2]
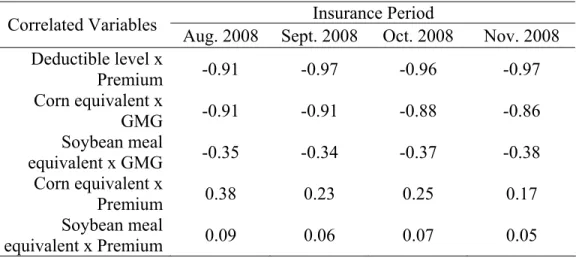
As noted above we used the 25 alternative feeding scenarios and 16 allowable deductible levels to examine the relationship between GMG and premium with insured feed quantity and deductible level. In table 3 we show estimated correlation coefficients for a number of policy variables.
[Table 3]
Not surprisingly, largest (absolute value) correlation coefficient was obtained between insurance deductible and premium with a range from -0.91 to -0.97. The lower the deductible, the higher will be the premium as the probability of payout increases with lower deductible levels. Similarly we find that the GMG is highly correlated with the insured corn quantity with a range of correlation coefficients between -0.86 to -0.911. In contrast to these large coefficients, the correlation between GMG and soybean meal equivalents are relatively low with a range from -0.34 to -0.38. The correlations between the amount of corn equivalent and premium also have a relatively low value with a range of 0.17 to 0.38 across feeding scenarios. Soybean meal equivalents also were found to show a very low correlation coefficient ranging from 0.05 to 0.09.
With an increase in deductible level, premium decreases as it reduces the potential insurance liability given the lower GMG. For every cwt of insured milk, if the deductible level is increased by 10 cents, premium decreases by 2 to 5 cents, while GMG decreases
by exactly 10 cents as defined in Eq. [2]. Hence, at constant insured milk quantity, GMG decreases by an amount equal to the deductible level while the decrease in premium depends on the actual prices and futures prices for milk and feed as in Eq. [3] and [4]. Furthermore at a deductible level of $1.5 per cwt milk, premium as percentage of GMG is between 1.5 to 3 %; whereas at $0 per cwt deductible, it is 6 to 7 % for Avg-Avg feeding
scenario (Table 4).
[Table 4]
The sensitivity of policy premium to insured feed quantity for three feeding
scenarios (Min-Min, Avg-Avg and Max-Max) is shown in Figure 1. Maximum amounts
of feed equivalents correspond with higher premium levels compared to premiums
obtained under the minimum feed equivalent price scenarios. At a deductible of $1.50 per cwt milk, the premium for August 2008 insurance period at maximum bounds of insured feed equivalents is approximately 43 cents per cwt milk, while at the medium bounds, it is 28 cents per cwt of milk and for minimum bounds is 21 cents per cwt milk.
[Figure 1]
Table 5 shows the percentage premium change as a result of changes in the bounds of insured feed quantities. For example with a decrease in the insured feed equivalents from maximum bounds to medium the premium for August 2008 insurance period decreases by approximately 17 %, whereas if the insured feed equivalents are decreased from medium bounds to minimum bounds, premium decreases by 10 %.
[Table 5]
The sensitivity of GMG across deductible levels to different bounds of insured feed quantities for the four insurance periods was analyzed (figure 2).
[Figure 2]
Figure 2 shows that with a constant deductible level GMG decreases with an increase in the insured corn and soybean meal equivalents. For November 2008, GMG at a deductible level of $0.5 per cwt milk using the Max-Max feeding regime is about $10
per cwt milk. Under the Med-Med feeding scenario, the GMG was estimated to be
Changes in deductible levels and feeding regimes impact the probability of receiving an indemnity. To simulate these probabilities we used the 5,000 simulations to estimate the percent of observations where a positive indemnity is recorded. We
estimated these probabilities under all feed regimes and deductible levels. In Figure 3 we show the probability of positive indemnities over the 5,000 simulations for Nov. 2008 under alternative feeding regimes.
[Figure 3]
Figure 3(a) and (c) reflect that at maximum coverage levels ($0 per cwt milk deductible), probability of payouts for the minimum bounds of insured feed was approximately 58 % and the indemnities ranged from $0 to $5.50 per cwt milk, while probability of payouts at maximum bounds of insured feed was almost 51 % with indemnities ranging from $0 to $8.20 per cwt milk. Figure 3(b) and (d) reflect that at maximum levels of deductible ($1.5 per cwt milk), the probability of payouts for the minimum bounds of insured feed was approximately 23% and the indemnities ranged from $0 to $4 per cwt milk, while probability of payouts at maximum bounds of insured feed was almost 37 % with indemnities ranging from $0 to $8.4 per cwt milk. Similar trend was observed for August 2008, September 2008 and October 2008 insurance
periods. For example for the October 2008 insurance period, at maximum coverage levels ($0 per cwt milk deductible), probability of payouts for the minimum bounds of insured feed was approximately 53 % and the indemnities ranged from $0 to $ 5.2 per cwt milk, while probability of payouts at maximum bounds of insured feed was almost 52 % with indemnities ranging from $0 to 9.2 per cwt milk. At maximum levels of deductible ($1.5 per cwt milk), the probability of payouts for the minimum bounds of insured feed was approximately 21% and the indemnities ranged from $0 to $3.7 per cwt milk, while probability of payouts at maximum bounds of insured feed was almost 24 % with indemnities ranging from $0 to 7.6 per cwt milk.
From results above, it can be inferred that at higher levels of deductibles, there is lesser probability of payouts and vice versa. While at maximum bounds of insured feed equivalents, the range of indemnities is larger than at minimum bounds of insured feed.
To understand the variability, variance was calculated for different feeding scenarios and coverage levels for the August - November 2008 insurance periods (table 6).
[Table 6] CONCLUSION
This paper provides an overview of the basic structure of LGM-Dairy and key
relationships between different variables like insured corn quantity, insured soybean meal quantity and deductible levels with premium and GMG. Three important insights that are inferred from the correlation coefficients are i) deductible level and premium have a highly negative and strong association; ii) insured corn equivalents and GMG have a highly negative and strong association and iii) in comparison to insured corn equivalents, insured soybean meal equivalents do not have a strong association with GMG. Results from graphical analysis further corroborate some of these findings. Our results indicate that insurance premium is very sensitive to deductible level and insured feed quantity. With an increase in the deductible level, premium decreases and vice versa. While at a constant deductible level, as the insured feed quantities are reduced, premium decreases. However the percentage reduction in premium also decreases. GMG on the other hand, is very sensitive to changes in the insured feed quantities and insured corn equivalents in particular. With an increase in the insured feed quantities, GMG decreases and vice versa. Further at higher levels of deductibles, there is lesser probability of payouts and vice versa. While at maximum bounds of insured feed equivalents, the range of indemnities is larger than at minimum bounds of insured feed.
Footnotes
1 As an example, in April 2009, approximately 3.5% of annual U.S. milk production is
represented by the open interest in Class III milk futures alone.
2 An overview of the current LGM-Cattle and LGM-Swine programs can be found at the
USDA’s Risk Management Agency’s website: http://www.rma.usda.gov/livestock/.
3 An extensive website devoted to LGM-Dairy can be found at the University of
Wisconsin’s Understanding Dairy Markets website: http://future.aae.wisc.edu/lgm_dairy.html. 4 Starting with the July 2009 insurance contract offering, the use of All-Milk – Class III basis and State Corn – Corn Futures basis will be discontinued.
5 Starting with the July 2009 insurance contract offering, the expected price measurement period will be for the three business days ending on the last business Friday of each month 6 Although the insurance period is for 10 months, not all months need to be covered by the contract and the producer can stack multiple insurance contracts as long as total insured production does not exceed 100%.
7 Starting with the July 2009 insurance contract offering, the producer can elect to use the prescribed feed use coefficients if desired.
8 For more detail concerning the procedures used to simulate actual gross margins, refer to USDA (2008).
References
Cabrera, V.E., and D. Solis. 2008. Managing the newly created LGM-Dairy insurance under seasonal climate variability. J. Dairy Sci. 91 (Suppl. 1):557.
Chidmi, B., R.A. Lopez, and R.W. Cotterill. 2005. The dairy compact, market power, and milk prices in Boston. Agribusiness:An International J.21:475-491.
Gould, B.W., P.D. Mitchell, and V.E. Cabrera. 2008. USDA’s Gross Margin Insurance Program for Dairy: What is it and Can it be Used for Risk Management. Marketing and Policy Briefing Paper, Department of Agricultural and Applied Economics, University of Wisconsin-Madison. Available at:
http://future.aae.wisc.edu/pubs/pubs/show/339.
Hart, C.E., B.A. Babcock, and D.J. Hayes. 2001. Livestock Revenue Insurance. J. Futures Markets 21:553-580.
Hart, C.E., D.J. Hayes, and B.A. Babcock. 2003. Insuring eggs in baskets: Should the government insure individual risks? Staff General Research Papers 10669, Iowa State University, Department of Economics, Ames.
US Department of Agriculture (USDA). 2008. Livestock Gross Margin – Dairy website, http://www.rma.usda.gov/policies/2009/lgm/09lgmdairypolicy.pdf
Table 1. Alternative Insured Corn and Soybean Meal Equivalents Used in Simulations Feed Scenario Corn Equivalent (tons/cwt) Soybean Meal (tons/cwt) Minimum Allowed by LGM-Dairy [Min] 0.00364 0.000805
Midpoint Between Avg and
Min [Mid_Min] 0.01001 0.00221
Average of Minimum and
Maximum Allowed [Avg] 0.01638 0.003615
Midpoint Between Avg and
Max [Mid_Max] 0.02275 0.00502
Maximum Allowed by
Table 2. Example GMG and Premium Data Generated for August 2008 – November 2008 Insurance Periods
Insurance Period Feed Equivalent
Scenario* Aug. 2008 Sept. 2008 Oct. 2008 Nov. 2008
Corn Soybean meal Deductible ($/cwt) ($/cwt) GMG Premium ($/cwt) GMG ($/cwt) Premium ($/cwt) GMG ($/cwt) Premium ($/cwt) GMG ($/cwt) Premium ($/cwt) Min Min 0 17.59 0.77 17.08 0.87 15.43 0.72 15.67 0.81 Mid-Min Mid-Min 0.10 15.60 0.74 15.24 0.83 14.00 0.69 14.37 0.77 Avg Avg 0.50 13.32 0.61 13.09 0.67 12,27 0.54 12.77 0.60 Min Max 0.80 14.70 0.44 14.40 0.52 13.04 0.39 13.40 0.46 Mid-Max Mid-Max 1.00 10.94 0.50 10.85 0.52 10.44 0.40 11.07 0.45 Max Min 1.20 10.94 0.46 10.79 0.47 10.49 0.35 11.14 0.39 Max Max 1.50 8.56 0.43 8.61 0.42 8.61 0.32 9.37 0.34
Table 3. Correlation Coefficients Between Contract Characteristics, Aug. – Nov. 2008 Insurance Periods
Insurance Period Correlated Variables
Aug. 2008 Sept. 2008 Oct. 2008 Nov. 2008
Deductible level x Premium -0.91 -0.97 -0.96 -0.97 Corn equivalent x GMG -0.91 -0.91 -0.88 -0.86 Soybean meal equivalent x GMG -0.35 -0.34 -0.37 -0.38 Corn equivalent x Premium 0.38 0.23 0.25 0.17 Soybean meal equivalent x Premium 0.09 0.06 0.07 0.05
Table 4. Premium as % of GMG in Avg-Avg feeding scenario across all deductibles Deductible ($/cwt) Aug. 2008 (%) Sept. 2008 (%) Oct. 2008 (%) Nov. 2008 (%) 0 6.14 6.76 6.09 6.38 0.1 5.81 6.42 5.73 6.03 0.2 5.49 6.09 5.37 5.69 0.3 5.18 5.76 5.04 5.36 0.4 4.88 5.45 4.71 5.03 0.5 4.60 5.15 4.39 4.72 0.6 4.32 4.85 4.09 4.43 0.7 4.05 4.57 3.80 4.14 0.8 3.79 4.30 3.53 3.87 0.9 3.55 4.03 3.27 3.60 1.0 3.31 3.78 3.02 3.35 1.1 3.08 3.54 2.78 3.11 1.2 2.87 3.30 2.55 2.88 1.3 2.66 3.08 2.34 2.66 1.4 2.47 2.87 2.14 2.45 1.5 2.28 2.67 1.95 2.25
Table 5. Percent Change in Premium under Alternative Feed Equivalents and Deductible Level
Insurance Period
August 2008 September 2008 October 2008 November 2008 Deductible ($/cwt) Max→ Med (%) Med → Min (%) Max→ Med (%) Med → Min (%) Max→ Med (%) Med → Min (%) Max→ Med (%) Med → Min (%) 0 16.5 9.7 10.4 5.5 12.5 6.9 8.3 4.3 0.10 17.5 10.5 11.0 5.9 13.4 7.4 8.9 4.7 0.50 21.7 14.2 13.7 7.9 17.4 10.4 11.8 6.4 0.90 26.6 18.5 17.1 10.2 22.2 13.9 15.3 8.7 1.00 27.9 19.8 18.1 10.7 23.5 14.9 16.4 9.3 1.20 30.6 22.4 20.1 12.2 26.2 17.1 18.4 10.8 1.50 35.1 27.0 23.5 14.7 31.0 21.4 21.9 13.1 Note: This data represents the percentage change in premium with changes in bounds of insured feed equivalents from maximum to medium and from medium to minimum insured feed equivalents for August - November 2008 insurance periods. Refer to Table 1 for definition of the feeding scenarios.
Table 6. Variance of 5,000 Simulated Indemnities under Alternative Feeding Levels and Premiums ($/cwt)
Min-Min Max-Max
Insurance Period Deductible $0 Deductible $1.50 Deductible $0 Deductible $1.50
August 2008 1.09 0.67 0.57 0.31 September 2008 1.30 0.38 2.03 0.83 October 2008 0.91 0.19 1.60 0.59 November 2008 1.08 0.27 1.65 1.04
Figure 1: Impacts of Deductible on Premium: Max-Max, Min-Min and Avg-Avg Feeding Scenarios
(a) August 2008 insurance period
0.00 0.20 0.40 0.60 0.80 1.00 0 0.2 0.4 0.6 0.8 1 1.2 1.4 Deductible level ($/cwt) Pr em iu m ( $/c wt)
Maximum insured feed quantity Medium insured feed quantity Minimum insured feed quantity
(b) September 2008 insurance period
0.00 0.20 0.40 0.60 0.80 1.00 0 0.2 0.4 0.6 0.8 1 1.2 1.4 Deductible level ($/cwt) Pr em iu m ( $/ cw t)
(c) October 2008 insurance period
0.00 0.20 0.40 0.60 0.80 1.00 0 0.2 0.4 0.6 0.8 1 1.2 1.4 Deductible level ($/cwt) Pr em iu m ( $/ cw t)
(d) November 2008 insurance period
0.00 0.20 0.40 0.60 0.80 1.00 0 0.2 0.4 0.6 0.8 1 1.2 1.4 Deductible level ($/cwt) Pr em iu m ( $/c w t)
Figure 2. Sensitivity of GMG to Deductible Levels and Alternative Feeding Regimes
(a) Sensitivity of GMG for August 2008 insurance period to insured feed equivalents
8 10 12 14 16 18 0 0.2 0.4 0.6 0.8 1 1.2 1.4 Deductible level ($/cwt) GM G ( $/ cwt ) maximum bounds of insured feed medium bounds of insured feed minimum bounds of insured feed
(b) Sensitivity of GMG for September 2008 insurance period to insured feed equivalents
8 10 12 14 16 18 0 0.2 0.4 0.6 0.8 1 1.2 1.4 Deductible level ($/cwt) GM G ( $/ cwt )
(c) Sensitivity of GMG for October 2008 insurance period to insured feed equivalents
8 10 12 14 16 18 0 0.2 0.4 0.6 0.8 1 1.2 1.4 Deductible level ($/cwt) GM G ( $/ cwt )
(d) Sensitivity of GMG for November 2008 insurance period to insured feed equivalents
8 10 12 14 16 18 0 0.2 0.4 0.6 0.8 1 1.2 1.4 Deductible level ($/cwt) GM G ( $/ cw t)
Figure 3. Cumulative Probability of positive indemnities for Nov. 2008 under Alternative Feeding Regimes
a) Payout probability at $0 per cwt milk deductible for minimum bounds of insured feed
0.4 0.5 0.6 0.7 0.8 0.9 1 0 1 2 3 4 5 6 7 8 9 10 Indemnity ($/cwt) C um ula tiv e p ro ba bili ty 0.4 0.5 0.6 0.7 0.8 0.9 1 0 1 2 3 4 5 6 7 8 9 10 Indemnity ($/cwt) C um ula tiv e p ro ba bil ity
c) Payout probability at $1.5 per cwt milk deductible for minimum bounds of insured feed
0.4 0.5 0.6 0.7 0.8 0.9 1 0 1 2 3 4 5 6 7 8 9 10 Indemnity($/cwt) Cu m ul ati ve p ro ba bili ty
c) Payout probability at $0 per cwt milk deductible for maximum bounds of insured feed
0.4 0.5 0.6 0.7 0.8 0.9 1 0 1 2 3 4 5 6 7 8 9 10 Indemnity ($/cwt) Cu m ula tiv e p ro ba bi lity
d) Payout probability at $1.5 per cwt milk deductible for maximum bounds of insured feed
![Table 1. Alternative Insured Corn and Soybean Meal Equivalents Used in Simulations Feed Scenario Corn Equivalent (tons/cwt) Soybean Meal (tons/cwt) Minimum Allowed by LGM-Dairy [Min] 0.00364 0.000805](https://thumb-us.123doks.com/thumbv2/123dok_us/1638271.2723659/12.918.226.703.195.473/alternative-insured-soybean-equivalents-simulations-scenario-equivalent-soybean.webp)