Advanced General
Aviation Transport
Experiments
A – Basis and B – Basis
Design Allowables
for
Epoxy – Based Prepreg
TORAY T700SC-12K-50C/#2510
Plain Weave Fabric
[SI Units]
AGATE-WP3.3-033051-134
October 2002
J. Tomblin, J. Sherraden, W. Seneviratne, K. S. Raju
National Institute for Aviation Research Wichita State University
iii
TABLE OF CONTENTS
1. INTRODUCTION...1 1.1. Scope ...2 1.2. Symbols Used ...31.3. Acronyms and Definitions ...4
1.4. References ...5
1.5. Methodology ...9
1.5.1. Test Matrix...9
1.5.2. Environmental Conditioning ...11
1.5.3. Fluid Sensitivity Screening ...11
1.5.4. Normalization Procedures ...13
1.5.5. Statistical Analysis ...14
1.5.6. Material Performance Envelope and Interpolation...14
1.5.6.1. Interpolation Example...16
2. TORAY T700SC-12K-50C/#2510 PROCEDURES AND PREPREG PROPERTIES ...18
2.1. GENERAL...19
2.1.1. Materials...19
2.1.2. Lay-up/Bagging ...19
2.1.3. Cure ...20
2.1.4. Non-Destructive Inspection (NDI) ...20
2.1.5. Tabbing ...23
2.1.6. FAA Test Coupon Conformity and Test Witness ...23
2.1.6.1. Test Coupon Conformity...23
2.1.6.2. Test Witness ...24
2.2. Prepreg Documentation by Prepreg Lot ...25
2.3. Data Documentation ...28
3. TORAY T700SC-12K-50C/#2510 LAMINA PROPERTIES...31
3.1.1. Summary ...32
3.1.2. Individual Test Summaries ...33
3.1.2.1. Tension, 1-axis ...34 3.1.2.2. Tension, 2-axis ...35 3.1.2.3. Compression, 1-axis ...36 3.1.2.4. Compression, 2-axis ...37 3.1.2.5. Shear, 12 axis ...38 3.1.2.6. Shear, 13 axis ...39
3.1.3. Individual Test Charts ...40
3.1.3.1. Tension, 1-axis ...41 3.1.3.2. Tension, 2-axis ...42 3.1.3.3. Compression, 1-axis ...43 3.1.3.4. Compression, 2-axis ...44 3.1.3.5. Shear, 12 axis ...45 3.1.3.6. Shear, 13 axis ...46 3.2. Raw Data ...47
3.2.1. Raw Data Spreadsheets and Scatter Charts ...48
3.2.2. Fluid Sensitivity Raw Data Spreadsheets and Scatter Charts ...95
3.2.3. Representative Shear Stress-Strain Curve ... 100
3.3. Statistical Results ... 102
APPENDIX A. PHYSICAL AND MECHANICAL TEST PROCEDURES ... 113
A.1. Physical Properties ... 114
A.1.1. Uncured Resin Content ... 114
A.1.2. Uncured Volatile Content ... 114
A.1.3. Resin Gel Time ... 114
A.1.4. Resin Flow ... 114
A.1.5. Uncured Fiber Areal Weight ... 114
A.1.6. Infrared Spectroscopy... 114
A.1.7. High Performance Liquid Chromatography (HPLC) ... 115
A.1.8. Differential Scanning Calorimetry (DSC) ... 115
v
A.1.10. Fiber Volume ... 115
A.1.11. Resin Volume ... 115
A.1.12. Void Content ... 116
A.1.13. Cured Laminate Tg by DMA ... 116
A.2. TENSILE PROPERTIES ... 116
A.2.1. 0° (Warp) and 90° (Fill) Tensile Properties ... 116
A.2.1.1. Tensile Calculations ... 117
A.2.1.1.1. Tensile Strength (Un-normalized) ... 117
A.2.1.1.2. Tensile Strength (Normalized) ... 118
A.2.1.1.3. Tensile Modulus of Elasticity (Un-normalized) ... 118
A.2.1.1.4. Tensile Modulus of Elasticity (Normalized) ... 118
A.2.1.1.5. 0° (Warp) Tensile Poisson’s Ratio ... 118
A.3. COMPRESSIVE STRENGTH ... 119
A.3.1. 0° (Warp) and 90° (Fill) Compressive Strength Properties ... 119
A.3.1.1. Compressive Strength Calculations ... 120
A.3.1.1.1. Compressive Strength Calculation (Un-normalized) ... 120
A.3.1.1.2. Compressive Strength Calculation (Normalized) ... 120
A.4. COMPRESSIVE MODULUS ... 120
A.4.1. 0° (Warp) and 90° (Fill) Compression Modulus Properties ... 120
A.4.1.1. Compression Modulus Calculations ... 121
A.4.1.1.1. Compressive Modulus Calculation (Un-normalized) ... 121
A.4.1.1.2. Compressive Modulus Calculation (Normalized) ... 122
A.5. IN-PLANE (IOSIPESCU) SHEAR ... 122
A.5.1. In-plane (Iosipescu) Shear Strength Calculations ... 123
A.5.1.1. In-plane (Iosipescu) Shear, Ultimate Strength Calculation... 123
A.5.1.2. In-plane (Iosipescu) Shear, Modulus Calculation... 123
A.6. SHORT BEAM SHEAR... 123
A.6.1. Short Beam Shear Strength Calculations ... 124
A.6.1.1. Short Beam Shear Strength Calculation... 124
APPENDIX B. MOISTURE CONDITIONING HISTORY CHARTS... 125
APPENDIX C. PHYSICAL TEST RESULTS... 135
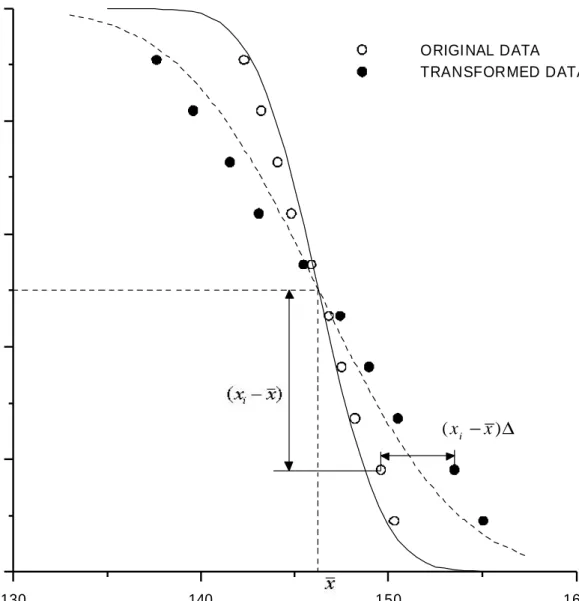
APPENDIX E. METHOD FOR TRANSFORMING VARIANCES OF TEST
SAMPLES (SUPPLEMENT TO DOT/FAA/AR-47/00) ... 172 APPENDIX F. RAW TESTING SUMMARIES ... 178 APPENDIX G. DATES OF PANEL MANUFACTURE AND COPY OF FAA
1
1. INTRODUCTION
This material characterization program was performed to characterize the lamina properties of Toray Composites (America), T700SC-12K-50C/#2510, 190 g/m2, plain weave fabric, herein designated F6273C-07M. The F6273C-07M prepreg material system designation shall be used to refer the material in this report. The material qualification was conducted under FAA project number TC1616SE-A through Lancair Company that wanted to use the aforementioned material prepreg system on their LC40 aircraft.
This report contains the test results obtained from the tests conducted for the material qualification of F6273C-07M in accordance with FAA Document DOT/FAA/AR-00/47: Material Qualification and Equivalency for Polymer Matrix Composite Material Systems and Toray Composites (America), Inc. (TCA) Material Process Specification, TCSPF-T-FC05, Revision 1 dated February 4, 2000. Toray Composites (America), Inc. (TCA), Integrated Technologies (Intec), National Institute for Aviation Research (NIAR) and Rose Consulting performed the testing on the unexposed and exposed prepreg materials for lamina baseline test properties in accordance with ASTM test methods, SACMA test methods, and TCA test work instructions.
Three batches of F6273C-07M and the corresponding mixed resins were tested for baseline test properties. The data reported herein will be used to set material acceptance criteria for future material production and material receipt. The Raw Test Data, Inspection Records, Fabrication Records, Processing Records and all other relevant documents of this report, TCQAL-T-1013, are archived at Toray Composites (America), Inc., and it is available only upon request.
The physical and chemical tests were performed on the mixed resins, the uncured prepreg materials and cured prepreg laminates. The mixed resins were evaluated for cured neat resin density. The uncured prepreg samples were evaluated for resin content, fiber areal weight, volatile content, gel time, flow, IR (Infrared Spectroscopy), HPLC (High Performance Liquid Chromatography) and DSC (Differential Scanning Calorimetry). The cured prepreg laminates were tested for fiber volume, resin volume, void content, cured ply thickness and Tg (glass transition temperature) by DMA (Dynamic Mechanical Analyzer).
TCA Test Laboratories performed all the physical and chemical tests on the mixed resins, the uncured prepreg materials and cured prepreg laminates, except for fiber volume, resin volume and void content that Intec performed and cured laminate glass transition temperature, dry and wet conditions, that Rose Consulting performed.
TCA Test Laboratories performed the fabrication of all the test panels and test specimens, ultrasonic inspection, chemical and humidity conditioning, except for 0° and 90° Compressive Strength specimens that NIAR tabbed and machined.
Also, the TCA Test Laboratories performed the attachment of strain gauges and mechanical testing, except for specimens tested at –65 °F (Dry) that Intec performed. Moreover, TCA Test Laboratories performed the fluid sensitivity on one qualification batch by testing in-plane (iosipescu) shear strength only.
All TCA and Intec test equipments were calibrated with standards traceable to the NIST.
1.1. Scope
The test methods and results described in this document are intended to provide basic composite properties essential to most methods of analysis. These properties are considered to provide the initial base of the “building block” approach. Additional coupon level tests and sub-element tests may be required to fully substantiate the full-scale design.
The test methods and results contained in this document are consistent with MIL-HDBK-17-1E,2D,3E - Military Handbook for Polymer Matrix Composites. All material, specimens, fixtures and test results contained within this document were traceable and conformed by the Federal Aviation Administration (FAA). It should be noted that before application of the basis values presented in this document to design, demonstration of the ability to consistently produce equivalent material properties as that evaluated during this program should be substantiated through an acceptable test program.
3
1.2. Symbols Used
ν12tu major Poisson’s ratio, tension
µε micro-strain
E1c compressive modulus, longitudinal
E1t tensile modulus, longitudinal
E2c compressive modulus, transverse
E2t tensile modulus, transverse
F12su in – plane shear strength
F13su apparent interlaminar shear strength
F1cu compressive strength, longitudinal
F1tu tensile strength, longitudinal
F2cu compressive strength, transverse
F2tu tensile strength, transverse
G12s in – plane shear modulus
Superscripts c compression cu compression ultimate s shear su shear ultimate t tension tu tension ultimate Subscripts 1 1 – axis; longitudinal
(parallel to warp direction of reinforcement) 2 2 – axis; transverse
(parallel to fill direction of reinforcement) 12 in – plane shear
1.3. Acronyms and Definitions
A – Basis 95% lower confidence limit on the first population percentile
AGATE Advanced General Aviation Transport Experiments ASTM American Society for Testing and Materials
B – Basis 95% lower confidence limit on the tenth population percentile
C. V. coefficient of variation CTD cold temperature dry CPT cured ply thickness
DMA dynamic mechanical analysis
Dry specimen tested with an “as fabricated” moisture content
ETD elevated temperature dry ETW elevated temperature wet FAR Federal Aviation Regulations FAW fiber areal weight
Gr/Ep graphite/epoxy
NASA National Aeronautics and Space Administration RTD room temperature dry
SACMA Suppliers of Advanced Composite Materials Association
SRM SACMA Recommended Method
Tg glass transition temperature
tply cured ply thickness
wet specimen tested with an equilibrium moisture content per section 1.5.2
5
1.4. References
ASTM Standards
D 792-91 “Standard Test Method for Density and Specific Gravity of Plastics by Displacement,” American Society for Testing and Materials, Philadelphia, PA 1991.
D2344 “Standard Test Method for Apparent Interlaminar Shear Strength of Parallel Fiber Composites by Short-Beam Method,” American Society for Testing and Materials, Philadelphia, PA.
D2734 “Standard Test Method for Void Content of Reinforced Plastics,” American Society for Testing and Materials, Philadelphia, PA 1994
D3039 “Standard Test Method for Tensile Properties of Polymeric Matrix Composite Materials," American Society for Testing and Materials, Philadelphia, PA 1995.
D3171-90 “Standard Test Method for Fiber Content of Resin-Matrix Composites by Matrix Digestion,” American Society for Testing and Materials, Philadelphia, PA 1990
D3530-90 “Standard Test Method for Volatiles Content of Epoxy Matrix Prepreg” American Society for Testing and Materials,
Philadelphia, PA 1990
D3531-76 “Standard Test Method for Resin Flow of Carbon Fiber-Epoxy Prepreg,” American Society for Testing and Materials, Philadelphia, PA.
D3532 “Standard Test Method for Gel Time of Carbon Fiber-Epoxy Prepreg,” American Society for Testing and Materials, Philadelphia, PA.
D4065-93 “Standard Practice for Determining and Reporting Dynamic Mechanical Properties of Plastics,” American Society for Testing and Materials, Philadelphia, PA 1993.
D4473 “ Standard Practice for Determining Cure Behavior of Thermosetting Resins Using dynamic Mechanical
Procedures,” American Society for Testing and Materials, Philadelphia, PA.
D5379-98 “Shear Properties of Composite Materials by the V-Notched Beam Method,” American Society for Testing and Materials, Philadelphia, PA 1998.
E168 “General Techniques of Infrared Quantitative Analysis,” American Society for Testing and Materials, Philadelphia, PA 1992.
E1252 “Standard Practice for General Techniques for Qualitative Infrared Analysis,” American Society for Testing and Materials, Philadelphia, PA 1995.
E1356 “Glass Transition Termperature by Differential Scanning Calorimetry or Differential Thermal Analysis,” American Society for Testing and Materials, Philadelphia, PA 1995.
SACMA Standards
SRM-1R-94 “Compressive Properties of Oriented Fiber-Resin
Composites," Suppliers of Advanced Composite Materials Association, 1994.
SRM-18R-94 “Glass Transition Temperature (Tg) Determination by DMA of Oriented Fiber-Resin Composites," Suppliers of Advanced Composite Materials Association, 1994.
SRM-19R-94 “Viscosity characteristics of Matrix Resins," Suppliers of Advanced Composite Materials Association, 1994. SRM-20R-94 “High Performance Liquid Chromatography of Thermoset
Resins," Suppliers of Advanced Composite Materials Association, 1994.
SRM-22R-94 “Determining the Resin Flow of Preimpregnated “B” Staged Material," Suppliers of Advanced Composite Materials Association, 1994.
7
Thermoset Prepreg with Destructive Technique," Suppliers of Advanced Composite Materials Association, 1994. SRM-25R-94 “Onset Temperature and Peak Temperature for Composite
System Resins Using Differential Scanning Calorimetry (DSC)," Suppliers of Advanced Composite Materials Association, 1994.
Toray Documents
TCSPF-T-FC05 “Material Process Specification for Torayca Plain Weave Carbon Fiber Fabric Preimpregnated with Epoxy Resin (EP-resin) Prepreg Fabric – 250°F Curing System,” Revision 1, Toray Composites (America), Inc., Puyallup, WA, February 4, 2000. TCWIN-U-C002 “Fourier Transform Infrared Analysis," Toray
Composites (America), Inc., Puyallup, WA, 1998. TCWIN-U-C003 “Differential Scanning Calorimetry," Toray Composites
(America), Inc., Puyallup, WA, 1998.
TCWIN-U-C004 “High Performance Liquid Chromatography," Toray Composites (America), Inc., Puyallup, WA, 1998. TCWIN-U-M003 “Lay-up/Vacuum Debulking,” Toray Composites
(America), Inc., Puyallup, WA, 1998.
TCWIN-U-M006 “Autoclave Curing,” Toray Composites (America), Inc., Puyallup, WA, 1998.
TCWIN-U-M008 “Panel Tabbing,” Toray Composites (America), Inc., Puyallup, WA, 1998.
TCWIN-U-M101 “Tensile Specimen Machining," Toray Composites (America), Inc., Puyallup, WA, 1998.
TCWIN-U-M102 “Compression Specimen Machining," Toray
Composites (America), Inc., Puyallup, WA, 1998. TCWIN-U-M103 “Compression Modulus Specimen Machining," Toray
TCWIN-U-M111 “90 Degree Tensile Specimen Machining," Toray Composites (America), Inc., Puyallup, WA, 1998. TCWIN-U-M201 “Tensile Testing,” Toray Composites (America),
Inc., Puyallup, WA, 1998.
TCWIN-U-M204 “Compressive Strength Testing," Toray Composites (America), Inc., Puyallup, WA, 1998.
TCWIN-U-M206 “Compressive Modulus Testing,” Toray Composites (America), Inc., Puyallup, WA, 1998.
TCWIN-U-M214 “Strain Gauge Attachment," Toray Composites (America), Inc., Puyallup, WA, 1998.
TCWIN-U-M215 “Laminate Density/Fiber Volume Testing," Toray Composites (America), Inc., Puyallup, WA, 1998. TCWIN-U-M216 “Strain Gauge Calibration," Toray Composites
(America), Inc., Puyallup, WA, 1998.
TCWIN-U-P001 “Volatile Content," Toray Composites (America), Inc., Puyallup, WA, 1998.
TCWIN-U-P004 “Resin Content/Fiber Areal Weight," Toray
Composites (America), Inc., Puyallup, WA, 1998. TCWIN-U-P007 “Gel Time," Toray Composites America), Inc.,
Puyallup, WA, 1998.
TCWIN-U-P008 “Flow," Toray Composites (America), Inc., Puyallup, WA, 1998
Other Documents
FAA Document DOT/FAA/AR-00/47: Material Qualification and Equivalency for Polymer Matrix Composite Material Systems, J.S. Tomblin, Y.C. Ng and K.S. Raju, 2001.
MIL-HDBK-17 1E, 2D, 3E – Military Handbook for Polymer Matrix Composites
9
1.5. Methodology
1.5.1. Test Matrix
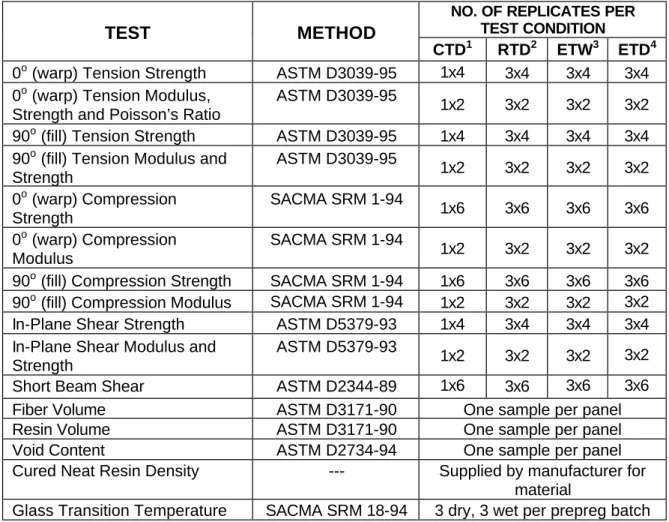
Testing was performed according to the test methods delineated in the test matrix, with modifications as referenced in FAA Document DOT/FAA/AR-00/47:
Material Qualification and Equivalency for Polymer Matrix Composite Material Systems. The test matrix for properties included in this document is listed on the next page, with the following notation cited in each column:
# x #
where the first # represents the required number of prepreg batches, defined as: Prepreg containing T700 12K graphite fibers from one mill roll, impregnated with one batch of resin in one continuous manufacturing operation with traceability to all components. The second # represents the required number of replicates per prepreg batch. For example, “3 x 6” refers to three prepreg batches of material and six specimens per prepreg batch for a total requirement of 18 test specimens.
Table 1.5.1: Minimum Recommended Test Matrix and Standards Used for Testing
NO. OF REPLICATES PER TEST CONDITION
TEST METHOD
CTD1 RTD2 ETW3 ETD4
0o (warp) Tension Strength ASTM D3039-95 1x4 3x4 3x4 3x4 0o (warp) Tension Modulus,
Strength and Poisson’s Ratio
ASTM D3039-95
1x2 3x2 3x2 3x2
90o (fill) Tension Strength ASTM D3039-95 1x4 3x4 3x4 3x4 90o (fill) Tension Modulus and
Strength ASTM D3039-95 1x2 3x2 3x2 3x2 0o (warp) Compression Strength SACMA SRM 1-94 1x6 3x6 3x6 3x6 0o (warp) Compression Modulus SACMA SRM 1-94 1x2 3x2 3x2 3x2
90o (fill) Compression Strength SACMA SRM 1-94 1x6 3x6 3x6 3x6 90o (fill) Compression Modulus SACMA SRM 1-94 1x2 3x2 3x2 3x2
In-Plane Shear Strength ASTM D5379-93 1x4 3x4 3x4 3x4
In-Plane Shear Modulus and Strength
ASTM D5379-93
1x2 3x2 3x2 3x2
Short Beam Shear ASTM D2344-89 1x6 3x6 3x6 3x6
Fiber Volume ASTM D3171-90 One sample per panel
Resin Volume ASTM D3171-90 One sample per panel
Void Content ASTM D2734-94 One sample per panel
Cured Neat Resin Density --- Supplied by manufacturer for material
Glass Transition Temperature SACMA SRM 18-94 3 dry, 3 wet per prepreg batch
Notes :
1 CTD: One prepreg batch of material tested (test temperature = -65± 5o F, moisture content = as fabricated, soak time at –65 was 5 min.)
2 RTD: Three prepreg batches of material tested (test temperature = 70± 10o F, moisture content = as fabricated)
3 ETW: Three prepreg batches of material tested (test temperature = 180± 5o F, moisture content = equilibrium per section 1.5.2, soak time at 180 was 2 min.)
4 ETD: Three prepreg batches of material tested (test temperature = 180± 5o F, moisture content = as fabricated, soak time at 180 was 2 min.)
11
1.5.2. Environmental Conditioning
All ‘wet’ conditioned samples were exposed to elevated temperature and humidity conditions to establish moisture saturation of the material. Specimens were exposed to 85 ± 5 % relative humidity and 145 ± 5 °F until an equilibrium moisture weight gain of traveler, or witness coupons (1” x 1” x specimen thickness) was achieved. ASTM D5229 and SACMA SRM 11 were used as guidelines for environmental conditioning and moisture absorption.
Effective moisture equilibrium was achieved when the average moisture content of the traveler specimen changed by less than 0.05% for two consecutive readings within a span of 7 ± 0.5 days and was expressed by:
where Wi = weight at current time
Wi-1 = weight at previous time
Wb = baseline weight prior to conditioning
It is common to see small fluctuations in an unfitted plot of the weight gain vs. time curve. There were no fluctuations that made significant errors in results or caused rejection in the moisture equilibrium criteria. Once the traveler coupons passed the criteria for two consecutive readings, the samples were removed from the environmental chamber and placed in a sealed bag with a moist paper or cotton towel for a maximum of 14 days until mechanical testing. Strain gauged specimens were removed from the controlled environment for a maximum of 2 hours for application of gages in ambient laboratory conditions.
1.5.3. Fluid Sensitivity Screening
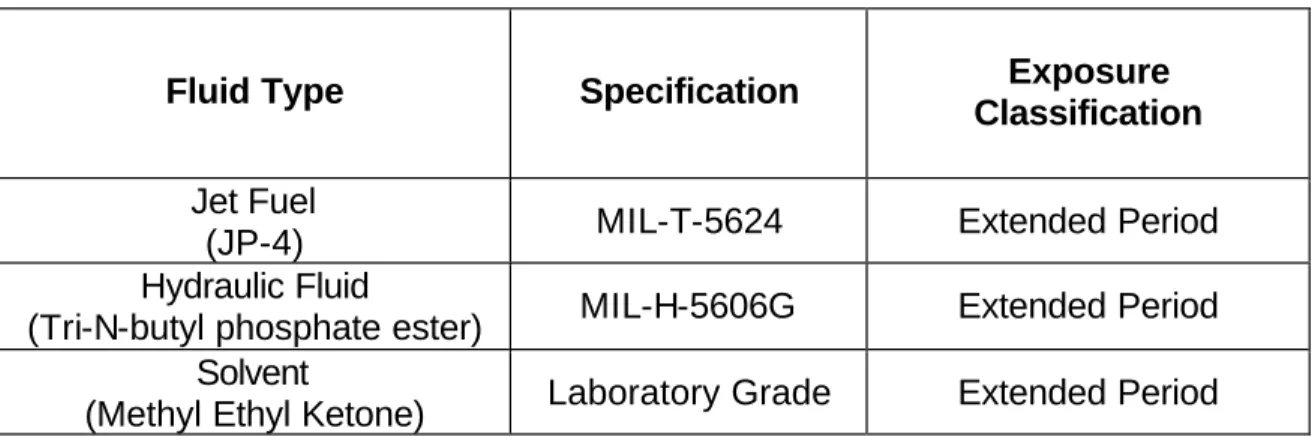
Although epoxy-based materials historically have not been shown to be sensitive to fluids other than water or moisture, the influence of some fluids other than water or moisture on the mechanical properties were characterized. These fluids fell into two exposure classifications. The first class was considered to be in contact with the material for an extended period of time, and the second class was considered to be wiped on and off (or evaporate) with relatively short exposure times.
To assess the degree of sensitivity of fluids other than water or moisture, Table 1.5.2 shows the fluids which were used in this qualification plan.
0.0005 < W W -W b 1 i i
Table 1.5.2: Fluid Types Used for Sensitivity Studies
Fluid Type Specification Exposure
Classification
Jet Fuel
(JP-4) MIL-T-5624 Extended Period
Hydraulic Fluid
(Tri-N-butyl phosphate ester) MIL-H-5606G Extended Period Solvent
(Methyl Ethyl Ketone) Laboratory Grade Extended Period
To assess the influence of various fluids types, a test method sensitive to matrix degradation was used as an indicator of fluid sensitivity and compared to the unexposed results at both room temperature dry and elevated temperature dry conditions. Table 1.5.3 describes the fluid sensitivity-testing matrix with respect to the fluids defined in Table 1.5.2. Engineering judgment and statistical tests were used to assess the degree of material degradation. The results of this screening are included following the data sheets in section 3.2.2.
Table 1.5.3: Material Qualification Program for Fluid Resistance
Fluid Type Test
Method Test Temp. (o F) Exposure1 Number of Replicates2
Jet Fuel JP-4 ASTM D53793 180 See note 4 5
Hydraulic Fluid ASTM D53793 180 See note 5 5
Solvent (MEK) ASTM D53793 Ambient See note 5 5
Notes :
1 Soaking in fluid at ambient temperature (immersion). 2 Only a single batch of material is required.
3 Shear strength only.
4 Immersion duration = 500 hours ± 50 hours 5 Immersion duration = 60 to 90 minutes
13
1.5.4. Normalization Procedures
The normalization procedure attempts to reduce variability in fiber-dominated material properties by adjusting raw test values to a specified fiber volume content. Only the following properties were normalized:
• 0° (warp) and 90° (fill) Tensile Strength and Modulus
• 0° (warp) and 90° (fill) Compression Strength and Modulus
The normalization procedure was adopted from MIL-HDBK-17-1E, section 2.4.3.3. The procedure which was used to normalize the data is based on two primary assumptions:
• The relationship between fiber volume fraction and ultimate
laminate strength is linear over the entire range of fiber/resin ratios. (It neglects the effects of resin starvation at high fiber contents.)
• Fiber volume is not commonly measured for each test sample, so this method accounts for the fiber volume variation between individual test specimens by utilizing a relationship between fiber volume fraction and laminate cured ply thickness. This relationship is virtually linear in the 0.45 to 0.65 fiber volume fraction range. Additional information is detailed in FAA Document DOT/FAA/AR-00/47: Material Qualification and Equivalency for Polymer Matrix Composite Material Systems.
For all normalized data contained in this document, the test values are normalized by cured ply thickness according to:
where: g normalizin specimen CPT CPT Value Test Value Normalized = × plies of Thickness Sample Average CPTspecimen # =
1.5.5. Statistical Analysis
When compared to metallic materials, fiber reinforced composite materials exhibit a high degree of material property variability. This variability is due to many factors, including but not limited to: raw material and prepreg manufacture, material handling, part fabrication techniques, ply stacking sequence,
environmental conditions, and testing techniques. This inherent variability drives up the cost of composite testing and tends to render smaller data sets than those produced for metallic materials. This necessitates the usage of statistical
techniques for determining reasonable design allowables for composites. The analyses and design allowable generation for both A and B basis values were performed using the procedure detailed in section 5.3 of FAA Document DOT/FAA/AR-00/47: Material Qualification and Equivalency for Polymer Matrix Composite Material Systems.
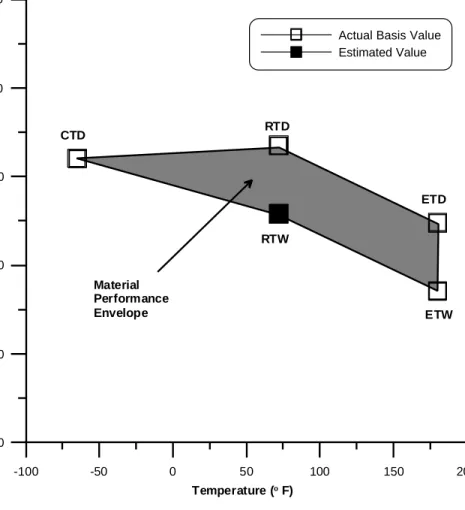
1.5.6. Material Performance Envelope and Interpolation
Using the B-basis numbers, a material performance envelope may be generated for the material system by plotting these values as a function of temperature. Figure 1.5.1 shows an example material performance envelope using B-basis values.
15 -100 -50 0 50 100 150 200 Temperature (o F) 20 40 60 80 100 120 B -B a s is S tr e n g th V a lu e s ( k s i)
Actual Basis Value Estimated Value CTD RTD ETD ETW RTW Material Performance Envelope
Figure 1.5.1 Material performance envelope.
Since each specific aircraft application of the qualified material may have different Material Operational Limits (MOL) than those tested in the material qualification (which is usually the upper limit), some applications may require a reduced MOL. In this case, simple linear interpolation may be used to obtain the corresponding basis values at the new application MOL.
This interpolation may be accomplished using the following simple relationships assuming TRTD < TMOL < TETD :
For the corresponding MOL “dry” basis value, the “interpolated” basis value using the qualification data is
(
(
)(
)
)
ETD RTD MOL RTD ETD RTD RTD MOLT
T
T
T
B
B
B
B
−
−
−
−
=
where BMOL = new application basis value interpolated to TMOL
BRTD = basis RTD strength value
BETD = basis ETD strength value
TRTD = RTD test temperature
TETD = ETD test temperature
TMOL = new application MOL temperature
For the corresponding MOL “wet” basis value, an estimated Room Temperature Wet (RTW) value must be calculated. This may be accomplished by the simple relation
)
(
ETD ETW RTD RTWB
B
B
B
=
−
−
The “interpolated” wet basis value using the qualification data may then be obtained by
(
)(
)
(
RTW ETW)
MOL RTW ETW RTW RTW MOLT
T
T
T
B
B
B
B
−
−
−
−
=
where: BMOL = new application basis value interpolated to TMOL
BRTW = estimated basis RTW strength value
BETW = basis ETW strength value
TRTW = RTW (i.e., RTD) test temperature
TETW = ETW test temperature
TMOL = new application MOL temperature
These equations may also be used for interpolated mean strengths as well as A-basis values with the appropriate substitutions. It should be noted that because unforeseen material property drop-offs with respect to temperature and
environment can occur, extrapolation to a higher MOL should not be attempted without additional testing and verification. In addition, the interpolation equations shown above are practical for materials obeying typical mechanicalbehavior. In most cases, some minimal amount of testing may also be required to verify the interpolated values.
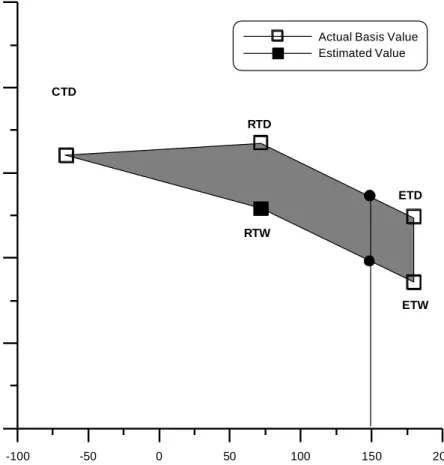
1.5.6.1. Interpolation Example
This section provides an example of linear interpolations to a specific application environment less than the tested upper material limit used in qualification.
17
Assuming a specific application environment of 150o F, Figure 1.5.2 depicts the linear interpolation of the B-basis design allowable to this environment. Using the above equations along with the nominal testing temperatures (see Table 1.5.1), the interpolated basis values at 150o F become
ETD : BMOL = 75.106 ksi
ETW : BMOL = 59.746 ksi
-100 -50 0 50 100 150 200 Temperature (o F) 20 40 60 80 100 120 B -B a s is S tr e n g th V a lu e s ( k s i)
Actual Basis Value Estimated Value CTD RTD ETD ETW RTW
2. TORAY T700SC-12K-50C/#2510 PROCEDURES AND PREPREG PROPERTIES
19
2.1. GENERAL
All of the testing described in the report took place at Toray Composites (America), Inc. in Tacoma, Washington, except for the following tests:
Test Laboratory Test Property
Integrated Technologies
acid digestions (fiber volume, resin volume, laminate density and void content)
(Intec), Bothell, WA -65°F (Dry) mechanical tests (0° & 90° Tension, 0° & 90° Comp. Modulus and In-plane Shear)
Rose Consultant, Half Moon Bay, CA
cured laminate transition glass temperature, Tg
NIAR Short Beam Shear (Additional tests)
2.1.1. Materials
The T700SC-12K-50C/#2510, F6273C-07M, Plain Weave Fabric prepreg batches were manufactured by the hot melt method of resin impregnation. Toray, Ehime of Japan and Carbon Fibers America (CFA) in Decatur, Alabama manufactured the carbon fiber. Sakai Composites of Japan performed the weaving of the plain weave fabric. The resin mixing and impregnation were done by Toray Composites (America), Inc. at the Frederickson, WA facilities.
This material qualification program characterized the physical, chemical and mechanical properties of F6273C-07M prepreg material, namely; batches AF991009, AF991010 and AF991011. The prepreg batches were manufactured with two lots of plain weave carbon fabric and three batches of resin matrix. The F6273C-07M batches were manufactured to nominal uncured resin content of 42 % (by weight) and a fiber areal weight (FAW) of 190 grams per square meter.
2.1.2. Lay-up/Bagging
TCA Test Laboratories manufactured all the mechanical test laminates by laying up plies of the F6273C-07M prepreg material in the desired orientations, and by vacuum bag cure. Both the ply orientation and vacuum bag assembly for cure were in accordance with Advanced General Aviation Transport Experiments (AGATE) “Material Qualification Methodology for Epoxy-Based Prepreg Composite Material System”, dated February 1999, TCA Material Process Specification, TCSPF-T-FC05, Revision 1 dated February 4, 2000, and TCA work instructions. Figure 2-1 describes the vacuum bag assembly for cure of
the test laminates. The test laminates were vacuum debulked in accordance with TCA work instructions, TCWIN-U-M003.
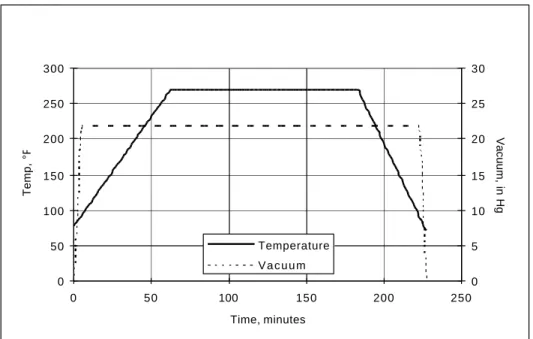
2.1.3. Cure
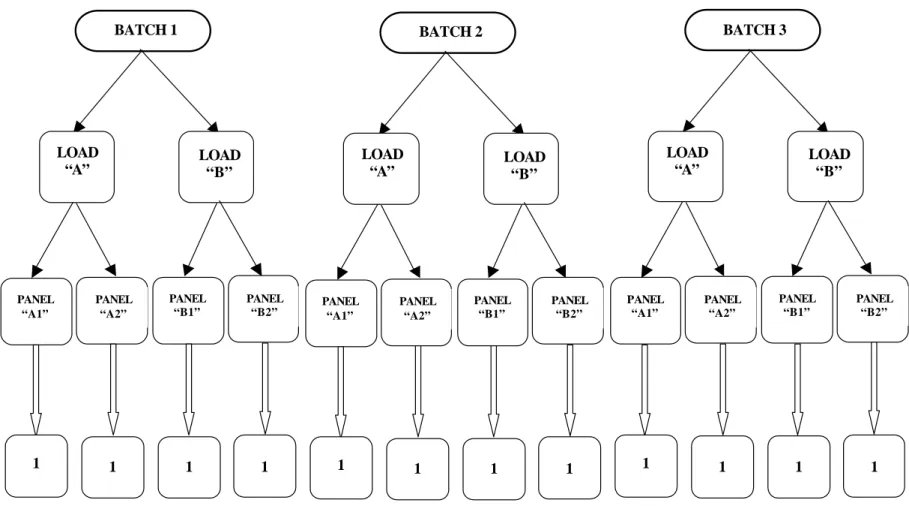
The test panels were cured in accordance with TCWIN-Q-M006 and per Figure 2-2. For the specimen selection methodology and batch traceability of each test property, batch replicates were sampled from at least two different panels covering at least two independent cycles per Figure 2-3. Test specimens were selected from each individual test panel. The test specimens were extracted from panel areas that were good, visually and based on non-destructive inspection techniques.
2.1.4. Non-Destructive Inspection (NDI)
Laminates fabricated for mechanical testing were non-destructively inspected using a Sonix/KrautKramer Branson Ultrasonic equipment at 5MHz pulse.
Figure 2-1. Vacuum Bagging Stack Sequence
1
The solid FEP may not be necessary when the caul plate is treated with a release agent, for example, Frekote release agent. Vacuum Sealant (Tack tape) Caul plate Vacuum Sealant (Tack tape) Glass yarn
Solid FEP (optional)1
Edge dam (3 sides tack tape) Laminate Pressure plate Surface breather Vacuum bag Metal dam*
(one edge only)
Edge breather
21 0 50 100 150 200 250 300 0 50 100 150 200 250 Time, minutes Temp, °F 0 5 10 15 20 25 30 Vacuum, in Hg Temperature V a c u u m Notes:
(1) Apply 22 inches Hg minimum vacuum to the vacuum bag assembly and check for leak before beginning the cure cycle. The leak rate shall be less than 2.0 inches Hg over 5 minutes.
(2) Apply the temperature ramp from ambient to 270 ± 10 °F at a rate of 3.0 ± 1.0
°F per minute.
(3) Maintain the cure temperature at 270 ± 10 °F for 120 ∼ 150 minutes.
(4) Cool down the temperature to 170 °F or lower at a rate of 4.5 ± 0.5 °F per minute
before removing the vacuum.
(5) Remove the bagged laminates from the autoclave and de-bag for inspection.
FIGURE 2-3: SPECIMEN SELECTION METHODOLOGY AND BATCH TRACEABILITY
PER ENVIRONMENTAL CONDITION AND TEST METHOD
Material Batch
Autoclave Load (Independent cure Process)
Panel Manufacturing Typical Number of Specimens (1) BATCH 1 LOAD “A” LOAD “B” PANEL “A1” PANEL “A2” PANEL “B1” PANEL “B2” 1 1 1 1 BATCH 2 LOAD “A” LOAD“B” PANEL “A1” PANEL “A2” PANEL “B1” PANEL “B2” 1 1 1 1 BATCH 3 LOAD “A” LOAD“B” PANEL “A1” PANEL “A2” PANEL “B1” PANEL “B2” 1 1 1 1
(1) 6 specimens for Tension, Compression Strength, In-plane Shear and Interlaminar Shear 2 specimens for Compression Modulus
2.1.5. Tabbing
Tabs were used to ensure the accuracy of the tensile and compressive strength specimens. Tabs were applied to the tension and compression strength specimens in accordance with Section 3.1.4 of the AGATE “ Material Qualification Methodology for Epoxy-Based Prepreg Composite Material System”, dated February 1999, with the following exceptions;
1.) AF 163-2 film adhesive used to bond the tabs to the test specimens described below was further cured by placing the test specimens in a temperature chamber at 180 °F for 24 hours. This was because the AF163 was not fully cured, initially, at 180°F for 5 hours. The 180°F cure temperature was selected because it was the maximum temperature allowed by the AGATE methodology, described in section 3.1.4, since the cure temperature of the P707AG-15 was 270 ± 10°F
a.) 0° (warp) & 90° (fill) tension specimens for testing at -65°F (Dry), 75°F (Dry), 180°F (Dry) and 180°F (Wet).
2.) Hysol EA9628 film adhesive used to bond the tabs to the specimens described below was cured up to 260 °F for up to 120 minutes.
a.) 0° (warp) & 90° (fill) compressive strength tested -65°F (Dry), 75°F (Dry), 180°F (Dry) and 180°F (Wet).
The same material or strain compatible material tabs as the test coupon were used for compressive strength specimens. Fiberglass tabs were used for tension specimens. To retard the absorption of moisture into the tabs and bond lines of the tension specimens tested at hot/wet condition, the tab section (including the edges) were masked with a room-temperature curing “Plasti Dip” rubber coating prior to humidity conditioning. The rubber coat was peeled off just before testing. The National Institute for Aviation Research (NIAR) of Wichita State University bonded the tabs and machined the 0° (warp) & 90° (fill) compressive strength specimens.
2.1.6. FAA Test Coupon Conformity and Test Witness
The material traceability and test specimen conformity were performed for the cured laminate mechanical test properties of the program. For the physical properties, material traceability was verified by TCA inspection section only.
2.1.6.1. Test Coupon Conformity
A conformity traveler accompanied each group of test specimens for cured lamina mechanical properties. The conformity traveler recorded the materials and process definition, completion and verification by inspection of each process, that included lay-up, cure cycle, tabbing and final coupon dimensions. Mr. Wing C. Chin, FAA Designated Airworthiness Representative (DAR) performed the test specimen conformity and reviewed the completeness of traveler conformity records. Finally, Mr. Wing C. Chin, FAA DAR prepared a statement of conformity, FAA 8130-3 tags
for all the test panels and test specimens, prior to environmental conditioning and testing of the test specimens. The conformity of all the test panels was performed November 15, 1999. However, additional test panels, specifically for compressive strength test, were fabricated and conformed on March 24, 2000 due to problems in the testing process, for example, tabbing and machining of specimens. The conformed additional test panels, for compressive strength test, were replacements for previously fabricated test panels. The conformity of all the test specimens was performed December 13, 1999. However, the additional compressive strength specimens were conformed April 14, 2000 and April 21, 2000, to replace the test specimen with “out-of-mode” failure, for example, tab failure due to adhesive failure and end broom failure.
2.1.6.2. Test Witness
Mr. Moto Ashizawa, FAA Designated Engineering Representative (DER) witnessed all the cured lamina mechanical test property testing of at least one batch of the prepreg material for the program. TCA personnel that were authorized to witness on behalf of Mr. Moto Ashizawa, FAA DER witnessed the rest of the tests. The test dates of the lamina mechanical test properties were described in the tables of test results.
2.2. Prepreg Documentation by Prepreg Lot
Prepreg Documentation
Prepreg Manufacturer & Product ID: Toray Composites F6273C-07MMaterial Identification (weave, form, class, etc.): Carbon/Epoxy Plain Weave Fabric Impregnation Method: Hot Melt
Prepreg Batch or Lot # AF991009 AF991010 AF991011
Batch (Lot) ID as labeled on samples 910-056 910-057 910-058
Date of Manufacture 10/20/1999 10/20/1999 10/20/1999
Expiration Date 10/20/2001 10/20/2001 10/20/2001
Resin Content [%] 41.5% 41.7% 41.4%
Reinforcement Areal Weight & Test Method
194 g/m2 SACMA SRM 23R-94 190 g/m2 SACMA SRM 23R-94 193 g/m2 SACMA SRM 23R-94 Resin Flow
& Test Conditions
23.5% @ 250°F 23.5% @ 250°F 23.5% @ 250°F Gel Time
& Test Conditions
8.0 minutes @ 250°F 7.9 minutes @ 250°F 9.0 minutes @ 250°F Volatile Content 0.13% 0.21% 0.18%
Reinforcement Documentation
Fiber Manufacturer & Product ID: Toray T700S-12K-50CFabric Manufacturer & Product ID: Sakai CK6273C Precursor Type: PAN
Nominal Filament Count: 12K Finish/Sizing Type and %: 50C (1.0%) Nominal tow or yarn count/inch: 3.05/inch Twist: Never twisted
Fabric Batch or Lot # 138043 138051 138051
Date of Manufacture 04/1998 05/1998 05/1998
Average Fiber Density per Lot & Test Method
Warp 1.78 g/cc Fill 1.80 g/cc TY-030B-02 Warp 1.78 g/cc Fill 1.78 g/cc TY-030B-02 Warp 1.78 g/cc Fill 1.78 g/cc TY-030B-02
Matrix Documentation
Resin Manufacturer & Product ID: Toray Composites #2510Matrix Batch or Lot # 3-CCH 3-CCG 2-BFC
Date of Manufacture 10/01/1999 10/01/1999 10/04/1999
Average Neat Resin Density by Lot & Test Method
1.267 ASTM D792 1.267 ASTM D792 1.266 ASTM D792
Prepreg Documentation
Prepreg Manufacturer & Product ID: Toray Composites F6273C-07MMaterial Identification (weave, form, class, etc.): Carbon/Epoxy Plain Weave Fabric Impregnation Method: Hot Melt
Prepreg Batch or Lot # AF020224 AF020324 AF020422 AF020522
Batch (Lot) ID as labeled on samples A-49, B-50 A-51, B-52 A-53, B-54 A-55, B-56
Date of Manufacture 02/21/2002 03/18/2002 04/19/2002 05/01/2002
Expiration Date 02/21/2004 03/18/2004 04/19/2002 05/01/2004
Resin Content [%] 40.8% 41.6% 41.3% 41.0%
Reinforcement Areal Weight & Test Method
193 g/m2 SACMA SRM 23R-94 191 g/m2 SACMA SRM 23R-94 191 g/m2 SACMA SRM 23R-94 193 g/m2 SACMA SRM 23R-94 Resin Flow
& Test Conditions
- - - -
Gel Time
& Test Conditions
9.6 minutes @ 250°F 12 minutes @ 250°F 10 minutes @ 250°F 13 minutes @ 250°F Volatile Content 0.06% 0.19% 0.16% 0.23%
Reinforcement
Documentation
Fiber Manufacturer & Product ID: Toray T700S-12K-50C
Fabric Manufacturer & Product ID: Sakai CK6273C Precursor Type: PAN
Nominal Filament Count: 12K Finish/Sizing Type and %: 50C (1.0%) Nominal tow or yarn count/inch: 3.05/inch Twist: Never twisted
Fiber Batch or Lot # 131121 132021 121031 121041
Date of Manufacture 12/2001 02/2002 03/2001 04/2001
Average Fiber Density per Lot & Test Method
Warp 1.80g/cc Fill 1.80 g/cc TY-030B-02 Warp 1.80g/cc Fill 1.80 g/cc TY-030B-02 Warp 1.80g/cc Fill 1.80 g/cc TY-030B-02 Warp 1.80g/cc Fill 1.80 g/cc TY-030B-02
Matrix Documentation
Resin Manufacturer & Product ID: Toray Composites #2510Matrix Batch or Lot # CMP, CNK,
2-COP 2-COQ, 2-CPF 2-CQW, 2-CQX 2-CRB, 2-CQY Date of Manufacture 12/29/2001, 01/19/2002, 02/19/2002 02/20/2002, 03/05/2002 04/14/2002, 04/15/2002 04/17/2002, 04/15/2002 Average Neat Resin Density by Lot
& Test Method
Notes: (1)Test methods to determine resin content, reinforcement areal weight, resin flow, gel time, and volatile content are defined in TORAY Material Specifications (see reference section). (2) These information and test results were submitted to NIAR by TORAY Composites (AMERICA), Inc.
2.3. Data Documentation
MATERIAL IDENTIFICATION
R material identification T700SC-12K-50C/#2510 Plain Weave Fabric R material class Carbon/Epoxy
PREPREG ANALYSIS
R ply manufacturer Toray Composites (America), Inc
R date of manufacture 10/1999, 02/2002, 03/2002, 04/2002, 05/2002 R material lot number AF991009, AF991010, AF991011, AF020224,
AF020324, AF020422, AF020522 R commercial designation F6273C-07M
R material form Plain Weave Fabric Prepreg R reinforcement areal weight 185 – 201 g/m2
reinforcement areal weight test method Solvent Extraction
R resin content 39 – 45 %
REINFORCEMENT ANALYSIS
F precursor type PAN
R commercial designation T700SC-12K-50C
R manufacturer Torayca
R date of manufacture (fabric) 05/1998, 07/1998, 03/2001, 04/2001, 12/2001, 02/2002 R date of manufacture (fiber) 01/1998, 03/1998, 11/2000, 12/2000, 03/2001, 06/2001 R lot number (fabric) 138043, 138051, 131121, 132021, 121031, 121041 R lot number (fiber) 818012, 818013, 818014, 818033, 811062, 811032,
810112, 810113, 810124 R surface treatment (Y/N) Y
R surface finish (sizing) identification 50C R density (Average per lot) 1.78 g/cm3
density test method JIS R 7601 R nominal filament count 12000/tow R nominal tow or yarn count/inch 3.0
R twist No Twist
R fiber areal weight (when applicable) 185 – 201 g/m2 fiber areal weight test method SRM 23 MATRIX MATERIAL ANALYSIS
R commercial designation #2510
R manufacturer Toray Composites (America), Inc
R date of manufacture 10/1999, 12/2001, 01/2002, 02/2002, 03/2002, 04/2002 R lot number (R – not prepregged, 3-CCH, 3-CCG, 2-BFC, 2-CMP, 2-CNK, 2-COP, 2-COQ,
F – prepregged) 2-CPF, 2-CQW, 2-CQX, 2-CRB, 2-CQY R nominal density and test method 1.267 g/cc
ASTM D792 PROCESSING INFORMATION
F part (panel) manufacturer Toray Composites (America), Inc R date of manufacture (date completed) original QT: 10/1999 – 3/2000 cure cycle (for each state) additional QT: 05/2002 R process stage type Cure Cycle
R process time 120 +10/-0 minutes R process temperature 270 ± 3 °F
R process pressure none
LAMINA ANALYSIS
R form (panel, tube, etc.) Panel
R ply count 12 – warp & fill tensile; 12 – warp & fill Comp strength; 14 – warp & fill comp modulus; 16 – IPS; 12 – ILSS
R lay-up code (warp)12 – warp tensile; (fill)12 – fill tensile;
(warp)12 – warp comp strength; (fill)12 – fill comp
strength; (warp)14 – warp comp modulus; (fill)14 –
fill comp modulus; (warp/fill)4S – IPS;
(warp)12 – ILSS
R fiber volume 49.6% Average
F void content 2.3% Average
density 1.501g/cc Average
R glass transition temperature (wet, nominal) 267°F R glass transition temperature (dry, nominal) 294°F R glass transition temperature test method DMA E’ SPECIMEN PREPARATION
R specimen orientation fill, warp, fill/warp F tab adhesive curing temperature (nominal) up to 260°F MECHANICAL TESTING
R number of specimens See data files
R test procedure ASTM D 3039 (Tensile), (citing all deviations from standard SACMA SRM 1 (Comp), procedures including reporting ASTM D 5379 (IPS), requirements) ASTM D 2344 (ILSS)
R date of applicable standard 1995(Ten), 1994(Comp), 1993(IPS), 1989(ILSS) R date of testing original QT: 12/1999 – 7/2000
additional QT: 05/2002 – 06/2002 R specimen thickness for each specimen nominal: 0.1032”(warp & fill tensile),
0.1032”(warp & fill comp strength), 0.1204” (warp & fill comp modulus), 0.1376” (IPS), 0.1032” (ILSS)
R specimen conditioning method DOT/FAA/AR-00/47 Section 3.2, Sept. 2000 R conditioning temperature 145 ± 5°F
R conditioning humidity 85 ± 5%
R conditioning time until saturation (10 to 16 weeks)
R conditioning environment (if not lab air) for fluid sensitivity: Jet Fuel, Hydraulic Fluid & MEK (IPS only)
R fastener type (if any) N/A R fastener torque-up conditions (if any) N/A
R test temperature -65 ± 5°F, 75 ± 5°F, 180 ± 5°F
F moisture content Dry : 0.2 - 0.5 % Wet : 1.4 - 2.0% R soak time at test conditions -65°F: 5 – 6 minutes 180°F: 2 – 3 minutes R failure mode identification and location Per specimen
R all non-normalized (raw) data Per specimen
R method of calculating modulus 1000 – 3000 microstrain (Tens) 1000 – 3000 microstrain (Comp) 2500 – 6500 microstrain (IPS) nominal ply thickness 0.0086 in.
nominal fiber density 1.78 g/cm3 nominal fiber areal weight 193 g/m2
R – Required for all data
F – Required for fully-approved data
3.1. Test Results 3.1.1. Summary
MATERIAL: T700SC-12K-50C/#2510 Plain Weave Fabric T700 PW/#2510
PREPREG: Toray Composites F6273C-07M Summary
FIBER: Toray T700S-12K-50C RESIN: Toray Composites #2510
Tg (dry): 146 °C Tg (wet): 131 °C Tg METHOD: DMA (SRM 18-94)
PROCESSING: Vacuum bag cure (minimum 560 mmHg): 132 ± 2 °C for 120 +10/-0 minutes
Date of fiber manufacture 01/1998 – 02/2002 Date of testing 12/1999 – 06/2002 Date of resin manufacture 10/1999 - 04/2002 Date of data submittal 04/2002 – 07/2002 Date of prepreg manufacture 10/1999 - 05/2002 Date of analysis 07/2002 – 09/2002 Date of composite manufacture 10/1999 – 05/2002
LAMINA MECHANICAL PROPERTY SUMMARY
Data Reported as: Measured (Normalized by CPT= 0.2184 mm)
CTD RTD ETD ETW
B-Basis Mean B-Basis Mean B-Basis Mean B-Basis Mean
F1 tu (MPa) 738.480 (737.897) 802.874 (803.236) 853.790 (847.726) 917.599 (912.052) 901.601 (896.912) 968.984 (964.970) 978.797 (975.143) 1051.949 (1049.137) E1 t (GPa) --- 0.057 (0.057) --- 0.056 (0.056) --- 0.056 (0.056) --- 0.058 (0.058) ν12 tu --- 0.085 --- 0.042 --- 0.037 --- 0.029 F2tu (MPa) 614.325 (616.820) 718.773 (722.602) 677.690 (673.994) 775.382 (771.977) 733.095 (727.913) 838.774 (833.734) 780.537 (779.024) 893.055 (892.276) E2 t (GPa) --- 0.056 (0.056) --- 0.055 (0.055) --- 0.054 (0.055) --- 0.054 (0.054) F1 cu (MPa) 621.925 (621.623) 747.203 (749.955) 605.822 (603.589) 708.869 (708.742) 571.291 (565.607) 668.465 (664.143) 404.168 (404.402) 472.915 (474.854) E1 c (GPa) --- 0.055 (0.055) --- 0.055 (0.056) --- 0.056 (0.056) --- 0.055 (0.055) F2cu (MPa) 654.992 (653.537) 744.535 (741.866) 629.671 (626.087) 702.974 (698.158) 581.719 (579.039) 649.439 (645.694) 529.870 (429.285) 479.913 (478.702) E2 c (GPa) --- 0.049 (0.048) --- 0.053 (0.054) --- 0.053 (0.053) --- 0.055 (0.055) F12 su (MPa) 144.345 154.888 124.746 132.570 99.938 106.206 70.168 74.569 G12s (GPa) --- 0.004 --- 0.004 --- 0.004 --- 0.003 F13su** (MPa) --- --- 55.317 59.935 --- --- --- ---
3.1.2.1. Tension, 1-axis
Material: Toray - TCA T700S-12K-50C/#2510 Plain Weave Fabric
Resin content: 39 - 45 wt% Comp. density: 1.48 - 1.52 g/cc
Fiber volume: 47 - 55 % Void content: 1.0 - 3.0 %
Ply thickness: 0.2113 - 0.2229 mm
Ply range: 12 plies
Test method: D3039-95 Modulus calculation: linear fit from 1000 - 3000µε
Normalized by: 0.2184 mm ply thickness
Test Temperature [°C] -53.89 23.89 82.22
Moisture Conditioning dry dry dry
Equilibrium at T, RH as fabricated as fabricated as fabricated
Source code
Normalized Measured Normalized Measured Normalized Measured Normalized Measured
Mean 803.236 802.874 912.052 917.599 964.970 968.984 1049.137 1051.949 Minimum 756.865 752.490 846.883 842.606 864.643 880.860 1003.433 1002.461 Maximum 848.175 843.194 994.092 998.737 1014.012 1015.816 1109.689 1106.526 C.V.(%) 4.672 4.720 4.394 4.596 4.567 4.241 3.046 2.938 F1 tu B-value 737.897 738.480 847.726 853.790 896.912 901.601 975.143 978.797 (MPa) A-value 701.302 702.415 805.025 811.431 851.733 856.870 926.023 930.236 No. Specimens No. Prepreg Lots
Mean 0.057 0.057 0.056 0.056 0.056 0.056 0.058 0.058 Minimum 0.055 0.055 0.054 0.054 0.053 0.053 0.053 0.054 Maximum 0.059 0.060 0.061 0.062 0.063 0.063 0.063 0.063 E1t C.V.(%) 3.298 3.514 3.265 3.553 4.481 4.463 4.606 4.288 (GPa) No. Specimens No. Prepreg Lots
Mean 0.085 0.042 0.037 0.029 ν t No. Specimens 18 3 12 82.22 equilibrium 62.78 °C, 85% 18 12 3 12 3 CTD RTD ETD ETW 3 6 1 4 4 1 12 3 18 3 12 12 Tension, 1-axis Gr/Ep TCA T700S-12K-50C/#2510 Plain Weave Fabric [0]12
3.1.2.2. Tension, 2-axis
Material: Toray - TCA T700S-12K-50C/#2510 Plain Weave Fabric
Resin content: 39 - 45 wt% Comp. density: 1.49 - 1.52 g/cc
Fiber volume: 47 - 54 % Void content: 1.3 - 3.7 %
Ply thickness: 0.2131 - 0.2210 mm
Ply range: 12 plies
Test method: D3039-95 Modulus calculation: linear fit from 1000 - 3000µε
Normalized by: 0.2184 mm ply thickness
Test Temperature [°C] -53.89 23.89 82.22
Moisture Conditioning dry dry dry
Equilibrium at T, RH as fabricated as fabricated as fabricated
Source code
Normalized Measured Normalized Measured Normalized Measured Normalized Measured
Mean 722.602 718.773 771.977 775.382 833.734 838.774 892.276 893.055 Minimum 696.157 688.155 688.601 687.602 722.975 728.125 752.772 759.543 Maximum 746.775 742.458 852.207 858.027 943.274 942.857 1008.063 1004.365 C.V.(%) 2.788 2.725 7.359 7.512 7.895 7.792 7.883 7.677 F2 tu B-value 616.820 614.325 673.994 677.690 727.913 733.095 779.024 780.537 (MPa) A-value 557.575 555.826 608.950 612.839 657.665 662.941 703.844 705.844 No. Specimens No. Prepreg Lots
Mean 0.056 0.056 0.055 0.055 0.054 0.055 0.054 0.054 Minimum 0.056 0.055 0.054 0.053 0.052 0.052 0.051 0.052 Maximum 0.057 0.057 0.056 0.056 0.056 0.057 0.058 0.057 E2t C.V.(%) 1.471 1.536 1.419 1.581 2.207 2.256 2.941 2.502 (GPa) No. Specimens No. Prepreg Lots
4 1 12 3 18 3 6 1 CTD RTD ETD ETW 3 18 3 12 3 3 12 82.22 equilibrium 62.78 °C, 85% 18 Tension, 2-axis Gr/Ep TCA T700S-12K-50C/#2510 Plain Weave Fabric [0]12
3.1.2.3. Compression, 1-axis
Material: Toray - TCA T700S-12K-50C/#2510 Plain Weave Fabric
Resin content: 39 - 45 wt% Comp. density: 1.49 - 1.51 g/cc
Fiber volume: 46 - 54 % Void content: 1.1 - 3.1 %
Ply thickness: 0.2132 - 0.2216 mm
Ply range: 12 - 14 plies
Test method: SRM 1-94 Modulus calculation: linear fit from 1000 - 3000µε
Normalized by: 0.2184 mm ply thickness
Test Temperature [°C] -53.89 23.89 82.22
Moisture Conditioning dry dry dry
Equilibrium at T, RH as fabricated as fabricated as fabricated
Source code
Normalized Measured Normalized Measured Normalized Measured Normalized Measured
Mean 749.955 747.203 708.742 708.869 664.143 668.465 474.854 472.915 Minimum 704.469 701.885 589.686 593.713 573.899 580.651 396.111 394.658 Maximum 848.082 844.971 780.970 782.660 765.078 774.079 539.716 531.983 C.V.(%) 6.862 6.862 8.151 7.966 8.753 8.759 9.502 9.126 F1 cu B-value 621.623 621.925 603.589 605.822 565.607 571.291 404.402 404.168 (MPa) A-value 549.748 551.760 533.785 537.415 500.195 506.784 357.633 358.531 No. Specimens No. Prepreg Lots
Mean 0.055 0.055 0.055 0.056 0.056 0.056 0.055 0.055 Minimum 0.054 0.054 0.051 0.052 0.054 0.054 0.051 0.051 Maximum 0.055 0.055 0.057 0.058 0.061 0.062 0.062 0.063 E1c C.V.(%) 1.527 1.527 3.391 3.932 4.715 5.436 7.418 7.863 (GPa) No. Specimens No. Prepreg Lots
6 82.22 equilibrium 62.78 °C, 85% 18 3 18 3 6 3 3 CTD RTD ETD ETW 18 3 6 1 2 1 6 3 Compression, 1-axis Gr/Ep TCA T700S-12K-50C/#2510 Plain Weave Fabric [0]12, [0]14
3.1.2.4. Compression, 2-axis
Material: Toray - TCA T700S-12K-50C/#2510 Plain Weave Fabric
Resin content: 39 - 45 wt% Comp. density: 1.48 - 1.51 g/cc
Fiber volume: 47 - 51 % Void content: 1.3 - 3.1 %
Ply thickness: 0.2159 - 0.2251 mm
Ply range: 12 - 14 plies
Test method: SRM 1-94 Modulus calculation: linear fit from 1000 - 3000µε
Normalized by: 0.2184 mm ply thickness
Test Temperature [°C] -53.89 23.89 82.22
Moisture Conditioning dry dry dry
Equilibrium at T, RH as fabricated as fabricated as fabricated
Source code
Normalized Measured Normalized Measured Normalized Measured Normalized Measured
Mean 741.866 744.535 698.158 702.974 645.694 649.439 478.702 479.913 Minimum 634.596 636.880 640.837 638.979 555.232 556.310 433.678 435.238 Maximum 828.187 831.167 765.583 774.590 703.056 707.857 519.773 523.323 C.V.(%) 9.888 9.888 5.168 5.261 6.108 6.175 5.185 5.249 F2 cu B-value 653.537 654.992 626.087 629.671 579.039 581.719 429.285 429.870 (MPa) A-value 604.067 604.841 578.243 581.010 534.790 536.764 396.481 396.650 No. Specimens No. Prepreg Lots
Mean 0.049 0.048 0.053 0.054 0.053 0.053 0.055 0.055 Minimum 0.048 0.048 0.051 0.051 0.051 0.052 0.049 0.049 Maximum 0.049 0.049 0.056 0.057 0.056 0.056 0.058 0.059 E2c C.V.(%) 1.260 2.192 3.831 3.915 2.845 2.984 5.588 5.798 (MPa) No. Specimens No. Prepreg Lots
2 1 6 3 18 3 6 1 CTD RTD ETD ETW 3 18 3 6 3 3 6 82.22 equilibrium 62.78 °C, 85% 18 Compression, 2-axis Gr/Ep TCA T700S-12K-50C/#2510 Plain Weave Fabric [0]12, [0]14
3.1.2.5. Shear, 12 axis
Material: Toray - TCA T700S-12K-50C/#2510 Plain Weave Fabric
Resin content: 39 - 45 wt% Comp. density: 1.48 - 1.51 g/cc
Fiber volume: 47 - 51 % Void content: 1.7 - 2.9 %
Ply thickness: 0.2142 - .2214 mm
Ply range: 16 plies
Test method: D5379-93 Modulus calculation: linear fit from 1000 - 6000µε
Normalized by: N/A
Test Temperature [°C] -53.89 23.89 82.22
Moisture Conditioning dry dry dry
Equilibrium at T, RH as fabricated as fabricated as fabricated
Source code
Normalized Measured Normalized Measured Normalized Measured Normalized Measured
Mean 154.888 132.570 106.206 74.569 Minimum 140.140 119.133 99.529 68.150 Maximum 164.811 139.524 110.741 77.954 C.V.(%) 5.806 3.676 2.735 2.865 F12 su B-value 144.345 124.746 99.938 70.168 (MPa) A-value 138.440 119.552 95.777 67.247 No. Specimens No. Prepreg Lots
Mean 0.004 0.004 0.004 0.003 Minimum 0.004 0.004 0.003 0.003 Maximum 0.005 0.005 0.004 0.004 G12s C.V.(%) 10.252 5.266 4.995 7.029 (GPa) No. Specimens No. Prepreg Lots
12 82.22 equilibrium 62.78 °C, 85% 18 3 18 3 12 3 3 CTD RTD ETD ETW 18 3 6 1 4 1 12 3 Shear, 12-axis Gr/Ep TCA T700S-12K-50C/#2510 Plain Weave Fabric [0/90]4s
3.1.2.6. Shear, 13 axis
NOTES: These values represent the apparent interlaminar shear properties and are to be used for quality control purposes only. Do not use these values for interlaminar shear strength design values.
Material: Toray - TCA T700S-12K-50C/#2510 Plain Weave Fabric
Resin content: 39 - 45 wt% Comp. density: 1.45 - 1.55 g/cc
Fiber volume: 47 - 54% Void content: 0.4 - 3.0 %
Ply thickness: 0.1976 - .2210 mm
Ply range: 12 plies
Test method: D2344-89 Modulus calculation: linear fit from 1000 - 6000µε
Normalized by: N/A
Test Temperature [°C] -53.89 23.89 82.22
Moisture Conditioning dry dry dry
Equilibrium at T, RH as fabricated as fabricated as fabricated
Source code
Normalized Measured Normalized Measured Normalized Measured Normalized Measured
Mean 59.935 Minimum 52.403 Maximum 68.707 C.V.(%) 5.213 F13su B-value 55.317 (MPa) A-value 51.771 No. Specimens No. Prepreg Lots
149 7 CTD RTD ETD ETW 82.22 equilibrium 62.78 °C, 85% Shear, 13-axis Gr/Ep TCA T700S-12K-50C/#2510 Plain Weave Fabric [0]12
3.1.3.1. Tension, 1-axis
NOTE: The symbols represent the ‘pooled’ average of all tests, and the bars represent the upper and lower limit of the data. The 180° dry and wet data has been staggered for clarity
0° Tension -- Normalized Strength
TCA T700S-12K-50C/#2510 Plain Weave Fabric0 200 400 600 800 1000 1200 -100 -50 0 50 100 Temperature (°C) Strength (MPa) Conditioning X Dry O Wet
3.1.3.2. Tension, 2-axis
NOTE: The symbols represent the ‘pooled’ average of all tests, and the bars represent the upper and lower limit of the data. The 180° dry and wet data has been staggered for clarity.
90° Tension -- Normalized Strength
TCA T700S-12K-50C/#2510 Plain Weave Fabric
0 200 400 600 800 1000 1200 -100 -50 0 50 100 Temperature (°C) Strength (MPa) Conditioning X Dry O Wet
3.1.3.3. Compression, 1-axis
NOTE: The symbols represent the ‘pooled’ average of all tests, and the bars represent the upper and lower limit of the data. The 180° dry and wet data has been staggered for clarity.
0° Compression -- Normalized Strength
TCA T700S-12K-50C/#2510 Plain Weave Fabric0 200 400 600 800 1000 -100 -50 0 50 100 Temperature (°C) Strength (MPa) Conditioning X Dry O Wet
3.1.3.4. Compression, 2-axis
NOTE: The symbols represent the ‘pooled’ average of all tests, and the bars represent the upper and lower limit of the data. The 180° dry and wet data has been staggered for clarity.
90° Compression -- Normalized Strength
TCA T700S-12K-50C/#2510 Plain Weave Fabric
0 200 400 600 800 1000 -100 -50 0 50 100 Temperature (°C) Strength (MPa) Conditioning X Dry O Wet
3.1.3.5. Shear, 12 axis
NOTE: The symbols represent the ‘pooled’ average of all tests, and the bars represent the upper and lower limit of the data. The 180° dry and wet data has been staggered for clarity
In-Plane Shear -- Measured Strength
TCA T700S-12K-50C/#2510 Plain Weave Fabric0 25 50 75 100 125 150 175 -100 -50 0 50 100 Temperature (°C) Strength (MPa) C o n d i t i o n i n g X Dry O Wet
3.1.3.6. Shear, 13 axis
NOTE: The symbols represent the ‘pooled’ average of all tests, and the bars represent the upper and lower limit of the data. The 180° dry and wet data has been staggered for clarity.
Apparent Interlaminar Shear -- Measured Strength
TCA T700S-12K-50C/#2510 Plain Weave Fabric
0 20 40 60 80 -100 -50 0 50 100 Temperature (°C) Strength (MPa) Conditioning X Dry
3.2. Raw Data
Specimen Naming Convention
Test coupons were identified using a ten-digit specimen code, with the significance of each digit delineated below. A representative sample ID is shown for reference purposes.
A1 – 910-041 – 1-3
0° Tension
1st Character: Independent Cure Cycle ‘A’ designates a cure cycle that was independently cured from ‘B’ cure cycle 2nd Character: Panel Number
Numeric order of the panel fabricated for each cure cycle
3rd ~ 8th Character: Master Roll Number Prepreg Master Roll number used to fabricate the panel
9th ~ 10th Character: Sample Number The samples cut from each panel, increasing numerically.
Panel Type ID
Panels/specimens were also identified with the test type
normalizing tply
[mm]
0.2184
Specimen Cure Prepreg ASAP Strength Modulus Poisson's Avg. Specimen # Plies in Avg. tply Strengthnorm Modulusnorm
Number Cycle Lot # Batch # [MPa] [GPa] Ratio Thickn. [mm] Laminate [mm] [MPa] [GPa]
A1-910-056-1-1 A 1 1 931.083 0.055 0.025 2.608 12 0.21734 926.392 0.054 A2-910-056-1-1 A 1 1 854.083 0.055 0.015 2.599 12 0.21660 846.883 0.055 A1-910-056-1-6 A 1 1 998.737 2.609 12 0.21742 994.092 B1-910-056-1-1 B 1 2 901.475 0.054 0.020 2.623 12 0.21861 902.174 0.054 B2-910-056-1-1 B 1 2 931.011 0.057 0.040 2.536 12 0.21135 900.790 0.055 B1-910-056-1-6 B 1 2 842.606 2.670 12 0.22253 858.364 A1-910-057-1-1 A 2 3 925.146 0.057 0.025 2.604 12 0.21700 919.050 0.056 A2-910-057-1-1 A 2 3 949.049 0.056 0.040 2.604 12 0.21700 942.795 0.056 A1-910-057-1-6 A 2 3 906.782 2.614 12 0.21785 904.322 B1-910-057-1-1 B 2 4 943.333 0.057 0.045 2.607 12 0.21721 938.031 0.057 B2-910-057-1-1 B 2 4 892.232 0.056 0.025 2.623 12 0.21855 892.664 0.056 B1-910-057-1-6 B 2 4 881.665 2.604 12 0.21696 875.685 A1-910-058-1-7 A 3 5 950.632 0.054 0.050 2.608 12 0.21734 945.842 0.054 A2-910-058-1-7 A 3 5 939.799 0.057 0.135 2.602 12 0.21681 932.787 0.057 A1-910-058-1-6 A 3 5 943.037 2.618 12 0.21816 941.849 B1-910-058-1-7 B 3 6 977.498 0.056 0.045 2.584 12 0.21531 963.479 0.055 B2-910-058-1-7 B 3 6 869.287 0.062 0.035 2.579 12 0.21495 855.388 0.061 B1-910-058-1-6 B 3 6 879.324 2.612 12 0.21770 876.342
Average 917.599 0.056 0.042 Averagenorm 0.21715 912.052 0.056
Standard Dev. 42.177 0.002 0.031 Standard Dev.norm 40.079 0.002
Coeff. of Var. [%] 4.596 3.553 75.433 Coeff. of Var. [%]norm 4.394 3.265
Min. 842.606 0.054 0.015 Min. 0.2113 846.883 0.054
Max. 998.737 0.062 0.135 Max. 0.2225 994.092 0.061
Number of Spec. 18 12 12 Number of Spec. 18 12
0° Tension -- (RTD) Strength & Modulus
0 1 2 3 4 5 6 0 200 400 600 800 1000 1200 1400 1600 1800
0° Tensile Strength [MPa]
ASAP Batch # 0 1 2 3 Prepeg Lot # ASAP Batch # Prepreg Lot # 0° Tension -- (RTD) Normalized Strength TCA T700S-12K-50C/#2510 Plain Weave Fabric
Pooled Average = 912.052 [MPa] Pooled Standard Deviation = 40.079 [MPa]
Pooled Coeff. of Variation = 4.394 [%]
0 1 2 3 4 5 6 0.000 0.020 0.040 0.060 0.080 0.100 0.120
0° Tensile Modulus [GPa]
ASAP Batch # 0 1 2 3 Prepreg Lot # ASAP Batch # Prepreg Lot # 0° Tension -- (RTD) Normalized Modulus TCA T700S-12K-50C/#2510 Plain Weave Fabric
Pooled Average = 0.056 [GPa] Pooled Standard Deviation = 0.002 [GPa]