Modeling and debiasing resource saving judgments
Ola Svenson
∗ †Nichel Gonzalez
†Gabriella Eriksson
† ‡Abstract
Svenson (2011) showed that choices of one of two alternative productivity increases to save production resources (e.g., man-months) were biased. Judgments of resource savings following a speed increase from a low production speed line were underestimated and following an increase of a high production speed line overestimated. The objective formula for computing savings includes differences between inverse speeds and this is intuitively very problematic for most people. The purpose of the present studies was to explore ways of ameliorating or eliminating the bias. Study 1 was a control study asking participants to increase the production speed of one production line to save the same amount of production resources (man-months) as was saved by a speed increase in a reference line. The increases judged to match the reference alternatives showed the same bias as in the earlier research on choices. In Study 2 the same task and problems were used as in Study 1, but the participants were asked first to judge the resource saving of the reference alternative in a pair of alternatives before they proceeded to the matching task. This weakened the average bias only slightly. In Study 3, the participants were asked to judge the resources saved from each of two successive increases of the same single production line (other than those of the matching task) before they continued to the matching problems. In this way a participant could realize that a second production speed increase from a higher speed (e.g., from 40 to 60 items /man-month) gives less resource savings than the same speed increase from a first lower speed (e.g., from 20 to 40 items/man-month. Following this, the judgments of the same problems as in the other studies improved and the bias decreased significantly but it did not disappear. To be able to make optimal decisions about productivity increases, people need information about the bias and/or reformulations of the problems.
Keywords: resource savings, time-saving bias, efficiency, heuristics, debiasing.
1
Introduction
Assume that you are a manager who runs a company with two production lines, A and B each of which should pro-duce 1200 units of a product. Line A propro-duces 30 and line B 70 units per man-hour. To save man-hours and money you have an opportunity to invest in one of these lines. The increase in production speed you get for the same in-vestment is for line A from 30 to 40, and for B from 70 to 110 units produced per man-hour. Where would you allo-cate your investment? In an earlier study Svenson (2011) had participants solve such problems with an instruction including the following:
We want you to give spontaneous judgments concerning which of two productivity improve-ments will give most time-saving, line A or line B. The two lines produce the same quantities of the same product but at different lines. Your task is to choose the alternative, which after a
Copyright: © 2014. The authors license this article under the terms of the Creative Commons Attribution 3.0 License.
∗Decision Research, Eugene, Oregon 97 401 USA.
†Risk Analysis, Social and Decision Research Unit, Department of
Psychology, Stockholm University, S-106 91 Stockholm Sweden.
‡Swedish National Road and Transport Institute, Linköping, Sweden.
productivity improvement will give most time-saving in man-hours compared to the situation before the production improvement.
Line A Line B Original productivity 30 units/man-hour Original productivity 70 units/man-hour Increased productivity 40 units/man-hour Increased productivity 110 units/man-hour
Line A Line B Equal
(circle appropriate alternative)
Most people intuitively think that line B saves most man-hours. Not only the differences between the speed increases (10 units/man-hour faster for A and 40 for B) speaks for B but also the ratios (40/30 and 110/70) fa-vor B. In fact, A saves more man-hours than B. We use this example to illustrate a correct algebraic solution of the problem. Assume that 1200 units are produced. Then, it takes line A 1200/30 (=40) man-hours to produce that quantity and 1200/40 (= 30) man-hours after the efficiency increase. Line B started with 1200/70 (=17.14) man-hours and after the improvement 1200/110 (=10.91) man-hours. Thus, the saving was 10 man-hours for line A and 6.23 man-hours for line B.
In general, unaided judgments of time and resources saved by increasing speed are prone to the time-saving 465
bias (Svenson, 1970, 2008, 2011), which is illustrated by this example. The bias means that, when speed is in-creased from a low speed, judgments of savings are under-estimated and when speed is increased from a high speed, they are overestimated.
Brown and Gobeli defined productivity as “measured as a ratio of the unit’s outputs to inputs for a given period of time” (Brown & Gobeli, 1992, p. 325) and, even, if there are many formal measurement systems, unaided intuitive first impression judgments of productivity and productiv-ity changes are important for preliminary and later final decisions (Svenson, 2003). In the present contribution, we study judgments of resource savings after an increase in efficiency or productivity as a prototype for judgments of time/resource savings in general and how they can be de-biased. Such judgments have been found to be systemat-ically biased in other areas (Eriksson et al., 2013; Fuller et al., 2009; Larrick & Soll, 2008; Peer & Gamliel, 2012; Svenson, 1970, 2008) and the purpose of the present con-tribution is to validate the results from earlier production choice experiments (Svenson, 2011) in studies of judg-ments and to find ways of avoiding the time-saving bias.
The objective mathematical function relating increase of production speed to resources saved (Svenson, 2011) is the same also in other areas, such as, time saved by driving faster and fuel saved by using a more fuel efficient car (more miles per gallon) (Larrick & Soll, 2008; Svenson, 1970, 2008). Therefore, we assumed that human judges will be prone to make the same kind of judgment biases in all of these contexts and that a learning technique that is successful in debiasing judgments in one context will prove efficient also in other contexts.
The early study of the time-saving bias and how it could be avoided, Svenson (1971) used direct quick feedback of correct answers without explanation or time for insight or explicit reasoning. His participants were given train-ing sessions of 2.5 hours per day durtrain-ing a week. The problems in a training session consisted of 1.5 hours of training with feedback in terms of a correct solution to each of a series of time-saving problems. Tests of learn-ing were conducted before and after each learnlearn-ing ses-sion giving a total of 10 test phases. This way of learn-ing to avoid the bias was extremely slow. It could be seen as based on exemplar learning (problem-response associations) coupled with quick non-conscious implicit similarity judgments giving the responses. In the present contribution, this “similar to exemplars strategy” will be classified as System 1 learning and it will be contrasted with System 2 learning that uses conscious mental pro-cesses. This simple two system approach classification of the processes leading to a judgment has been used by several researchers in the past (Epstein, 1994, Chaiken & Trope, 1999). Experiential System 1 processes are seen as holistic, associationistic, fast and sometimes affective and
the system is not open to conscious awareness (Epstein, 1994), while operations in System 2 use logical connec-tions and conscious reasons to reach a judgment (Slovic, Finucane, Peters, & MacGregor, 2002; Kahneman, 2003). Even though the System 1 and System 2 dichotomy is im-precise and applies only approximately in the present con-text, we will refer to it when we contrast different ways of debiasing time/resource-saving judgments.1 Because the earlier study by Svenson (1971) with an exemplar-based System 1 approach was not so successful, we selected an approach to learning that requires less learning time and invites deliberate conscious controlled reasoning and in-creased insights into how comparisons of resource saving options can be made without systematic biases. Studies of such processes motivate the use of verbal protocols, that can reflect conscious System 2 processes and complement regular analyses of choices or numerical responses.
When a judge encounters a numerical judgment prob-lem, there seems to be a hierarchy of rules in at least partly controlled cognition with a linear rule attempted first, as emphasized in an early paper by Brehmer, Ha-gafors and Johansson (1980) and later reported by several other authors (e.g., Dutt, & Gonzalez, 2013). If the linear rule is found unsatisfactory, curvilinear rules are attempted with more or less success (Ebersbach Lehner, Resing & Wilkening, 2008; Brehmer 1971, Wagenaar, 1975, Cronin et al., 2009). If there is more than one informa-tion variable, additive relainforma-tionships are implemented first ( Brehmer 1971) and, if found unsuccessful, judgments of ratios and proportions may be attempted (Resnick & Singer, 1993). In the present study we focused on the use of linear and proportional rules that were used in solutions of resource saving problems.
The earlier study by Svenson (2011) showed that the time/resource saving bias distorted choices between pro-ductivity increase options in line with the time-saving bias (Svenson, 1970, 2008). In the present contribution, we assumed that this choice bias would also appear in judg-ments of resource savings, that it is reflected in verbal re-ports (System 2) and numerical answers (both System 1 and System 2) and that it could be counteracted in learning sessions inviting System 2 learning processes. Because the resource saving bias found for choices was replicated
1The dichotomy has been criticized (Keren & Schul, 2009;
Kruglan-ski & Gigerenzer, 2011) on different grounds, e.g., the difficulty of find-ing criteria for a clear separation of the two systems. Accordfind-ing to Evans (2008, p. 255), a number of authors have suggested that there may be two architecturally (and evolutionarily) distinct cognitive systems underlying dual-process models. “However, it emerges that (a) there are multiple kinds of implicit processes described by different theorists and (b) not all of the proposed attributes of the two kinds of processing can be sensibly mapped on to two systems as currently conceived. It is suggested that while some dual-process theories are concerned with parallel competing processes involving explicit and implicit knowledge systems, others are concerned with the influence of preconscious processes that contextual-ize and shape deliberative reasoning and decision-making.”
in the matching judgment task of the first study, we con-tinued with two more studies with new participants drawn from the same population as the first set of participants. In these two additional studies, we investigated how the bias could be neutralized or eliminated by two different instructions and reformulations of the problems.
1.1
Model
In general terms, the man-hour gain,Gfrom an improve-ment of a production line A or B is
U P1 −
U P2
=G, (1)
where U is the number of units to be produced, P1 and
P2are the production speeds in units/man-hour before and
after an improvement for a production line. Here, partic-ipants are asked to match two different productivity in-creases, for production lines A and B, so that they save equal amounts of resources, by choosing the increased speed of B that is needed to achieve this end. Here,PA1
is the initial production speed of A andPA2the increased
speed of A, and likewise forPB1 andPB2, which is in
bold font to indicate that it is to be judged by the partici-pant.
Based on earlier research (Svenson, 2008), participants are assumed to follow the heuristic described by Equation (2), PA2−PA1 PA2 = PB2−PB1 PB2 . (2)
This means that when the ratio between the speed increase and the higher speed is the same for two alternatives they are judged to save equal amounts of resources. Equation (2) can be reformulated as1−PA1/PA2= 1−PB1/PB2,
orPB1/PB2=PA1/PA2, and we call this theratio rule.
The correct equation is.
PA2−PA1
PA1PA2
= PB2−PB1 PB1PB2
(3) Note, that the difference between Equations (2) and (3) lies in the fact that people are unable to adjust for both
PA1andPB1in the denominators. The mathematics
lead-ing from Equation (1) to equation (3) can be found in the appendix.
Peer and Gamliel (2013) found, in their studies, that the denominators in Equation (2), in another context, were
PA1andPB1instead ofPA2andPB2. We do not know
yet when the initial or increased speed is used in the de-nominator or what characteristics of people or problems that favor the use of one or the other factor. However, in the present study with matching tasks it does not matter which speed is used in the denominator of Equation (2). We hypothesized that, in the context of productivity in-crease judgments, participants would also use Equation (2)
when asked to make two productivity increase gains equal. We used units/man-month instead of units/man-hour in the present studies as the productivity measure because it fits our judgment problems better than man-hour and the above equations apply to any production speed measure.
In the first study, we tested the hypothesis predict-ing that the time-savpredict-ing bias should be replicated in the resource saving judgments following a productivity in-crease. We also wanted to identify specific judgment rules that participants used. In the second study, we tested the hypothesis that explicit intuitive judgments of man-months saved in a comparison alternative should improve matching judgments of resource savings and decrease the resource saving bias. In the third study, we asked partici-pants to give two resource saving judgments concerning a single production line, improved in two successive steps. We tested the hypothesis that such judgments improve the participants’ judgments and decrease the resource saving bias.
2
General method
2.1
Participants
The participants were recruited from the same population of university students, psychology students at Stockholm university, for each of the three studies. In Study 1, 29 participants took part in the experiment (mean age 25.0) of whom 21 were female. Study 2, included 31 partici-pants (mean age 25.6 years) of whom 24 were female and in Study 3 there were 31 participants (mean age 27.1) of whom 21 were female.2 The participants received either a movie ticket voucher or a psychology course credit for their participation. No participant was in more than one study.
2The time-saving bias was investigated earlier in driving contexts and
was found to be quite strong. To illustrate, Svenson (2009, Table 2) in-vestigated matching a speed increase from 60 to 110 km/h with a speed increase from 30 km/h, which gave an average judgment of 66 km/h (SD=30.6). The correct speed is 40 km/h which gives an effect size of 0.85 SD. This means that for p = 0.05, 0.01, and 0.001 a minimum of 17, 24 and 32 participants would be needed to detect the phenomenon with a power of 0.90 at these significance levels. In Study 1 we investigated 29 participants and found significance for all problems (9 problems with p<0.001 and 1 problem with p<0.01). However, in the present investiga-tion we were interested not only in detecting the phenomenon but also in detecting differences in the strength of the phenomenon in Studies 2 and 3. We used the average absolute proportional difference between judg-ments and correct values and the standard deviations for all problems as shown in Table 1. The average absolute proportional difference was 0.51 and we decided that we wanted to detect at least an improvement down to 0.35 deviation from the correct value (0.00 assuming no random error). With 29 participants in Study 1 the power to detect this change between Study 1 and Study 2 and 3 would be 0.874 with 30 participants in each of the other studies assuming constant standard deviations and alpha = 0.05.
2.2
Procedure
The participants completed the questionnaires with the problems in a classroom and were informed that they could take the time they wanted to make their intuitive judgments and solve the problems. The participants used about 15 to 25 minutes to complete the judgments in each study. External decision aids like pens and calculators were not allowed in any of the studies. The order of the problems was counter balanced between participants in each study. The problems, materials and results will be presented separately below for each of the studies.
3
Study 1: Matching two resource
improvement options
Based on earlier studies of choice behavior and the time-saving bias (Svenson, 2008, 2010), we predicted that matching judgments should be greater than objectively re-quired when a lower speed was increased to match an crease of a greater speed. When a higher speed was in-creased to match a change in lower speeds we predicted that the judgments would be too small according to the time-saving bias.
3.1
Material and problems
The questionnaire consisted of 10 problems. Each prob-lem consisted of two production lines, each of which pro-duced 1000 units of a product. The first production line (Line A) had undergone an improvement that saved a cer-tain amount of man-months. For this line, the participant was given the production speed before and after improve-ment. For the second production line (Line B), the partic-ipant was given only the production speedbeforethe im-provement, and an empty space for the participant’s judg-ment. The participant’s task was to judge the increased production rate for line B, which after the improvement would save the same amount of man-months as for Line A when 1000 units were produced (number of units are not important as long as they are not too few as shown in appendix). The following is an example from the ques-tionnaire.
Line A: before improvement 40 units/man-month, after improvement60units/man-month, Line B: before improvement 80 units/man-month, after improvement _______units/man-months.
The participants wrote their judgments in the blank space. At the end of the instruction the participant was informed that the number of units that were produced has no effect on the solutions of the problems. On the last
page of the questionnaire, the participants were asked to describe their thoughts while making their judgments.
Table 1 shows the problems and that there were 6 prob-lems (cases, 2,4,6,7,8,9) in which the matching speed was to be increased from a lower speed and 4 problems (cases 1,3,5,10) in which the increase was from a higher speed. As stated above, the time-saving bias predicts that the for-mer cases should give overestimations of correct produc-tion speed and the latter underestimaproduc-tions of the speeds needed to match the comparison increase.
3.2
Results
3.2.1 Qualitative measures
No participant was excluded because of judgment out-liers or other deviant judgments. The descriptions of how the participants solved the problems were transcribed and then coded independently by two coders. After an initial screening of the solution strategies, the verbal protocols were coded in one and only one of the following cate-gories, (1) ratio rule, (2) difference rule or (3) other rule. The ratio rule was described by Equation (2) and the dif-ference rule by the following equation with the judged in-creased matching speed in bold.
PB2−PB1=PA2−PA1 (4)
The inter coder agreement between the two coders was 23/29 (79.31%) for the participants’ descriptions of how they solved the problems with Kappa = .681,p<.001. The final codings were determined jointly by the two coders and they found that 12 participants reported a ratio rule as their main rule, while 10 of the remaining participants stated that they used a difference rule. The remaining 7 participants did not indicate any of these rules and were classified in the “other rule” category.
3.2.2 Quantitative measures
First, the mean values of the judgments for each problem were compared with the objectively correct values with two-tailed one-sample t-tests. The mean judgments were significantly different from the objectively correct speeds for all problems (Table 1). As predicted, when the ini-tial production speed was lower for line A than for line B, the judged matching increase of B’s production speed was too low. When the initial production speed was higher for line A than for line B, the judged matching production speed was too high. The results show underestimations of the effects on savings in man-months of increasing pro-duction rates from 40 units/man-month or less. When the initial productivity was 70 units/man-month or higher, the effects of increases on man-month gains were overesti-mated. This corroborated earlier findings of time-saving studies (Svenson, 2008).
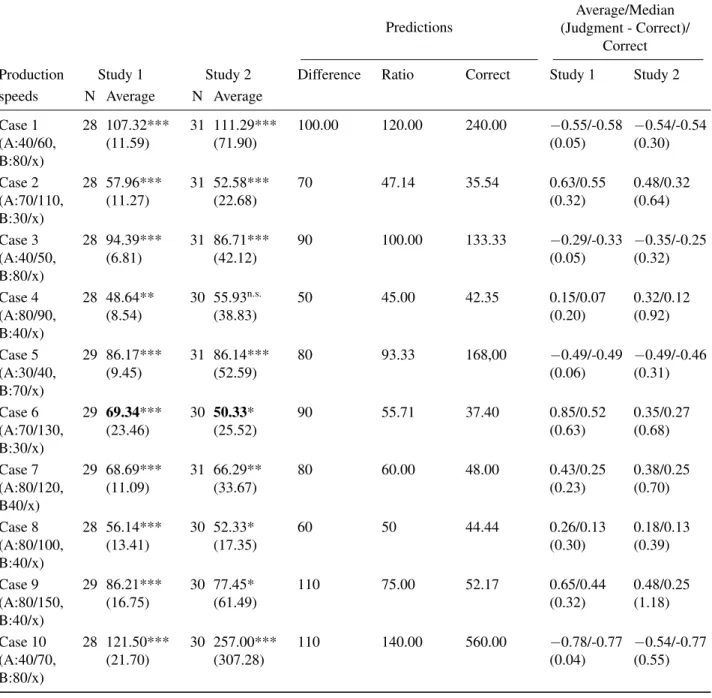
Table 1: Average judged production speeds, difference rule predictions, ratio rule predictions, correct solutions and proportional deviations from correct solutions in Study 1 and Study 2. Standard deviations in parentheses.
Predictions
Average/Median (Judgment - Correct)/
Correct Production Study 1 Study 2 Difference Ratio Correct Study 1 Study 2 speeds N Average N Average
Case 1 (A:40/60, B:80/x) 28 107.32*** (11.59) 31 111.29*** (71.90) 100.00 120.00 240.00 −0.55/-0.58 (0.05) −0.54/-0.54 (0.30) Case 2 (A:70/110, B:30/x) 28 57.96*** (11.27) 31 52.58*** (22.68) 70 47.14 35.54 0.63/0.55 (0.32) 0.48/0.32 (0.64) Case 3 (A:40/50, B:80/x) 28 94.39*** (6.81) 31 86.71*** (42.12) 90 100.00 133.33 −0.29/-0.33 (0.05) −0.35/-0.25 (0.32) Case 4 (A:80/90, B:40/x) 28 48.64** (8.54) 30 55.93n.s. (38.83) 50 45.00 42.35 0.15/0.07 (0.20) 0.32/0.12 (0.92) Case 5 (A:30/40, B:70/x) 29 86.17*** (9.45) 31 86.14*** (52.59) 80 93.33 168,00 −0.49/-0.49 (0.06) −0.49/-0.46 (0.31) Case 6 (A:70/130, B:30/x) 29 69.34*** (23.46) 30 50.33* (25.52) 90 55.71 37.40 0.85/0.52 (0.63) 0.35/0.27 (0.68) Case 7 (A:80/120, B40/x) 29 68.69*** (11.09) 31 66.29** (33.67) 80 60.00 48.00 0.43/0.25 (0.23) 0.38/0.25 (0.70) Case 8 (A:80/100, B:40/x) 28 56.14*** (13.41) 30 52.33* (17.35) 60 50 44.44 0.26/0.13 (0.30) 0.18/0.13 (0.39) Case 9 (A:80/150, B:40/x) 29 86.21*** (16.75) 30 77.45* (61.49) 110 75.00 52.17 0.65/0.44 (0.32) 0.48/0.25 (1.18) Case 10 (A:40/70, B:80/x) 28 121.50*** (21.70) 30 257.00*** (307.28) 110 140.00 560.00 −0.78/-0.77 (0.04) −0.54/-0.77 (0.55) Note: * = p<.05 , ** = p<.01, *** = p<.001, one sample t-test for difference between judgment averages and objectively correct answers. Standard deviations in parentheses. Bold digits indicate significant improvements from Study 1 to Study 2, two-tailed t-tests independent samples, p<0.01 (case 6) and p<0.05 (case 10).
The next to the last column in Table 1 shows the average and median proportional deviations from the correct value for each case in Study 1,(judgment - correct value) /cor-rect value. On average the deviations were about +50% when Line B started at a lower speed and about −50%
when Line B started at a higher speed. We used regres-sion analysis to find out how well the difference and ratio
rules could predict the judgments. The resource saving values predicted from the difference and ratio rules were the two independent variables for each case and the aver-age judgment across participants was the dependent vari-able, J. The fitted function was J = 0.38·diff + 0.54·ratio
+ 7.89 (F(2,7) = 5699.5, p<0.001). This shows that both rules were reasonable predictors of the judgments on the
average group level and that the ratio rule seemed to give the overall better predictions.
3.2.3 Quantitative and qualitative analysis
We have verbal reports about the rule used by different participants. If these reports are valid, it should be pos-sible to validate the verbal reports in numerical analyses of the judgments (Schulte-Mecklenbeck et al., 2011). As-suming that the 12 participants who reported that they used the ratio rule also did so, this means that if this subgroup is analyzed separately the ratio rule should predict their judg-ments to a greater extent than when all participants were analyzed. The corresponding holds for the 10 participants who reported using the difference rule.
First, we analyzed the data from the 12 participants in the ratio group. We computed the average for each case and used regression analysis and partial correlations in the same way as for the averages across all participants in the previous section. The regression function J =−0.04·diff +
0.99·ratio + 3.81 (F=(2,7) = 7493.0, p<0.001). This
analy-sis was repeated with the 10 participants in the difference group. The resulting regression function was J = 0.83·diff
+ 0.10·ratio + 4.59 (F(2,7)= 798.1, p < 0.001). These
re-sults verified the validity of the verbal reports.
We wanted to go deeper into the analysis on the individ-ual level and computed partial correlations between judg-ments and the ratio rule predictions with the difference variable controlled for each participant. Correspondingly, we computed partial correlations between judgments and the difference variable with the ratio variable controlled. The results with the classifications of the verbal reports are shown in Table A in the Appendix. Of the 12 partic-ipants who reported the ratio rule all 12 gave judgments that were explained by that rule (p=0.01) and 2 more par-ticipants’ judgments clearly showed that they also used the ratio rule without having reported this. The judgments in-dicated significant use of the difference rule for 7 (p=0.01) of the 10 participants who reported that they used the dif-ference rule. The partial correlations with at least a 0.01 significance were used to group the participants into a ratio and a difference group. The average absolute dif-ference, |judgment−correct value| in the ratio group was
73.96 (3.35) and in the difference group 85.82 (19.94). This group difference was significant (t = 2.21, p<0.05, two-tailed), illustrating that the ratio rule gives judgments that are closer to correct than the difference rule.
In conclusion, the resource-saving bias is a kind of time-saving biases found in earlier studies (Svenson, 2008, 2011) and it was replicated in the present studies as a matching bias. The systematic matching bias could be derived from at least two different cognitively controlled judgment rules, the difference rule and the ratio rule (we may assume largely System 2 processes) each of which
was favored by one subgroup of participants. Both rules give biased estimates of resource savings.
In the following studies, we tested two ways of coun-teracting or eliminating the time or resource-saving bias in productivity increase judgments. Because most partici-pants in Study 1 seemed to use controlled System 2 strate-gies, we used debiasing techniques based on reframing of problems enabling a participant her- or himself to gain in-sight into her or his own biases, enabling a change of rule for improvement.
One reason for the bias may be that people do not ac-knowledge how much resources are saved by the already known productivity increase in line A before they proceed to a comparison and this will be focused in the next study. The participants in this study were all recruited from the same pool of students at Stockholm University as in Study 1 and none had participated in Study 1.
4
Study 2: Matching preceded by
judgments of resource savings
In this study, we encouraged the participants to estimate the man-months saved from the already implemented im-provement of the first line A, before they judged the speed increase needed in B to match the resource saving of A.
4.1
Material and problems
We used the same 10 problems as in Study. Again, 1000 units were produced by each production line. The produc-tion speeds before and after an improvement were given for A and the participants judged the increased speed of B that would match the resource saving of A.
In this attempt to improve judgment performance, we asked the participants to estimate the man-months saved from the already known improvement of A before they judged the speed of the second line. Thus, the instruc-tion to the participants was quite similar to the instrucinstruc-tion given in Study 1 but, it also included the following infor-mation.
Your task is twofold: (1) First, estimate how many man-months line A will save from the im-provement (from the low production speed to the highest speed). (2) Estimate in units/man-month the increased production speed of line B that would save the same amount of man-months as the improvement of line A.
Line A Line B Before improvement production: Before improvement production: 30units/man-month 40units/man-month After improvement production: After improvement production: 40units/man-month The A improvement saves ___ man months when 1000 units are produced
line B ___ units/man-month
The instruction explained the problems and the concept of man-month before the problem set was presented to the participants. When solving a problem a participant was not allowed to use external aids and told that the experi-menter wanted her or his own unaided judgments.
4.2
Results
We excluded three participants who did not solve 90% or more of the problems, leaving judgments from 31 partici-pants for analysis. Three outliers further than 4 SD from the mean judgment of a problem were treated as missing data. Table 1 shows that the average judgments deviated from correct values in the same directions as in Study 1, but the average judgment was not significantly differ-ent from the correct value for problem 4. We compared each problem in Study 1 and Study 2 and found that 2 judgments averages of the 10 problems improved signifi-cantly (two tailed t-tests, p=0.05). Hence, making a par-ticipant aware of the normatively logical first step of com-puting the saving for an existing alternative before giving a matching judgment for its alternative improved what may be called System 2 performance somewhat.
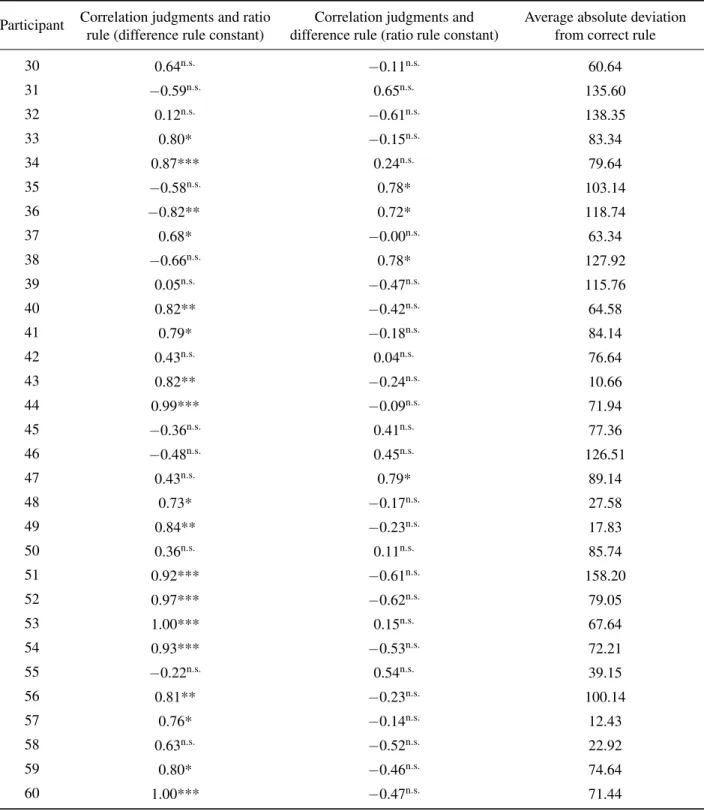
As in Study 1, we computed partial correlations for each participant between her or his judgments and the ratio and difference rule predictions and the average absolute devia-tion of the judgments from the correct values. The results (Appendix Table B) showed a decreased frequency of the difference rule. The ratio rule was significant at the 0.01 level for 12 of the 31 participants.
The resource-saving bias indicates that people do not understand the importance of the production speed from which an increase takes place. The purpose of Study 3 was to attempt to further improve intuitive judgments by hav-ing participants judge resource savhav-ings of the same pro-duction line after each of two steps of propro-duction speed increase (from P1 to P2 and from P2 to P3). In such
problems, there are two production speed increases start-ing from two different speeds, just as in the matchstart-ing task, but with one production line instead of two different lines. With this re-framing of the problem, a judge may become
aware of the different effects of increases from a low and a high production speed.
5
Study 3: Matching session
pre-ceded by a preparatory session of
successive resource saving
judg-ments
Study 3 was designed to have participants themselves im-prove their judgment strategies in a way different from Study 2. We gave participants an initial set of problems in which it becomes obvious to a problem solver that neither the difference nor the ratio rule give reasonable solutions. The problems concerned two successive improvements of production speeds at the same plant and illustrate that the ratio rule gives solutions that are wrong. The difference rule is less complex than the ratio rule because the ratio rule includes the difference in the numerator. The differ-ence rule gives poorer judgments than the ratio rule, and we designed the learning problems so that they should also illustrate that the difference rule is incorrect. We presented a separate and different set of resource saving problems in a separate session before the participants matched the 10 resource saving problems used in Studies 1 and 2.
Specifically, we predicted that, if the participants made judgments of only one production line with two successive production speed increases, they should become aware of the fact that the same proportional speed or difference im-provement from a lower original production speed saves more resources than the same proportional or difference improvement from higher speeds. This is an important insight if one wants to counteract the production or time-saving bias. In this way, both the difference and ratio rules can be challenged by the participants themselves when they judge successive improvements. To exemplify, if an industry increases production speed from 20 units/man-hour to 40 units/man-units/man-hour it would save 50% of the re-sources. If the industry then increases production speed further to 80 units/man-hour, it would save 50% of the re-sources from the production efficiency already attained af-ter the prior increase (and this is much less than the saving followed by the first speed increase). Hence, the two 50% speed increases do not give the same resource savings as predicted by the ratio rule.
5.1
Material and problems
The first set of problems presented a production line for 1000 units that had just been improved from one produc-tion rate (e.g., 30 units/man-month) to another (e.g., 40 units/man-month). The participants were asked to judge the resources saved in terms of worker man-months from
this already implemented efficiency improvement. Af-ter having made a judgment of the man-months saved by the already implemented speed increase to 40 units/man-month, the participant was informed that the present speed was insufficient and that a second efficiency improvement was planned for the same line to reach an even higher production speed (e.g., 60 units/man-month). How many man-months would this plan save compared to the cur-rent production speed? The problems included the follow-ing speed triplets with speeds used in the previous stud-ies: 40,60,80; 30,70,110; 40,50,80; 40,80,90; 30,40,70; 30,70,130; 40,80,120; 40,80,100; 40,80,150: 40,70,80. The participants were recruited in the same way as in the earlier studies and no participant had taken part in the pre-vious studies. The participants judged the saving of one problem and turned to the next problem. After having completed this learning task, the participants solved the same problems as in Study 2.
5.2
Results
All participants solved more than 90% of the problems. None was excluded. Five outliers further than 4 SD from the mean judgment of a problem were eliminated from the data. The average judgments in Table 2 illustrate the time-saving bias with all averages differing from the correct val-ues in the direction predicted by the time-saving bias. We performed two tailed t-tests (p=0.001) to compare Study 1 and Study 3 case by case. The results showed that the av-erage judgments in Study 3 were significantly better than the averages in Study 1 (bold digits in Table 2) except for Case 4. The proportional deviations from correct values illustrate that the participants made improvements com-pared to the performance in the other studies.
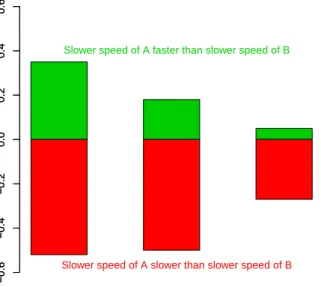
The time-saving bias predicts overestimation of produc-tion resources saved from low producproduc-tion speeds and un-derestimations from high speeds. Therefore, we split the problems in two sets of problems, increases from low and high speeds respectively and illustrated the data separately in these sets. Figure 1 gives the median proportional devi-ations for increases from low speeds in the top bars show-ing that the underestimation of the effect of a speed in-creases from a low speed and that the time-saving bias approaches zero and decreases over studies. Correspond-ingly, the effects of speed increases from high speeds are overestimated, judged speed changes will be too small as shown by the lower bars in Figure 1. However, the time-saving bias was not completely eliminated.
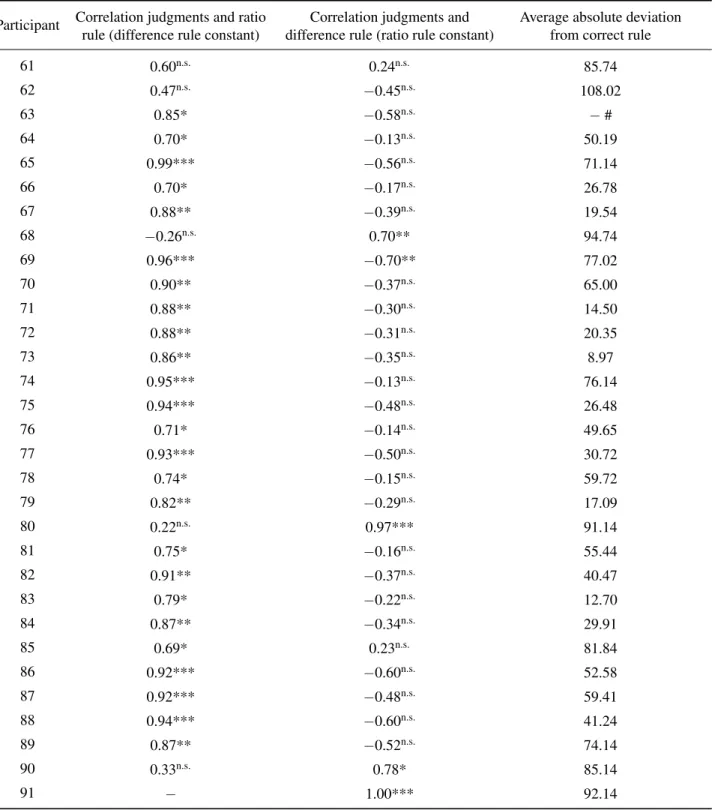
As in Study 1 we computed partial correlations for each participant. The results (Table B in appendix) showed a decreased frequency of the difference rule in comparison with Study 1 and only 2 partial correlations of 31 correla-tions were significant (p<0.01). The ratio rule was signif-icant (p=0.01) for 17 of the 31 participants. However, the
Figure 1: Median proportional deviations from correct an-swers in Study 1, 2 and 3. The upper bars describe me-dian proportional deviations for the problems where the slower reference speed of the reference alternative A was greater than the slower speed of B (to be matched). Cor-respondingly, the lower bars describe median proportional deviations of problems with the lower reference speed in A slower than the lower speed of B.
1 2 3 Study −0.6 −0.4 −0.2 0.0 0.2 0.4 0.6 Median propor tional de
viation from correct
((J udgment−Correct)/Correct) −0.6 −0.4 −0.2 0.0 0.2 0.4 0.6
Slower speed of A faster than slower speed of B
Slower speed of A slower than slower speed of B
ratio rule and the correct rule are highly correlated (for this set of cases r=0.89, p=0.001) and therefore we compared the absolute deviations from correct values as well and they were significantly smaller than those of Study 2. A one-way ANOVA of the mean average absolute deviations from correct values for the 3 studies (means 80.4, 79.3 and 53.9 for Study 1, 2 and 3) were significantly different, F(2:86) = 7.97, p<0.001. Post hoc Scheffe t-tests showed significance between Study 3 and Study 2 (p<0.01) and between Study 1 and Study 3 (p<0.01) and no significance between the first two studies.
6
Discussion
The studies illustrated that the time/resource-saving bias found in choices between efficiency improvements with the purpose of maximizing resource savings also applies to judgments. In search of the mental processes behind the resource saving bias, we found that verbal protocols identified two System 2 rules, the difference and the ra-tio rule, both of which give biased judgments of resource savings. Analyses of verbal protocols should be supported by analyses of other kinds of data (Ranyard & Svenson, 2011) and therefore, the verbal protocol results were
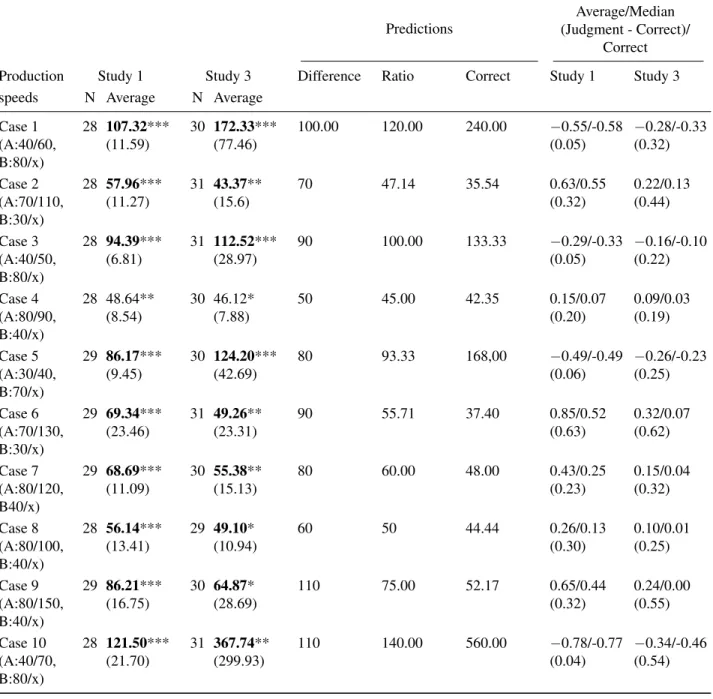
vali-Table 2: Average judged production speeds, difference rule predictions, ratio rule predictions, correct solutions and average and median proportional deviations from correct solutions in Study 1 and Study 3.
Predictions
Average/Median (Judgment - Correct)/
Correct Production Study 1 Study 3 Difference Ratio Correct Study 1 Study 3 speeds N Average N Average
Case 1 (A:40/60, B:80/x) 28 107.32*** (11.59) 30 172.33*** (77.46) 100.00 120.00 240.00 −0.55/-0.58 (0.05) −0.28/-0.33 (0.32) Case 2 (A:70/110, B:30/x) 28 57.96*** (11.27) 31 43.37** (15.6) 70 47.14 35.54 0.63/0.55 (0.32) 0.22/0.13 (0.44) Case 3 (A:40/50, B:80/x) 28 94.39*** (6.81) 31 112.52*** (28.97) 90 100.00 133.33 −0.29/-0.33 (0.05) −0.16/-0.10 (0.22) Case 4 (A:80/90, B:40/x) 28 48.64** (8.54) 30 46.12* (7.88) 50 45.00 42.35 0.15/0.07 (0.20) 0.09/0.03 (0.19) Case 5 (A:30/40, B:70/x) 29 86.17*** (9.45) 30 124.20*** (42.69) 80 93.33 168,00 −0.49/-0.49 (0.06) −0.26/-0.23 (0.25) Case 6 (A:70/130, B:30/x) 29 69.34*** (23.46) 31 49.26** (23.31) 90 55.71 37.40 0.85/0.52 (0.63) 0.32/0.07 (0.62) Case 7 (A:80/120, B40/x) 29 68.69*** (11.09) 30 55.38** (15.13) 80 60.00 48.00 0.43/0.25 (0.23) 0.15/0.04 (0.32) Case 8 (A:80/100, B:40/x) 28 56.14*** (13.41) 29 49.10* (10.94) 60 50 44.44 0.26/0.13 (0.30) 0.10/0.01 (0.25) Case 9 (A:80/150, B:40/x) 29 86.21*** (16.75) 30 64.87* (28.69) 110 75.00 52.17 0.65/0.44 (0.32) 0.24/0.00 (0.55) Case 10 (A:40/70, B:80/x) 28 121.50*** (21.70) 31 367.74** (299.93) 110 140.00 560.00 −0.78/-0.77 (0.04) −0.34/-0.46 (0.54) Note. * = p<.05 , ** = p<.01, *** = p<.001, two sample t-test differences from correct values. Standard deviations in parentheses. Bold digits indicate significant improvements from Study 1 to Study 3, two-tailed t-tests independent samples, p < 0.01 for all cases except p< 0.05 for case 8, and n.s. for case 4.
dated in regression and correlation analyses based on nu-merical responses. The time/resource saving bias persisted and decreased only slightly when participants were asked to judge the resources saved for a reference alternative be-fore solving a matching problem. But the bias could be weakened significantly by having the participants make judgments of the effects of successive production speed
increases of one single production site before comparing alternatives in a matching session, although the systematic error was not eliminated completely.
It is interesting to compare these approaches to that of Peer and Gamliel (2013), who re-framed the problem and instead of speed (mph) and gave information about how long it would take to complete a given distance (min/mile).
This kind of information was also used by Eriksson et al. (2013) in a driving simulator study. Both studies show that, even if mph or km/h are more natural ways of ex-pressing speed than the inverses, the latter drastically de-creases or eliminates the time saving bias.
When small groups of participants are compared, as they are here, uncontrolled group differences can influence the results. However, the time-saving bias is a very strong effect, and the statistical power in these studies is high. Also, the results were strong with participants randomly assigned to Study 2 or 3 and tested simultaneously. All of this makes between-studies uncontrolled effects unlikely.
We used two measures of judgmental accuracy in the studies, average absolute deviation from correct values (Appendix Tables A, B and C) and proportional differ-ences (Tables 1 and 2, Figure 1). From an applied per-spective, a saved man-month is the always the same and therefore average absolute deviation from correct value is a proper measure. From a psychological perspective, we know since the days of Fechner that judgmental precision is related to magnitude, so we also used the proportional difference from correct value as a measure. These mea-sures gave slightly different views on the judgments for Study 2. Proportional differences suggested that perfor-mance was slightly better than did the absolute difference measure.
In conclusion, part of the bias depends on the applica-tion of inadequate judgment rules, such as the difference and ratio rules. Interestingly, the participants themselves could improve their strategies and judgments after having solved only a small number of related problems. This re-sult supports the suggestion from Study 1 that the produc-tion speed saving bias is more of a System 2 than a System 1 phenomenon, in contrasts to other heuristics like the rep-resentativeness and affect heuristics, which are seen as pri-marily in System 1 (Tversky & Kahneman, 1974; Slovic, Finucane, Peters, & MacGregor, 2007).
From an applied perspective, productivity and increase of productivity of any activity is of general and increas-ing social concern. Even if there are many formal systems to measure productivity (Brown & Gobeli, 1992), unaided calculations of the effects of productivity changes are im-portant for final decisions (Svenson, 2003). Reformula-tions of the problems can improve those calculaReformula-tions to the benefit of those of us who are not experts in indicators of productivity. In this context it may be worth pointing out that stopping of a less productive system and investment of all resources in a more productive system is not always the best decision strategy if one wants to maximize sav-ings of available resources. When a problem involves the effects of increases in speed, decision makers should be warned about the time /resource saving bias and informed about possibilities to reformulate a problem before they make their decisions.
References
Brehmer, B. (1971). Subjects’ ability to use functional rules.Psychonomic Science,24(6), 259–260.
Brehmer, B., Hagafors, R., & Johansson, R. (1980). Cog-nitive skills in judgment: Subjects’ ability to use infor-mation about weights, function forms, and organizing principles. Organizational Behavior and Human Per-formance,26(3), 373–385.
Brown, W. B. & Gobeli, D. (1992). Observations on the measurement of R & D productivity: A case condition. IEEE Transactions on Engineering Management, 39, 325–331.
Chaiken, S., & Trope, Y. (Eds.). (1999). Dual-process theories in social psychology. Guilford Press.
Cronin, M. A., Gonzalez, C., & Sterman, J. D. (2009). Why don’t well-educated adultsunderstand accumula-tion? A challenge to researchers, educators, and cit-izens. Organizational Behavior and Human Decision Processes, 108(1), 116–130.
Dutt, V., & Gonzalez, C. (2013). Reducing the linear per-ception of nonlinearity: Use of a physical representa-tion. Journal of Behavioral Decision Making, 26(1), 51–67.
Ebersbach, M., Lehner, M., Resing, W., & Wilkening, F. (2008). Forecasting exponential growthand exponential decline: Similarities and differences. Acta psycholog-ica,127(2), 247–257.
Eriksson, G., Svenson, O. & Eriksson, L. (2013). The time-saving bias: Judgements, cognitionand perception. Judgment and Decision Making, 8,492–497.
Epstein, S. (1994). Integration of the cognitive and the psychodynamic unconscious. American psychologist, 49(8), 709–724.
Evans, J. S. B. (2008). Dual-processing accounts of rea-soning, judgment, and social cognition.Annual Review of Psychology,59, 255–278.
Fuller, R., Gormley, M., Stradling, S., Broughton, P., Kin-near, N., O’Dolan, C., & Hannigan, B.(2009). Impact of speed change on estimated journey time: Failure of drivers to appreciate relevance of initial speed.Accident Analysis & Prevention,41(1), 10–14.
Kahneman, D. (2003). Maps of bounded rationality: Psy-chology for behavioral economics. The American eco-nomic review,93(5), 1449–1475.
Keren, G., & Schul, Y. (2009). Two Is Not Always Better Than One A Critical Evaluation of Two-System Theo-ries. Perspectives on psychological science,4(6), 533– 550.
Kruglanski, A. W., & Gigerenzer, G. (2011). Intuitive and deliberate judgments are based on common principles. Psychological review,118(1), 97–109.
Larrick, R. P. & Soll, J. B.(2008). The MPG illusion. Sci-ence, 320(5883),1993–1594.
Peer, E., & Gamliel, E. (2012). Estimating time-savings: The use of the proportion and percentage heuristics and the role of need for cognition.Acta Psychologica, 141, 352–359.
Peer, E., & Gamliel, E. (2013). Pace yourself: Improving time-saving judgments when increasing activity speed. Judgment and Decision Making, 8(2), 106–115. Ranyard, R., & Svenson, O. (2011). Verbal data and
de-cision process analysis. In M. Schulte-Mecklenbeck, A. Kuehlberger, & R. Ranyard (Eds.) A Handbook of process tracingmethods for decision research, (pp. 115– 137). New York, NY: Psychology Press.
Resnick, L. B. & Singer, J. A. (1993). Protoquantitative origins of ratio reasoning. In T. P. Carpenter, E. Fen-nema & T. A. Romberg (Eds.) Rational numbers: An integration of research. Studies in mathematical think-ing and learnthink-ing., (pp. 107–130). Hillsdale, NJ, Eng-land: Lawrence Erlbaum Associates.
Schulte-Mecklenbeck, M. Kuehlberger, A. & Ranyard, R. (Eds.) (2011). A handbook of process tracing methods for decision research.New York: Psychology Press. Slovic, P., Finucane, M., Peters, E., & MacGregor, D. G.
(2002). Rational actors or rational fools: Implications of the affect heuristic for behavioral economics. The Journal of Socio-Economics,31(4), 329–342.
Slovic, P., Finucane, M. L., Peters, E., & MacGregor, D. G. (2007). The affect heuristic. European Journal of Operational Research,177(3), 1333–1352.
Svenson, O. (1970). A functional measurement approach to intuitive estimation as exemplified by estimated time-savings.Journal of Experimental Psychology, 86,204– 210.
Svenson, O. (1971). Changing the structure of intuitive es-timates of time-savings. Scandinavian Journal of Psy-chology, 12, 131–134.
Svenson, O. (2003). Values, affect and processes in hu-man decision making: a differentiation and consoli-dation theory perspective. In S. L. Schneider & J. Shanteau (Eds.) Emerging Perspectives on Judgment and Decision research. Cambridge: Cambridge Uni-versity Press, (pp. 287–326).
Svenson, O. (2008). Decisions among time-saving op-tions: When intuition is strong and wrong. Acta Psy-chologica, 127,501–509.
Svenson, O. (2011). Biased decisions concerning produc-tivity increase options. Journal of Economic Psychol-ogy, 32,440–445.
Tversky, A., & Kahneman, D. (1974). Judgment under uncertainty: Heuristics and biases.Science,185(4157), 1124–1131.
Wagenaar, W. A., (1975). Misperception of exponential growth.Perception & Psychophysics, 18(6), 416–422.
Appendix
The man-hour gain, calledGfrom an improvement of a production line is U P1 − U P2 =G, (5)
whereUis the number of units to be produced,P1andP2
are the production speeds in units/man hour for before and after the change.
Thus, when changes in production speeds are equal for line A and line B, the following equality applies withPA1
as initial production speed of A and PA2 the increased
speed of A andPB1as initial production speed of B and
PB2the increased speed of B:
U PA1 − U PA2 = U PB1 − U PB2 . (6)
Equation (6) applies only if U > 0 and U/PB1 >
U/PA1−U/PA2andU/PA1 > U/PB1−U/PB2. The
latter conditions apply because if the man-hour gain in one line is greater than the total man-hours needed to produce the same number of units before improvement in the other line, then there are not enough man-hours available to be saved when matching the two alternatives. Division byU
gives 1 PA1 − 1 PA2 = 1 PB1 − 1 PB2 . (7)
Note that the total number of units produced is of no im-portance to the choice between options as long as the con-ditions specified above apply.
Assume that you want to calculate the increased pro-ductivity,PB2, needed to give line B the same man-hour
gain as the production improvement of line A. The answer can be derived from equation (7):
PB2= 1 1 PB1 −( 1 PA1 − 1 PA2) (8) The formula seems complex for exact unaided judgments but if the problems are presented as in the Svenson (2011) problem scenario described earlier, they become easy to apprehend and seemingly not difficult to judge. When participants are asked to make two different productivity increases equal by choosing the increased speed needed to achieve this end, it is possible to rewrite Equation (8) in the following way:
PA2−PA1
PA1PA2
= PB2−PB1 PB1PB2
. (9)
In the studies of time-savings when driving, the partici-pant’s judgments followed Equation (10) with production speed corresponding to driving speed (Svenson, 2008). Note, that the difference between equation (9) and (10) lies in the fact that people were unable to adjust for both
PA1andPB1in the denominators.
PA2−PA1
PA2
= PB2−PB1 PB2
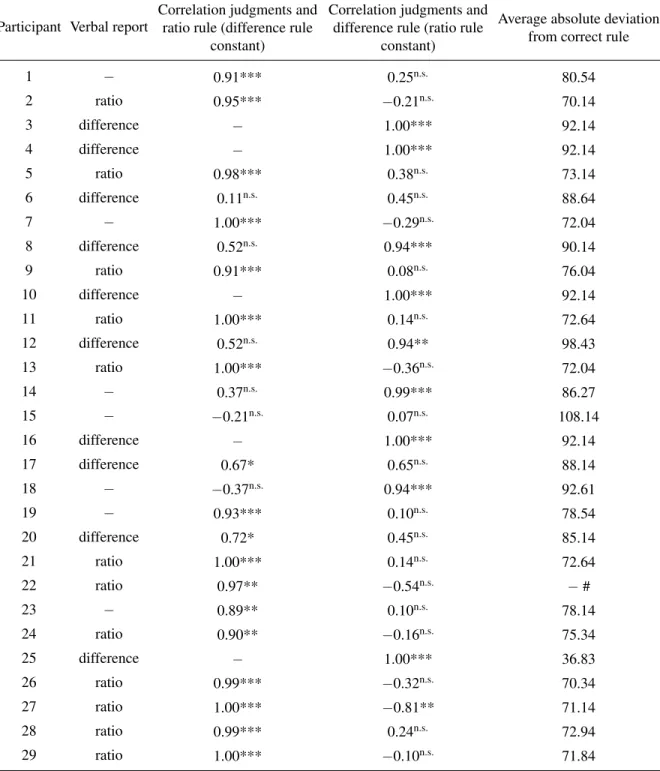
Table A: Study 1: Codings of verbal protocols and partial correlations for ratio and difference rule predictions. When the ratio rule applies so well that there is no variance left for the other rule no partial correlation can be computed. This was indicated by - in the table. When a verbal protocol could not be coded this was also marked - and the last column average absolute deviations from correct values. Last column shows average absolute deviations from correct rule predictions.
Participant Verbal report
Correlation judgments and ratio rule (difference rule
constant)
Correlation judgments and difference rule (ratio rule
constant)
Average absolute deviation from correct rule
1 − 0.91*** 0.25n.s. 80.54 2 ratio 0.95*** −0.21n.s. 70.14 3 difference − 1.00*** 92.14 4 difference − 1.00*** 92.14 5 ratio 0.98*** 0.38n.s. 73.14 6 difference 0.11n.s. 0.45n.s. 88.64 7 − 1.00*** −0.29n.s. 72.04 8 difference 0.52n.s. 0.94*** 90.14 9 ratio 0.91*** 0.08n.s. 76.04 10 difference − 1.00*** 92.14 11 ratio 1.00*** 0.14n.s. 72.64 12 difference 0.52n.s. 0.94** 98.43 13 ratio 1.00*** −0.36n.s. 72.04 14 − 0.37n.s. 0.99*** 86.27 15 − −0.21n.s. 0.07n.s. 108.14 16 difference − 1.00*** 92.14 17 difference 0.67* 0.65n.s. 88.14 18 − −0.37n.s. 0.94*** 92.61 19 − 0.93*** 0.10n.s. 78.54 20 difference 0.72* 0.45n.s. 85.14 21 ratio 1.00*** 0.14n.s. 72.64 22 ratio 0.97** −0.54n.s. −# 23 − 0.89** 0.10n.s. 78.14 24 ratio 0.90** −0.16n.s. 75.34 25 difference − 1.00*** 36.83 26 ratio 0.99*** −0.32n.s. 70.34 27 ratio 1.00*** −0.81** 71.14 28 ratio 0.99*** 0.24n.s. 72.94 29 ratio 1.00*** −0.10n.s. 71.84
The symbols ***, ** and * indicate 0.001, 0.01 and 0.05 significance levels and # incomplete data set (judgments missing or outliers for 3 problems).
Table B: Study 2: Partial correlations for predictions from ratio and difference rules. The last column gives average absolute deviations from correct values.
Participant Correlation judgments and ratio rule (difference rule constant)
Correlation judgments and difference rule (ratio rule constant)
Average absolute deviation from correct rule
30 0.64n.s. −0.11n.s. 60.64 31 −0.59n.s. 0.65n.s. 135.60 32 0.12n.s. −0.61n.s. 138.35 33 0.80* −0.15n.s. 83.34 34 0.87*** 0.24n.s. 79.64 35 −0.58n.s. 0.78* 103.14 36 −0.82** 0.72* 118.74 37 0.68* −0.00n.s. 63.34 38 −0.66n.s. 0.78* 127.92 39 0.05n.s. −0.47n.s. 115.76 40 0.82** −0.42n.s. 64.58 41 0.79* −0.18n.s. 84.14 42 0.43n.s. 0.04n.s. 76.64 43 0.82** −0.24n.s. 10.66 44 0.99*** −0.09n.s. 71.94 45 −0.36n.s. 0.41n.s. 77.36 46 −0.48n.s. 0.45n.s. 126.51 47 0.43n.s. 0.79* 89.14 48 0.73* −0.17n.s. 27.58 49 0.84** −0.23n.s. 17.83 50 0.36n.s. 0.11n.s. 85.74 51 0.92*** −0.61n.s. 158.20 52 0.97*** −0.62n.s. 79.05 53 1.00*** 0.15n.s. 67.64 54 0.93*** −0.53n.s. 72.21 55 −0.22n.s. 0.54n.s. 39.15 56 0.81** −0.23n.s. 100.14 57 0.76* −0.14n.s. 12.43 58 0.63n.s. −0.52n.s. 22.92 59 0.80* −0.46n.s. 74.64 60 1.00*** −0.47n.s. 71.44
Table C: Study 3: Partial correlations for predictions from ratio and difference rules. The last column gives average absolute deviations from correct values.
Participant Correlation judgments and ratio rule (difference rule constant)
Correlation judgments and difference rule (ratio rule constant)
Average absolute deviation from correct rule
61 0.60n.s. 0.24n.s. 85.74 62 0.47n.s. −0.45n.s. 108.02 63 0.85* −0.58n.s. −# 64 0.70* −0.13n.s. 50.19 65 0.99*** −0.56n.s. 71.14 66 0.70* −0.17n.s. 26.78 67 0.88** −0.39n.s. 19.54 68 −0.26n.s. 0.70** 94.74 69 0.96*** −0.70** 77.02 70 0.90** −0.37n.s. 65.00 71 0.88** −0.30n.s. 14.50 72 0.88** −0.31n.s. 20.35 73 0.86** −0.35n.s. 8.97 74 0.95*** −0.13n.s. 76.14 75 0.94*** −0.48n.s. 26.48 76 0.71* −0.14n.s. 49.65 77 0.93*** −0.50n.s. 30.72 78 0.74* −0.15n.s. 59.72 79 0.82** −0.29n.s. 17.09 80 0.22n.s. 0.97*** 91.14 81 0.75* −0.16n.s. 55.44 82 0.91** −0.37n.s. 40.47 83 0.79* −0.22n.s. 12.70 84 0.87** −0.34n.s. 29.91 85 0.69* 0.23n.s. 81.84 86 0.92*** −0.60n.s. 52.58 87 0.92*** −0.48n.s. 59.41 88 0.94*** −0.60n.s. 41.24 89 0.87** −0.52n.s. 74.14 90 0.33n.s. 0.78* 85.14 91 − 1.00*** 92.14
The symbols ***, ** and * indicate 0.001, 0.01 and 0.05 significance levels and # incomplete data set (judgments missing or outliers for 3 problems).