the Most Interesting Binary Association Rules
Alfonso Iodice D’Enza1, Francesco Palumbo2?, and Michael Greenacre31
Department of Mathematics and Statistics - Universit`a di Napoli Federico II Complesso Universitario di Monte S. Angelo, Via Cinthia
I-80126 Napoli, Italy
(e-mail: [email protected])
2
Department of Economics and Finance - Universit`a di Macerata Via Crescimbeni, 20
I-62100 Macerata, Italy
(e-mail: [email protected])
3
Department of Economics and Business - Universitat Pompeu Fabra Ramon Trias Fargas, 25-27
E-08005 Barcelona, Spain
(e-mail: [email protected])
Abstract. Association Rules (AR) represent one of the most powerful and largely used approach to detect the presence of regularities and paths in large databases. Rules express the relations (in terms of co-occurence) between pairs of items and are defined in two parts: supportandconfidence. Most techniques for finding AR scan the whole data set, evaluate all possible rules and retain only rules that have support and confidence greater than thresholds, which should be fixed in order to avoid both that only trivial rules are retained and also that interesting rules are not discarded. This paper proposes a two steps interactive, graphical approach that uses factorial planes in the identification of potentially interesting items.
Keywords: Association Rules, Classification, Binary variables.
1
Introduction
Association rules(AR) [Agrawalet al., 1993] represent a suitable data mining
tool to identify frequently occurring patterns of information in large data bases. The classic field of application of AR mining ismarket basket analysis
(MBA); in this context, data are stored astransactions: each transaction is a binary sequence that records the presence/absence of a set of pfeatures. The basic data structure consists of an n×pBoolean matrix; the terms of the table are 1 and 0, which correspond to the statespresence and absence, respectively. MBA is one of the first and better known application fields of AR mining: however, the binary structure of the data makes AR applicable in
?
Acknownledgements: The paper was financially supported by PRIN2003 grant: “Multivariate Statistical and Visualization Methods to Analyze, to Summarize, and to Evaluate Performance Indicators” research unit of University of Macerata, responsible F. Palumbo.
many different contexts. AR are largely used in text mining, image analysis and microarray data analysis.
An AR in its simplest form involves a pair of items playing different roles: the antecedent part of the rule (body), and the consequent part of the rule (head). The relation characterizing the considered items is usually expressed in two different measures: support andconfidence. The support is the intensity of the association between the considered items; the confidence measures the strength of the logical dependence expressed by the rule.
An example illustrates an AR in its simplest form: letAandB be a pair of items, beer and chips for example, the following notation represents the achieved AR:
A=⇒B ={support = 20%,confidence = 80%}.
The rule shows that 20 percent of customers buy both beer and chips, and if a customer buys beer, in 80 percent of cases buys chips too.
Simple rules does not represent the whole output of a mining process, since complex AR are extracted too. In its most general definition a complex AR is a rule in which there are one or more antecedent items and one or more consequents. Complex AR represent a more powerful tool, but they are even harder to handle.
The large size of the starting data matrix implies very high computational efforts in mining rules, and it can lead to a massive quantity of rules. Many proposed algorithms lead to mine rules in more and more efficient ways, but the identification and selection of interesting rules remains a still opened problem. It requires the definition of consistent criteria to avoid the risk that the truly interesting information is hidden by the presence of trivial and redundant rules.
The great part of the contributions in the AR literature is aimed to the implementation of algorithms for the generation of AR in reduced computa-tional costs and output amount, as well as for the generalization of AR to categorical and numerical data.
The reference point among these algorithms is the Apriori, introduced by [Agrawal and Srikant, 1994]. This algorithm consists of two phases: the
frequent itemset miningphase and the properly definedassociation rule
min-ingphase. An itemset is frequent if the items involved in it co-occur with a frequency greater than a user-defined threshold, in other words the itemset support is greater than the assigned minimal support threshold. In the sec-ond phase, there is the generation of all the possible rules deriving from the itemsets previously selected: the output rules provided by the procedure are those characterized by confidence exceeding a minimal confidence threshold. Based on the same idea of the Apriori, the AprioriTid [Agrawal and Srikant, 1994] introduces an encoding of the founded frequent itemsets in order to reduce the computational effort.
The AprioriHybrid is a combination of both Apriori and AprioriTid, in the earlier and the latter iterations respectively [Agrawal and Srikant, 1994].
Other interesting algorithms are the DHP (Direct Hashing and Pruning) [Park et al., 1995], the Partition algorithm [Savasere et al., 1995], the DIC
(Dynamic Itemset Counting) algorithm [Brinet al., 1997] and the FP-growth
(Frequent Pattern growth) algorithm [Hanet al., 2000] for which we refer the
reader to the bibliography. The procedures above are applicable to Boolean data. To generalize the algorithms to numerical and categorical AR, a previ-ous recoding of the data is required: in this sense the contribution of [Srikant and Agrawal, 1996] and [Miller and Yang, 1997]. A last class of proposals is aimed to solve a common problem of AR mining, the huge number of rules generated, selecting and identifying the interesting generated AR. The con-tributions belonging to this class, like [Zaki, 2000] and [Liuet al., 1999], are characterized by a same target as well as approaches of different nature.
Almost all AR mining algorithms use thresholds whose settings are related to a trade-off: tight thresholds can cause loss of interesting information; otherwise, loose thresholds cause an excessive number of uninteresting rules to be selected. In addition, notice that the reduction of output rules is anyway linked to the generation of all potential rules.
The present paper proposes an exploratory strategy to identify a priori
items that are potentially interesting as antecedent or consequent parts of rules. The method does not produce AR but provides the user with informa-tion about the most probably interesting items. One of the above meninforma-tioned algorithms must be used, focusing the attention only to those items that the procedure indicated as interesting, to obtain the AR set. Reducing the number of considered items, the user can define looser thresholds, avoiding as well the risk of a huge amount of rules. In addition, information about the items help the user to pay greater attention to the rules containing the previously identified items.
The proposed strategy exploits the graphical and analytical capabilities of multidimensional data analysis (MDA), in particular the paper will focus on the computational aspects whenn andpare large.
The procedure deals with the following data structures: letZbe a (n×p) presence/absence matrix characterized bynbinary sequences considered with respect topBoolean variables; in our application thenrows refer to baskets of items purchased and thepcolumns refer to the items (with coding 1 =buy
and 0 =not buy). LetS=n−1ZTZbe a symmetric contingency table, whose general extra-diagonal termsjj0 =sj0jrepresents the support with respect to the itemsj and j0, in our case, the relative frequency of purchasing pairs of
items. The asymmetric square matrix Cis defined asC=ZTZD−1, where Dis a diagonal matrix having general termdjj =sjj (j = 1, . . . , p). Matrix C has the general diagonal term cjj = 1 while for j 6= j0 the term cjj0
corresponds to the confidence of the rule{Aj=⇒Aj0}.
In Section 2 we present the steps of the strategy and the related tools: clustering phase (subsection 2.1), items selection according to the supports
(subsection 2.2), identification of rules bodies and heads (subsection 2.3). In section 3 we present an example on the BMS-Webview-2 dataset.
2
Multidimensional data analysis (MDA) approach
The proposed strategy consists of two main phases and aims at generating a reduced number of AR; in particular the phases are:
i) partitioning of the considered binary sequences (transactions) in homo-geneous classes;
ii) selecting interesting items and visually representing the interesting rules using MDA techniques.
In the case of huge data sets the applicability of the whole procedure strongly depends on the the first phase of classification: this step is very expensive in terms of time elapsed and memory required. Thus it is necessary to choose an algorithm increasing speed and efficiency of the whole procedure. Once the group are determined, the attention is focused on the supports and confidences matrices of order p×p related to each group. In addic-tion, our proposal is based on a suitable factorial analysis on these matrices that requires short computing time and low memory usage: the most time consuming phase consists in the singular value decomposition of symmetric matrices. Moreover, partitioning the data in groups permits to perform the analysis on parallel computing architectures. The aim is to select the most occurring pairs of items in each group and to assign the role of antecedent or consequent to the set of selected items.
2.1 Clustering transactions
The general aim of clustering techniques is to partition the statistical units of a given data set in disjoint classes such that similar units are grouped together. Dealing with large, high dimensional and sparse data sets, classic clustering techniques like K-means algorithm [Hartigan, 1975] and
agglom-erative algorithm require very high computational costs and do not
guaran-tee reliable solutions. Thus, in the literature, there are many contributions proposing algorithms optimized for massive amounts of binary data: the ROCK algorithm proposed by [Guha et al., 2000], that is based on links
and represents an agglomerative hierarchical clustering; QROCK that is a speeded up version of ROCK, while a density based algorithm considering links is the SNN (shared nearest neighbors). Two of the non-hierarchical clustering algorithms for binary data are LWC (light weight clustering) and
incremental K-means proposed by [Gaberet al., 2004] and [Ordonez, 2003],
respectively: the main aim of both these procedures is clustering of data streams, which are flows of binary sequences. In this paper, however, the procedure is applied on a finite set of binary sequences.
The first step of the proposed strategy is then implemented exploiting the features of one of the above procedures, incrementalK-means that is a non-hierarchical algorithm and it is characterized by doing a single iteration to get the partition of the rows of the binary matrixZinKdisjoint classes. The logical distance between the binary rows ofZis measured trough the Jaccard coefficient. The incrementalK-means takes as input the number of clusters that is hence user-defined. The output provided by the procedure consists of: the partition matricesZk (nk×p), wherek= 1, . . . , K; the centroid matrix C that is (K×p), with cluster centroids on rows; aK-elements vectorw of cluster weights such thatwk=nk
n; a (K×p) matrixRof squared distances. The initialization phase ofIncremental K-means presents a difference with Standard K-means: instead of using k random sequences as centers, this algorithm exploits global statistics (mean and variance) of the input indicator matrix to obtain the starting centers. Furthermore, the procedure does not update the centroid matrixCand the cluster weights vectorwat every binary sequence but every (n/L) times, wherenandLare the number of considered sequences and an initialization parameter, respectively. The reader is referred to [Ordonez, 2003] for further details about the procedure.
2.2 Selection of interesting items
The previous step defined a partition ofZinZk, withk= 1, . . . , K; for each of theZkmatrices, supports (Sk) and confidences (Ck) are defined. AR mining is hence referred to each group of homogeneous sequences. In particular, through the analysis of eachSk, the most occurring pairs of items within the
k-thgroup are selected; while through the analysis of eachCk, the procedure assigns the role of antecedent or consequent to each one of the selected items. The selected pairs of items resulting by the analysis of Sk represent evident relations characterizing groups of considered binary sequences: these hidden patterns can be missed using general support thresholds. The pairs of items characterized by a degree of co-occurrence that is high in one or more of the K groups and low with respect to the whole data are then considered non-trivial. The criteria used to define what is “high” or “low” are based on the ratio between the most occurring supports inside the groups and the total supports. Proper statistical tests can be adopted to exploit the task; however, this paper does not focus on this aspect.
2.3 Items roles in the rules
The confidence table C is square and asymmetric, a characteristic that has to be taken into account in analyzing the matrix. The features ofC can be extended to each Ck =ZTkZkD−k1. In the context of multidimensional data analysis, different proposals in the literature extend well-known methods like correspondence analysis (CA) [Greenacre, 2000] and multidimensional scal-ing (MDS) to square asymmetric tables [Bove, 1989]. A common aspect
of these methods is in the decomposition of the asymmetric table into two components: symmetric and skew-symmetric. Applying this decomposition to a table C, it results: C = Cs+Csk, where Cs = 12 C+CT
repre-sents thesymmetriccomponent of C, andCsk=12 C−CTrepresents the
skew-symmetric component of C. The separate analyses of the two
compo-nents lead to obtain a representation of the symmetric and skew-symmetric characteristics of table C: the methodology applied on Cs and Csk, and the corresponding representation display, characterize the different proposals treating square asymmetric tables.
Taking into account the general pair of itemsj and j0, identified by the
analysis of S, the role ofj andj0 depends on the valuesc
(j,j0)sk andc(j,j0)s. Remark that the diagonal elements ofCare constant values equal to 1. These trivial values are completely irrelevant to the analysis and their presence introduces noise in the representations. In order to cut off noise from C according to Greenacre [Greenacre, 1984], these values can be ignored and replaced by an iterative alternating procedure.
The matrixC is decomposed in symmetric and skew-symmetric compo-nents and then treated to replace the diagonal elements, by the following procedure:
i) decompositionC inCs andCsk;
ii) correspondence analysis ofCsandCsk;
iii) reconstruction of the main diagonal of Cs through the general recon-struction formula: npij=nrirj(1 + F X f=1 λ−0.5 f ϕifϕjf), (1)
withi, j= 1, . . . , pandf = 1, . . . , F. F is the number of considered
fac-tors,pis the number of considered items,ϕif is the principal coordinate of thei-th item on the factor f;ri andrj represent the row margins of C;
iv) comparison of the reconstructed diagonal with the previous main di-agonal for Cs: if there is no difference then the whole matrix C∗
s is reconstructed using formula (1); else Cs is updated with the obtained diagonal and repeat the previous steps;
v) rebuild the confidenceC∗=C∗
s+Csk;
Each of the previously selected items is considered as an antecedent or con-sequent part of interesting rule depending on its deviation from symmetry: items having a positive deviation are considered interesting heads, the re-maining items are then thebodies.
3
Example
In this section the procedure is applied to the BMS-Webview-2 data set: this data set was used in KDD-cup 2000 competition and refers to the transactions
associated to an e-commerce company. The whole data set is available at KDD-cup 2000 home page (url: http://www.ecn.purdue.edu/KDDCUP). This data set was already used in many applications of data mining proce-dures proposals and it represents a qualifying benchmark. Being the pre-sented approach complementary to the computer science based proposals, a direct result comparison would not make any sense.
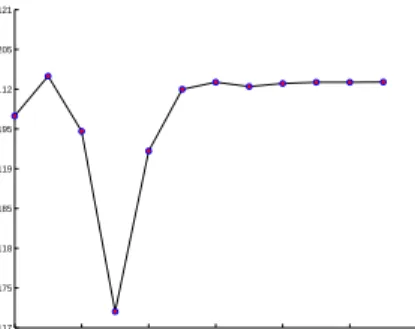
In the BMS-Webview-2 data set each statistical unit represents the click-streams of a single session of a visitor in the e-commerce web-site; each item corresponds to a single product. The raw data set is characterized by 77512 web click-streams and 3340 product-pages (items). After a pre-processing phase the incrementalK-means algorithm is applied with different numbers of classes. As shown in figure 1, the best partition is obtained for K = 10,
4 6 8 10 12 14 16 0.117 0.1175 0.118 0.1185 0.119 0.1195 0.12 0.1205 0.121 number of groups quality level
Fig. 1.Classification quality versus number of classes
since the quality level of the classification becomes stable. The quality level measure for the classification is proportional to the reciprocal of the mean distance between each unit and its related cluster centroid. Following the procedure, once the partition of Z in K groups is determined, the items that mostly characterize each group are then selected. Interesting items selection and the consequent determination of the selected items roles can be completely automated: however expert users can interact and iteratively set up different parameters.
The lack of space does not allow us to represent the graphical displays associated for all ten classes. We just shall give an interpretation key of the whole procedure output.
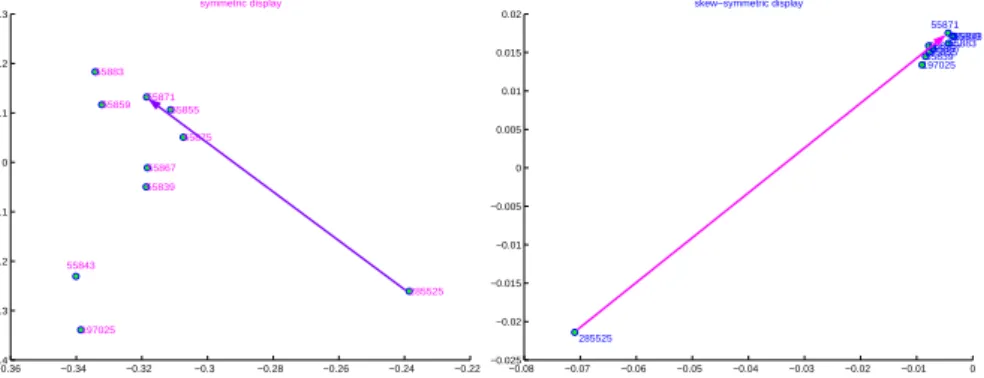
The procedure output is mainly graphical and consists of various repre-sentations of the reconstructed confidence matrix. The paper proposes two of them. The first one (see figure 2) represents the items in the principal factorial space ofCk andCskaccording to Greenacre (2000). The other one, which is more simple, represents the values of the reconstructed C∗. In the
−0.36 −0.34 −0.32 −0.3 −0.28 −0.26 −0.24 −0.22 −0.4 −0.3 −0.2 −0.1 0 0.1 0.2 0.3 symmetric display 197025 285525 55839 55843 55855 55859 55867 55871 55875 55883 −0.08 −0.07 −0.06 −0.05 −0.04 −0.03 −0.02 −0.01 0 −0.025 −0.02 −0.015 −0.01 −0.005 0 0.005 0.01 0.015 0.02 skew−symmetric display 197025 285525 55839 55843 55855 55859 55867 55871 5587555883
Fig. 2. a) representation of the symmetric component of confidence matrix; b)representation of the skew-symmetric component of the confidences.
of co-occurrence that is a support-like information; in the skew symmetric display, points far from the center of the map are characterized by a high deviation from symmetry. For each pair of items, the amount of the devia-tion from symmetry is propordevia-tional to the area of the triangle formed by the considered pair of points and the axis origin. The sign of the deviation from symmetry depends on oriented triangles: positive deviations correspond to clockwise oriented triangles. The latter display could be quite difficult for a non-expert user to interpret.
The left part of figure 2 shows the item ’285525’ to be positioned far from the others, that means a different degree of occurrence. The skew-symmetric display confirm the different behavior of ’285525’. On the basis of such considerations, a possible rule could be in this case ’285525’−→’55871’, and it is highlighted in both the sides of figure 2.
The second approach is much more understandable, it displays, by a bar-chart, the n×(n−1) quantitiesqj,j0 = 1−
c∗
(j,j0) c∗
(j0,j)
(withj, j0 = 1, . . . , n and
j > j0). The consideration of confidence ratiosqj,j0 lead to identify the pairs
of itemsj andj0 with differingc
(j,j0) andc(j0,j).
Bars are sorted in decreasing order, according to the confidence ratios. A bar represents an interesting rule j −→ j0 if it has an high value, being
c∗
(j,j0) < c∗(j0,j), and the ordered pair (j, j0) has a positive deviation from
symmetry.
Figure 3 confirms the “importance” of the rule ’285525’−→’55871’ that is associated to the first bar in the bar-graph. Furthermore, the different be-havior of the item ’285525’ is evident: the first-ranked bars are all associated to rules having ’285525’ as an antecedent part.
4
Conclusion and perspectives
Since the AR were introduced for the analysis of large (and huge) data bases, most of the computational aspects, in term of speed and memory, have been successfully solved. However, it is still an open problem how to interpret the massive output. J. Edler and D. Pregibon in 1996 [Elder and Pregibon, 1996] foresaw that the KDD would have been a field for important challenges for the statistical community. They wrote: “The statistician’s tendency to avoid complete automation out of respect for the challenges of the data, and the historical emphasis on models with interpretable structure, has led that community to focus on problems with a more manageable number of variables (a dozen, say) and cases (several hundred typically) than may be encountered in KDD problems, which can be orders of magnitude larger at the outset. With increasingly huge and amorphous databases, it is clear that methods for automatically hunting down possible patterns worthy of fuller, interactive
attention, are required”. This paper, eight years later, goes in the direction
indicated by Edler and Pregibon. Nowadays, the more and more increased power of modern computer makes easier to achieve this task.
Future enhancements of the proposed approach are into different direc-tions. From a computational point of view, the aim is to improve the classi-fication step in order to obtain higher quality solution in less time. Another important aspect is the generalization of the selection criteria from pairs of items to pairs of itemsets, or rather to generalize the procedure to complex rules. Furthermore, according to the exploratory nature of the procedure, it is necessary to improve the visualization tools and introduce interactive capabilities.
References
[Agrawal and Srikant, 1994]R. Agrawal and R. Srikant. Fast algorithms for mining association rules. In Proc. of the 20th Very Large Data Bases Conference,
pages 487–499, Santiago, Chile, 1994.
[Agrawalet al., 1993]R. Agrawal, T. Imielinski, and A. Swami. Mining association rules between sets of items in large databases. InACM SIGMOD int. conf. on Management of data, volume 22, pages 207–216, N.Y., 1993. ACM Press. [Bove, 1989]G. Bove. Nuovi metodi di rappresentazione di dati di prossimit`a. Tesi
di dottorato, Univ. di Roma La Sapienza, Roma, 1989.
[Brinet al., 1997]S. Brin, R. Motwani, J. Ullman, and S. Tsur. Dynamic itemsets and implication rules in market basket data. InACM SIGMOD int. conf. on Management of data, pages 255–264, Tucson, Arizona, USA, May 1997. [Elder and Pregibon, 1996]J. F. IV Elder and D. Pregibon. A statistical perspective
on knowledge discovery in databases. In U. M. Fayyad etal., editors,Advances in knowledge discovery and data mining, pages 83–113, Am. Ass. for AI, 1996. [Gaberet al., 2004]M. M. Gaber, S. Krishnaswamy, and A. Zaslavsky. Cost-efficient mining techniques for data streams. InProc. of the second workshop on Aus-tralasian information security, Data Mining and Web Intelligence, and Soft-ware Internationalisation, pages 109–114, Dunedin, New Zealand, 2004. [Greenacre, 1984]M. Greenacre. Theory and Applications of Correspondence
Anal-ysis. Academic Press, London, 1984.
[Greenacre, 2000]M. Greenacre. Correspondence analysis of square asymmetric ma-trices. Applied Statistics, 49(3):297–310, 2000.
[Guhaet al., 2000]S. Guha, R. Rastogi, and K. Shim. Rock: A robust clustering algorithm for categorical attributes. InProc. of the 15th
Int. Conf. on Data Engineering. IEEE Computer Society, 2000.
[Hanet al., 2000]J. Han, J. Pei, and Y. Yin. Mining frequent patterns without candidate generation. In ACM SIGMOD int. conf. on Management of data, pages 1–12, Dallas, Texas, May 2000. ACM SIGMOD.
[Hartigan, 1975]J. A. Hartigan. Clustering Algorithms. John Wiley & Sons, 1975. [Liuet al., 1999]H. Liu, W. Hsu, and Y. Ma. Pruning and summarizing the
discov-ered associations. InProc. of KDD, pages 125–134, San Diego, CA, 1999. [Miller and Yang, 1997]R. J. Miller and Y. Yang. Association rules over interval
data. In ACM SIGMOD int. conf. on Management of data, pages 452–461, Tucson, AZ, USA, 1997.
[Ordonez, 2003]C. Ordonez. Clustering binary data streams with k-means. InProc. of the 8th ACM SIGMOD workshop on Research issues in data mining and knowledge discovery, pages 12–19, San Diego, CA, 2003. ACM Press.
[Parket al., 1995]J. Park, M. Chen, and P. Yu. An effective hash based algorithm for mining association rules. In M. J. Carey and D. A. Schneider, eds,ACM SIGMOD Int. Conf. on Management of Data, pp. 175–186, San Jose, 1995. [Savasereet al., 1995]A. Savasere, E. Omiecinski, and S. Navathe. An efficient
al-gorithm for mining association rules in large data bases. In21st
Conference on Very Large Data Bases, pages 407–419, Zurich, Switzerland, September 1995. [Srikant and Agrawal, 1996]R. Srikant and R. Agrawal. Mining quantitative asso-ciation rules in large relational tables. InACM SIGMOD int. conf. on Man-agement of data, pages 1–12, Montreal, Quebec, Canada, June 1996.
[Zaki, 2000]M. J. Zaki. Generating non-redundant association rules. InKnowledge Discovery and Data Mining, pages 34–43, 2000.