Proceedings of the 2nd ICAUD International Conference in Architecture and Urban Design Epoka University, Tirana, Albania, 08-10 May 2014 Paper No. 128
Passive Strategies and Low-Carbon Technologies:
Evaluating the Energy Performance and Thermal Comfort of a
Passive House Design
Jonida Murataj (Jaupi) Oxford Brookes University London Metropolitan University
10 Clayton Way, Hove, UK jonidajaupi@hotmail.com
ABSTRACT
This paper aims to evaluate the success of energy performance and thermal comfort of a passive house design in the UK climate. In order to analyze how passive housing guidelines (less than 15kWh/m2/yr for heating and 120kWh/m2/yr as primary energy) can be achieved, this paper uses Integrated Environment Solutions (IES) to develop the design strategies of a case study house and decide what the best passive approach to use. In this paper, it is described how the design is developed using dynamic simulations in different stages and for different purposes. Moreover, considering the energy options’ potential inspite from the technical options available to the carbon savings to the environment impact, costs and payback periods, different renewable energy options are evaluated in order to make the design carbon neutral. It is concluded that achieving passive design standards not only provide energy and environmental benefits, but also improve the thermal comfort inside the building.
KEYWORDS: Passive house, Passive strategies, Low-carbon technologies, Thermal comfort, Energy efficiency
1 INTRODUCTION
The Kyoto Protocol, agreed in 1997 with the aim of reducing the emissions of harmful greenhouse gases and preventing dangerous climate change, committed the UK to a reduction of greenhouse gases by 12.5% by 2012 (United Nations, 1997). The Climate Change Act of 2008 increased the reduction targets for the UK to ensure that the net carbon account for the year 2050 in the country is at least 80% lower than the 1990 baseline. According to the UK Green Building Council (2013), buildings are responsible for 50% of all emissions in the UK, hence it is essential to know how they are designed and managed in order to develop strategies to reduced emissions from buildings.
Passive House can play a major role in reducing the impact of global warming. The energy requirement of a passive house(less than 15kWh/m2/yr for heating and 120kWh/m2/yr as primary energy) is so low that a family living in such a house will never again need to worry about energy price hikes (SEI, 2007).
In order to analyze how passive housing guidelines can be achieved, this paper uses Integrated Environment Solutions (IES) to develop the design strategies of a case study house and decide what the best passive approaches to use would be to meet the targets described above. In this paper, how the design process is developed using dynamic simulations in different stages and for different purposes is described. Then, an analysis to identify the most appropriate low-carbon energy solutions for the design based on the users' requirements is undertaken. Based on the energy requirements for the building as indicated by the
IES modelling, the electricity, heating energy and hot water energy requirements are identified, as well as their complementing low-carbon energy sources. Two different combinations of systems in order to provide 100% coverage of energy consumption by renewable energy is then developed and calculated. The calculations include cost analysis and payback periods. In addition, an estimation of carbon emissions is undertaken based on the CO2 emission factors for common fuels.
It is concluded that renewable energy systems have great potential when they are applied in the right scale, location and with the right combination.
2 BACKGROUND
The house investigated in this paper is located in Poundon, Bicester, in the northwest of Buckinghamshire, UK. It is a detached house with an organisation scheme based on the client preferences. The final floor plan is designed taking into consideration the regulations for different space orientations and necessary requirements (see Figure 1).
Figure 1: Plan and images of the house 3 METHODOLOGY
This research uses the Integrated Environmental Solutions (IES) software to model the case. The design was built using model IT commands. The modeling was done at different stages to investigate the various internal environmental conditions. Firstly, the internal and external partitions using external CAD files were constructed, then the general openings were added. In order to maximize solar gains and control overheating in summer, the design was modified by adding local shading in certain angles and of certain sizes, adding rooflights and adding roof overhang and sun spaces (see Figure 2).
Figure 2: Design developing process
Because IES is dynamic modeling software, to calculate the energy requirements for space heating, it takes into consideration the internal gains from occupancy, lighting and appliances. Therefore, profiles are created for each activity and appliance in the house. Examples of these profiles are illustrated in Tables 1, 2 and 3.
Table 1, 2 and 3 Lighting, appliances and Occupancy profiles
4 MODEL SIMULATIONS
This section presents an investigation of the most important strategies to achieve the Passive house requirements through simulations and analyses how these results have influenced the design of the house. The aim of this model is to for the house to achieve thermal comfort for its users and to be energy efficient. To achieve this, there are three essential objectives:
1.Minimising energy consumption and carbon emissions; 2.Achieving thermal comfort; and
3.Achieving adequate daylight levels.
4.1. Minimisingenergy consumption and carbon emissions
In order to minimize heating loads, some strategies are investigated such as building orientation and fabric construction.
a.Building orientation
The first consideration investigated in IES was the orientation of the building after developing the functional scheme based on the solar gains graph shown in Figure 3. This graph shows there is more solar radiation in the south-facing surfaces in the coldest months, which is the time when solar gains are most useful. The building was investigated in four different orientations and it was concluded that if the building has a south-facing orientation, this would achieve more solar gains and thus require less energy consumption than it would be the case with the other orientations (see Figure 4). Because of this, the building is oriented with the long face towards south and north.
Figure 3: Monthly mean daily global radiation on
vertical surface in different orientations.
Figure 4: Solar gains and energy consumption for different orientations of the building
The thermal transmittance (U-value) is a measure of the overall rate of heat transfer under standard conditions through a particular section of construction (Beggs, 2002). To minimise heat losses through building fabric, the thermal transmittance of the each of the construction elements is as follows:
U-value walls = 0.08W/m2K U-value roof = 0.08W/m2K U-value floor = 0.09W/m2K
The glazing system used in this design project is made up of three panes of glass and two 12mm layers filled with argon gas. In order to maximize solar gains and minimize heat losses, the properties of the glazing used are:
g = 0.622 (high) Tv = 0.807 (high)
U-value = 0.89W/m2K (low)
Type and thickness of insulation, and thermal mass
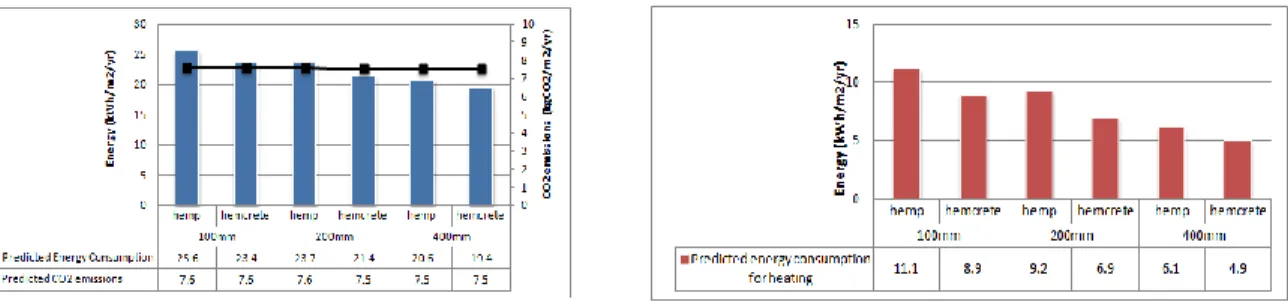
In this project, hempcrete is used as the insulation material. However, the simulations were also run for hemp insulation with different thicknesses (see Figure 5). However, the difference between the two types of insulation is within their thermal mass capacity. Being a mixture of hemp and earth, hempcrete has a density of 520kg/m3, whilst hemp only has 30kg/m3. The graph illustrated in Figure 5 shows the total energy consumption, while the difference between the two materials only for the heating part of the total energy consumption is shown in Figure 6.
Figure 5: Predicted energy consumption and carbon emissions for two different types of insulation
Figure 6: Predicted energy consumption of two different types of insulation for heating
4.2. Achieving thermal comfort
In a survey of user satisfaction in buildings with passive solar features, Nicol et al (2012) found that having the ‘right temperature’ was one of the things people considered to be most important about a building. Therefore, this section is a discussion of the way thermal comfort can be achieved related to temperature in two main spaces of the house:
1.Living + dining room; and 2.Studio.
Temperatures are investigated at every stage of design, including adjusting construction, shading and macroflow, part of IES adjustments.
From the energy consumption analysis related to construction type and thickness, it was determined that the lowest amount of energy consumption is achieved with 400mm hempcrete insulation. In terms of shading devices, louvers are used and they are closed during summer days when the incident radiation is greater than 400W/m2 and closed during winter nights to minimize heat losses through the windows. In order to prevent overheating in summer, the macroflow formula and profile are arranged. The windows should be left open when:
- The room air temperature is greater than 21°C;
- The room temperature is greater than the outside air temperature.
This arrangement of the macroflow profile provides a maximum room air temperature of 25°C, preventing the space from overheating. Doing the above adjustments and taking the insulation layer thickness into consideration, the first scenario of using 100mm hempcrete insulation is illustrated in Figure 7.
Jan Feb Mar Apr May Jun Jul Aug Sep Oct Nov Dec Jan
30 25 20 15 10 5 0 -5 -10 Te m pe ra tu re (° C )
Date: Mon 01/Jan to Mon 31/Dec
Air temperature: Studio_COMMUNITY (100 hemcrete.aps) Air temperature: Living + Dining (100 hemcrete.aps)
Dry-bulb temperature: HeathrowEWY.fwt (HeathrowEWY.fwt)
Jan Feb Mar Apr May Jun Jul Aug Sep Oct Nov Dec Jan 30 25 20 15 10 5 0 -5 -10 T e m p e ra tu re ( °C )
Date: Mon 01/Jan to Mon 31/Dec
Air temperature: Studio_COMMUNITY (100 hemcrete.aps) Air temperature: Living + Dining (100 hemcrete.aps) Dry-bulb temperature: HeathrowEWY.fwt (HeathrowEWY.fwt)
Jan Feb Mar Apr May Jun Jul Aug Sep Oct Nov Dec Jan 30 25 20 15 10 5 0 -5 -10 T e m p e ra tu re ( ° C )
Date: Mon 01/Jan to Mon 31/Dec
Air temperature: Studio_COMMUNITY (all year.aps) Air temperature: Living + Dining (all year.aps) Dry-bulb temperature: HeathrowEWY.fwt (HeathrowEWY.fwt)
Figure 7. Temperatures in studio and living room with 100mm hampcrete insulation
Figure 8. Temperatures in studio and living room with 400mm hampcrete insulation
In addition, in the first scenario, heating was only on when the space was occupied, which resulted in approximately 37% of the occupied hours to be below 18°C. In the final scenario, adjusting the heating profiles with the condition of turning the heating on when the room air temperature was below 18°C, only nine hours were below that temperature, which results in 0.4% of the occupied hours’
This result is well illustrated in Figure 8, the final scenario with 400mm hempcrete insulation, which shows that the temperature fluctuations in the studio and the living room are very small compared to the outside temperature. The peak day for both winter and summer are investigated, and a constant temperature is provided above 18°C in winter and below 25°C in summer. (See Figure 9 and 10)
00:00 02:00 04:00 06:00 08:00 10:00 12:00 14:00 16:00 18:00 20:00 22:00 00:00 30 25 20 15 10 5 0 -5 -10 Te m pe ra tu re (° C )
Date: Fri 26/Jan
Air temperature: Studio_COMMUNITY (all year.aps) Air temperature: Living + Dining (all year.aps)
Dry-bulb temperature: HeathrowEWY.fwt (HeathrowEWY.fwt)
00:00 02:00 04:00 06:00 08:00 10:00 12:00 14:00 16:00 18:00 20:00 22:00 00:00 30 25 20 15 10 5 0 -5 -10 T em pe ra tu re ( °C )
Date: Fri 26/Jan
Air temperature: Studio_COMMUNITY (all year.aps) Air temperature: Living + Dining (all year.aps) Dry-bulb temperature: HeathrowEWY.fwt (HeathrowEWY.fwt)
00:00 02:00 04:00 06:00 08:00 10:00 12:00 14:00 16:00 18:00 20:00 22:00 00:00 30 25 20 15 10 5 0 -5 -10 T e m p e ra tu re ( °C )
Date: Thu 26/Jul
Air temperature: Studio_COMMUNITY (all year.aps) Air temperature: Living + Dining (all year.aps) Dry-bulb temperature: HeathrowEWY.fwt (HeathrowEWY.fwt)
Figure 9: Winter peak day investigation Figure10: Summer peak day investigation
‘Architecture is the masterly, correct and magnificent play of volumes brought together on light…The history of architecture is the history of struggle for light’
Le Corbusier, (1989). The presence of windows allows daylight to enter a space, hence the shape, size and location of windows is of essential importance in order to provide the necessary daylight level for performing various tasks. The studio, which will be used for painting, has specific requirements regarding the quality and amount of interior lighting it gets. Therefore, it is important to have diffuse lighting coming in from the
north and to have an illuminance of between 300 and 1000 lux (CIBSE, 1994). In order to achieve the required light level, the design has to be adjusted to meet the two most important requirements as shown in Figure 11. Adding rooflights will improve not only the light levels, but will also ensure its uniformity to be between 450-650 lux. In this scenario, visual comfort will be achieved, which is usually done by eliminating any causes of visual discomfort called 'discomfort glare' (Bean, 2004)
Figure 11: Light levels in the studio without and with rooflights (in lux)
5 END-USE NEEDS AND RENEWABLE TECHNOLOGIES COMBINATIONS
The total energy consumption is delivered for different end users, where the most important are: o Energy consumption for space heating
o Electricity, and o Domestic hot water.
In Table 4, the main end users taken from the IES modeling of the Poundon house are illustrated: Table 4 Energy breakdown
Using IES monthly loads for electricity, space heating and calculations for hot water demand, a graph which defines what is needed when was drawn up (see Figure 12). Renewable systems will be calculated in order to cover all, or part of, the end user demand. In addition, different systems will be combined to make their collaborative use efficient.
Figure 12: Energy consumption by end users
Figure 12 shows that the energy for space heating is required from October to April, while electricity consumption and hot water demand is constant throughout the whole year. Therefore, this will
be taken into consideration when selecting the appropriate renewable options as they must be at their maximum productivity when they are needed most.
Based on the energy requirement and on the characteristics of each renewable technology, different combinations of different technologies are investigated in order to cover 100% of the energy consumption by renewable energy sources. These are evaluated and calculated in terms of energy and carbon savings. Moreover, a calculation of cost and payback period is also provided. In this paper is illustrated only the best combination considered: PV + Wood fuel boiler.
The evaluation is provided by comparing the renewable technologies with gas and grid suppliers. 5.1. PV + wood fuel boiler
In this combination, the PV system is used to cover the electricity requirement and the hot water demand during the summer, whilst the wood fuel boiler is used to cover the energy requirement for space heating and hot water during the winter.
Energy requirement covered by PV = 2400kWh + 1300kWh = 3700kWh
Energy requirement covered by the wood fuel boiler = 1500kWh + 1300kWh = 2800kWh/year PV system calculations:
These calculations assume that 1kWp of installation produces 800 kWh/year: 1 kWp 800 kWh/yr
x 3700 kWh/yr
x = 4.6kWp 5kWp will produce 4000kWh/year Cost: 1kWp = £2000 cost of 5kWp = £10000
Table 5 Cost and payback period for the PV system
Wood fuel boiler calculations:
The wood fuel boiler system is used to cover 2800kWh/year.
For small domestic application, a stove or a stand-alone room heater can be used. For this design, a pallet boiler that costs £2000 is chosen.
Table 6 Cost and payback period for the wood fuel boiler system
6 CONCLUSION
This paper undertook an analysis of the energy performance and the thermal comfort of a real design of a passive house in the UK climate. In addition different renewable technologies and their combinations were calculated and evaluated. The analysis is based on dynamic modeling provided by Integrated Environment Solution (IES) software. Three different aspects of passive house design (energy
Electricity from
Grid Energy Cost
Payback Period Savings £/year CO2 savings
/year
3700kWh * 0.15£/kWh = £555/year
Income from Feed-in Tariff £551/year
Money saved on bill £122/year
Income from grid export £87/year Total = £760 £1000/£760/yr = 13.1 years 760£/year (after 13.1years) 4000kWh/yr * 0.591kgCO2/kWh =2364kgCO2/yr
Gas Payback Period Savings £/year CO2 savings
/year 2800kWh * 0.05£/kWh = £140/year £2000/£140/yr = 14years 140£/year (after 14years) 2800kWh/yr * 0.206kgCO2/kWh =576.8kgCO2/yr
consumption and carbon emissions, thermal comfort and daylight performance) have been investigated. It is concluded that in order to minimize the energy consumption and carbon emissions, the best orientation of the building for the UK climate is with the long face toward the south. This is due to the largest amount of solar heat gains. Furthermore, two different very common insulation types in UK dwellings (hemp and hempcrete) are investigated for different thickness. It is concluded that because of its better thermal mass capacity than hemp, hempcrete can achieve the best result on the predicted energy consumption. In addition, a thermal comfort analyse is undertaken for the same insulation materials and thickness of 100mm and 400mm. it is founded that with 400mm hempcrete the inside temperature fluctuations are noticeably small compared with the 100mm insulation. It is achieved an constant temperature between 18˚ and 21˚ in winter and between 20˚and 23˚ in summer where the outside temperature is respectively 0˚ and 30˚. Modifying the design has also provided a success in daylighting performance achieving illuminance levels between the benchmark levels of 300lux to 100lux.
It is founded that renewable technologies have great potential to be energy efficient and reduce costs. They either emit no greenhouse gases or they are carbon neutral over their entire lifecycle. From the systems analyzed, only the best system combination considered based on the real situation is provided. The PV system is very effective for the site due to the rural location and the not shaded conditions. In addition, a wood fuel boiler could provide the necessary energy for space heating and hot water due to its high efficiency. Moreover, it can save a considerable amount of carbon emissions compared with gas and electricity.
REFERENCES
Bean, R.2004. Lighting: Interior and Exterior. Oxford: Achitectural Press
Begss, C.2002. Energy: Management, supply and conservation. Oxford: Butterworth-Heinemann. CIBSE. 1994. Code for interior lighting. London: CIBSE Publication.
Le Corbusier. 1989. Towards a New Architecture. Oxford: Butterworth Architecture.
Nicol, F., Humphreys, M. and Roaf, S., (2012). Adaptive thermal comfort: principles and practice. Tonbridge: Routledge Taylor & Francis Group
SEI-Sustainable Energy Ireland. 2007. Passive Homes: Guideline for the design and construction of passive house dwellings in Ireland. [Online]. Available at: http://www.seai.ie/Renewables/Renewable_Energy_Library/PH_Guidelines_July_08.pdf. (Accessed, March 2013)
United Nations. 1997. Kyoto Protocol to the United Nations Framework Convention on Climate Change. Kyoto: United Nations.
UK Green Building Council. 2013. Climate change, energy and carbon emissions. [Online]. Available at: http://www.ukgbc.org/content/key-statistics-0. (Accessed, November 2013)