Studies of Hearing-Aid Outcome Measures in
Older Adults: A Comparison of Technologies
and an Examination of Individual Differences
Larry E. Humes, Ph.D.,1Jayne B. Ahlstrom, M.S.,2Gene W. Bratt, Ph.D.,3and Barbara F. Peek, Ph.D.3
ABSTRACT
This article first compares differences in hearing-aid outcome for groups of older adults fitted with different hearing-aid technologies, ranging from one-channel linear aids with output-limiting compression to four-channel wide-dynamic-range-compression devices with direc-tional microphones. A total of four technologies were examined with 52 to 55 older adults fitted with each technology and assessed with multiple outcome measures. The only significant difference in perform-ance across technologies was superior aided speech recognition in babble for the directional hearing aids when assessed in the sound booth with speech delivered at 0 degrees azimuth and competing babble delivered from 180 degrees azimuth. Importantly, however, all four groups, each with a different technology, demonstrated significant improvements in speech recognition in babble and indicated that they were satisfied with their hearing aids, found them to be beneficial, and used them 7 to 8 hours per day, on average. Given the lack of differences in technology, the data were then pooled across groups to form one large data set of outcome measures from 333 older adults. From these data, guidelines were developed for the interpretation of individual scores from patients in other clinics with similar demo-graphics as being ‘‘below average,’’ ‘‘average,’’ or ‘‘above average.’’ KEYWORDS:Aging, hearing aids, outcome measures
Learning Objectives: As a result of this activity, the participant will be able to (1) compare the average performance of older adults across hearing-aid technologies, and (2) determine if his or her patient performs as expected on various hearing-aid outcome measures.
1Department of Speech and Hearing Sciences, Indiana
University, Bloomington, Indiana; 2Department of Otolaryngology-Head & Neck Surgery, Medical Univer-sity of South Carolina, Charleston, South Carolina;3VA
Tennessee Valley Healthcare System and Vanderbilt University, Nashville, Tennessee.
Address for correspondence and reprint requests: Larry E. Humes, Ph.D., Professor, Department of Speech and
Hearing Sciences, Indiana University, Bloomington, IN 47405 (e-mail: [email protected]).
A Tribute to Fred H. Bess: 40 Years of Influence in Audiology; Guest Editor, Anne Marie Tharpe, Ph.D.
Semin Hear 2009;30:112–128. Copyright#2009 by
Thieme Medical Publishers, Inc., 333 Seventh Avenue, New York, NY 10001, USA. Tel: +1(212) 584-4662. DOI 10.1055/s-0029-1215439. ISSN 0734-0451.
R
oughly 30% of Americans>65 years of age experience hearing loss that is sufficient to disrupt everyday communication.1Estimates of the prevalence of hearing loss among older adults vary with several factors, including the criteria for hearing impairment and the nature of the tools used to identify hearing impair-ment.2–4It appears, however, that only 20% of those older adults with impaired hearing in the United States seek out assistance in the form of hearing aids,5–9a situation common in other countries as well.10,11Of the hearing aids sold in the United States, roughly two thirds are pur-chased by older adults.12,13 Thus, study of hearing-aid outcome in older adults is needed. Ultimately, clinicians would like to dem-onstrate to the patient or a third-party payer that the hearing aids have improved the pa-tient’s well-being and everyday function. Un-fortunately, for the most part, the global measures of functional status available have generally proven to be insensitive to interven-tion with hearing aids in older adults.14–19As a result, although work continues on the devel-opment of communication-sensitive functional assessment tools, research on hearing-aid out-come in older adults has focused on communi-cation-based outcome measures instead.Surprisingly, even in this narrower domain of communication-related function, few studies of multiple outcome measures in >25 to 30 older hearing-aid wearers have been reported. Two exceptions were (1) a series of studies at Indiana University in which>200 older adults were enrolled,20–24and (2) the National Insti-tute on Deafness and Other Communication Disorders (NIDCD)/Veterans Administration (VA) clinical trial of hearing aids in which
>325 older adults participated.25–27An anal-ysis of the outcome measures from all of these studies28 revealed several common aspects or dimensions of communication-related outcome measures. This analysis, together with the analysis of another cohort of older adults wear-ing hearwear-ing aids,29 resulted in the conclusion that three dimensions of hearing-aid outcome are captured by most available measures of communication-related outcome: (1) objective measures of speech-understanding perform-ance; (2) self-report measures of hearing-aid usage; and (3) self-report measures of
hearing-aid benefit and satisfaction (referred to here as ‘‘benefaction’’). Together, these three dimen-sions of outcome typically captured 65–75% of the total variance among the large sets of out-come measures. Furthermore, repeatedly, there was no association found between the first dimension (objective speech understanding) and either of the other two, but the latter two, usage and benefaction, were slightly and positively correlated (r¼0.30, typically). In general, one could assume these three dimen-sions of hearing-aid outcome to be essentially independent. As a result, this requires measures from each dimension to get a complete assess-ment of hearing-aid outcome.
Aside from what should be measured, another important practical issue regarding hearing-aid outcome measures is when they should be obtained. The research conducted at Indiana University represents, to our knowl-edge, both the largest data set available on the longitudinal changes in hearing-aid outcome, with multiple measurement intervals over a period of 1 year (N¼134) and 2 years (N¼47), and also the longest post-fit period of examination (3 years, N¼9).22,23,30 From these and other data,31–33 it can be concluded that valid and reliable communication-related hearing-aid outcome measures can be obtained at 4 to 6 weeks post-fit.
Having resolved some of the fundamental issues as to what to measure and when to measure it, some basic questions remain. One important clinical question is whether different hearing-aid technologies yield dif-ferent outcomes. This was addressed partially by comparing two of the technologies used in earlier stages of the research at Indiana Uni-versity. Humes et al34compared the outcome measures at 1 month and 6 months post-fit obtained from two groups of 50 older adults wearing hearing aids. The two groups were matched carefully for age, gender, hearing loss, and prior hearing-aid experience. One group was fitted with analog single-channel linear hearing aids having output-limiting compression, and the other group was fitted with analog two-channel wide-dynamic-range-compression (WDRC) instruments. Briefly, across all outcome measures and both measurement intervals, no substantial
differences in outcome were observed. Impor-tantly, and sometimes lost in comparisons of technologies,both technologies provided sig-nificant benefits to the groups of wearers.
In this article, we address this issue further by comparing the performance of four groups of 50 individuals across four technologies. The average data presented for the single-channel linear and two-single-channel WDRC analog technologies in this article are essentially iden-tical to the data reported for the 1 month post-fit for these two technologies by Humes et al.34 Here, however, we add data from two addi-tional groups, each also numbering 50 par-ticipants, who were fitted with digital four-channel WDRC hearing aids. These two groups differ only in whether the microphones of the hearing aids were programmed to func-tion as omnidirecfunc-tional or direcfunc-tional (fixed supercardioid) microphones. More details are provided in the next section.
After presenting these group data on sev-eral communication-related outcome measures for four different hearing-aid technologies in the next section, we then turn to an analysis of the individual data. As seen in the next section, few significant differences were observed be-tween technologies. As a result, this afforded us the opportunity to pool these data to form one large data set of 333 older adults and then to analyze the distribution of scores on each out-come measure to define ‘‘average’’ or ‘‘typical’’ performance of older adults on such measures, as well as criteria for ‘‘above-average’’ or ‘‘be-low-average’’ performance. It is hoped that by making these data available, clinicians will have access to technology-independent norms or guidelines for typical or expected outcomes with hearing aids in older adults. Those
iden-tified as performing below average might be identified as patients who may be in need of additional counseling or intervention, more so than those performing at or above average. These individual data are presented after pre-sentation and discussion of the group data in the next section.
GROUP DATA FOR OUTCOME MEASURES FROM DIFFERENT HEARING-AID TECHNOLOGIES
Participants
This section of the article presents the results from several communication-related outcome measures obtained from four groups of older adults, each fitted with a different hearing-aid technology. Table 1 summarizes the demo-graphic characteristics of the four groups of participants included in this report. Note that the four groups are very similar in terms of sample size, age, average high-frequency hear-ing loss, gender composition, and proportion of new hearing-aid users. Univariate analyses of variance (age, average high-frequency hearing loss) and chi-square tests (gender composition, proportion of new users) confirmed the lack of significant differences (p>0.05) across the four groups. The hearing loss configuration and bilateral symmetry also were very similar across the four groups, as indicated by the mean audiograms for the right and left ears in Fig. 1.
Methods
With regard to the hearing aids, as noted, each group was fitted with a different technology.
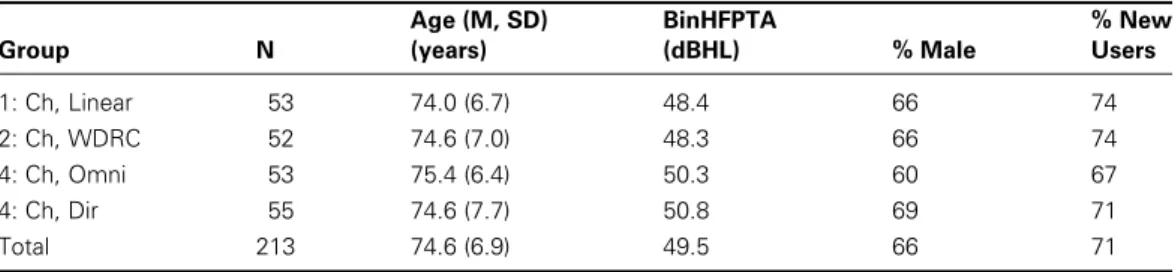
Table 1 Demographic Information of the Study Samples for Each of Four Groups of Older Adults
Group N Age (M, SD) (years) BinHFPTA (dBHL) % Male % New Users 1: Ch, Linear 53 74.0 (6.7) 48.4 66 74 2: Ch, WDRC 52 74.6 (7.0) 48.3 66 74 4: Ch, Omni 53 75.4 (6.4) 50.3 60 67 4: Ch, Dir 55 74.6 (7.7) 50.8 69 71 Total 213 74.6 (6.9) 49.5 66 71
N, number of participants; SD, standard deviation; BinHFPTA, average pure-tone air-conduction hearing thresholds in the right and left ears at 1000, 2000, and 4000 Hz; WDRC, wide-dynamic-range compression.
One group (one-channel linear) received analog single-channel linear devices with output-limit-ing compression housed in full-concha in-the-ear (ITE) shells, another group (two-channel WDRC) received two-channel WDRC circuits housed in in-the-canal shells, and the third and fourth groups received digital four-channel WDRC circuits housed in full-concha ITE shells, with the only difference in these two groups being the directionality of the
micro-phone. Half of the participants for this portion of the study were assigned randomly to the four-channel omnidirectional group, and the other half were assigned randomly to the four-channel directional group. The directional mi-crophone was a fixed supercardioid configura-tion, and its function was verified using Verifit software and hardware (Etymonic Design, Dorchester, Canada). Verification of directional performance was obtained from both hearing Figure 1 (Top) Mean right-ear and (bottom) left-ear air-conduction pure-tone thresholds for each of the four groups of older adults. Each group was fitted with a different hearing-aid technology, as indicated in the figure legend.
aids in an arbitrary sample representing50% of the 108 participants receiving the four-channel devices, about half of whom had their hearing aids programmed to function in direc-tional mode and half in omnidirecdirec-tional mode. The frequency response of the hearing aids programmed for the directional-microphone function was equalized to match the frequency response of the hearing aids when set to the omnidirectional-microphone mode.
The same basic protocol was used to set and verify target gain for each participant in each of the four groups.35 First, based on audiological information obtained from each participant (air-conduction and bone-conduc-tion hearing thresholds, as well as loudness discomfort levels), target 2-cm3-coupler gain values were generated at octave intervals from 250 through 4000 Hz, as well as at 1500, 3000, and 6000 Hz. Hearing aids were adjusted in the 2-cm3coupler for a moderate level input (60 to 70 dB SPL, across studies) to match target in the coupler and were then fitted to the patient and verified using real-ear probe-tube micro-phone measurements. If adjustments to the hearing aid were required to match insertion-gain targets, then after a reasonable match had been obtained using real-ear measurements, defined as within 10 dB of target at 250 through 2000 Hz and within 15 dB of target at higher frequencies, the hearing aid was returned to the 2-cm3 coupler for a final set of coupler gain measurements. These coupler gain values were then recorded for future use (as were the final set of insertion-gain values). The actual prescriptive procedure used to generate gain targets varied across studies with NAL-R36used for the one-channel linear devices, Fig. 637 used for the two-channel WDRC instruments, and NAL-NL138 used for the four-channel digital devices. In some cases, these differences in prescriptive method are attributable to use of linear versus nonlinear devices, whereas in other cases they reflect the chronological development of prescriptive methods as this sequence of studies was being conducted. At the time the study with two-channel WDRC devices was initiated, for ex-ample, NAL-NL1 had not been developed. Furthermore, Fig. 6 generated gain targets for moderate input levels that were similar to those
of NAL-R for the sloping hearing losses expe-rienced by most participants,34at least more so than other nonlinear prescriptive procedures available at the time such as DSLi/o.39 It should be kept in mind that the differences among clinical prescriptive methods is small considering the range of frequency responses found typically to yield equivalent performance on measures of speech recognition and sound quality.40 With each group and technology, software distributed by the developer of the respective prescriptive approach was used to generate targets, rather than the manufacturer’s version of that prescriptive protocol. Within a given group of participants, all were fitted bilaterally with identical make and models of hearing aids. In addition, participants paid the typical clinic price for the devices at the time of delivery and then were paid as research subjects for return visits during which they completed a variety of measures, including the outcome measures described here.
After verification of real-ear gain, the par-ticipant was counseled about the use, function, and care of the hearing aids. The participant returned 2 weeks later, and unaided measures of speech understanding were obtained. Although the specific measures obtained varied somewhat from study to study, one measure in common across all studies was chosen for evaluation here. This was the presentation of the Connected Speech Test (CST)41 at 65 dB SPL from a loudspeaker (Radio Shack Minimus 7) located at 0 degrees azimuth and elevation with the multitalker babble from the CST presented at 57 dB SPL (þ8 dB signal-to-babble ratio) from an identical loudspeaker located at 180 degrees azimuth and 0 degrees elevation. Loudspeakers were located 1 meter from a position corre-sponding to the center of the listener’s head, and all sound levels are specified at this location using the method of substitution.
Approximately 2 to 4 weeks later (4 to 6 weeks post-fit), the participant returned to complete an aided set of CST measurements in identical fashion. All CST scores, aided and unaided, were based on the presentation of two passage pairs including a total of 50 key words. When returning and prior to the speech-rec-ognition testing, the patient’s hearing aids were removed, inspected, and placed in the 2-cm3
coupler to match the gain at 1000 Hz that had been recorded previously at the verification stage. In addition to the completion of the CST under-aided listening conditions, the pa-tient also completed a variety of self-report measures. Although the specific measures com-pleted varied across studies, a set of several measures was common to all studies, and the results of these outcome measures are reported here. The specific self-report outcome meas-ures common across studies were (1) the Hear-ing Aid Performance Inventory (HAPI),42 (2) the Glasgow Hearing Aid Benefit Profile (GHABP),43(3) the MarkeTrak-IV hearing-aid satisfaction survey,44and (4) a hearing-aid usage diary or daily log. Each of these outcome measures was administered in the presence of the clinician and used a paper-and-pencil format.
For the GHABP, only the four prototyp-ical listening situations were used in the earlier studies, and analysis reported here is restricted to scores for these four conditions. In the more recent studies with four-channel digital WDRC devices, the participant was allowed to develop up to four patient-specific listening
situations for use in the GHABP, as has been recommended,43but many patients failed to do so or, when doing so, they could only describe one or two additional listening situations not covered by the prototypical situations required of everyone. In addition, the MarkeTrak-IV satisfaction survey has items that appear in one of three categories: hearing-aid features, listen-ing situations, and dispenser-related items. In our prior use of this survey, we chose to collapse the first two categories into a single global satisfaction rating and ignore the dispenser-related items. To distinguish this usage of the data from the typical item-by-item display of results for the MarkeTrak surveys, we refer to this measure as the Hearing Aid Satisfaction Survey (HASS).21,23
Results and Discussion
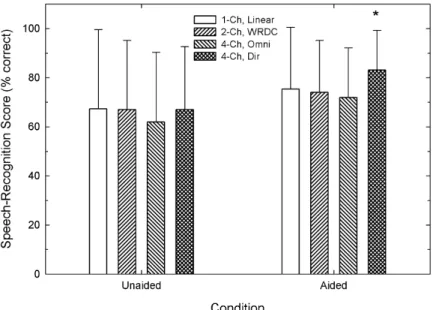
Fig. 2 displays the means and standard devia-tions for each of the four groups for the unaided and aided CST measures. A mixed-model gen-eral linear model (GLM) analysis was used to analyze the data in Fig. 2 with a repeated-measures factor of listening condition (aided
Figure 2 Means and standard deviations (error bars¼1 SD) for the percentage-correct scores from the Connected Speech Test (CST) for each of the four participant groups in this report. Speech was presented at 65 dB SPL and multitalker babble at 57 dB SPL (þ8 dB signal-to-babble ratio) with unaided scores on the left and aided scores on the right. The asterisk signifies that the only significant difference among the four aided CST scores occurred for the four-channel directional hearing aids when compared with two of the other three aided CST scores. See text for further details.
or unaided) and a between-subjects factor of hearing-aid technology. This analysis revealed a significant main effect of listening condition [F(1,209)¼39.9,p<0.01], no significant effect of technology [F(3,209)¼1.2, p>0.1], but a significant interaction between listening condi-tion and technology [F(3, 209)¼2.7,p<0.05]. This pattern of results is interpreted as indicat-ing that aided performance was significantly better than unaided performance for all tech-nologies, but that the magnitude of the differ-ence between aided and unaided listening varied across technologies.
To examine this further, aided and un-aided scores were analyzed for the effects of hearing-aid technology separately, and post hoc paired comparisons were performed as needed. A significant effect of technology or listener group was observed for the aided CST scores only, and post hoc pairwise comparisons revealed that it was the aided CST score for the four-channel directional-microphone instru-ments that was significantly (p<0.05) higher than that of the one-channel linear and four-channel omnidirectional-microphone devices. Given the fixed supercardioid directional char-acteristics of the four-channel hearing aids when programmed for directional mode and the loudspeaker configuration used in this study (speech at 0 degrees and babble at 180
degrees azimuth), it was expected that the aided scores for the directional system would be superior to those of the other instruments. In addition, the lack of a significant difference between groups with regard to unaided per-formance also was expected given the close match among groups in terms of hearing loss (Fig. 1) and age (Table 1).
It is important to emphasize that,in all four listener groups, aided performance was signifi-cantly better than unaided performance for the CST presented at conversational level (65 dB SPL) in multitalker babble at a repre-sentativeþ8 dB signal-to-babble ratio. That is, regardless of technology, when hearing aids were well fit to prescriptive targets, aided per-formance under typical listening conditions was significantly better than unaided performance. In other words, use of hearing aids resulted in higher scores in older adults with impaired hearing, regardless of technology, but in these constrained listening situations (auditory cues only, speech at 0 degrees and competition at 180 degrees, sound-treated booth with no re-verberation) superior aided performance was observed with directional microphones.
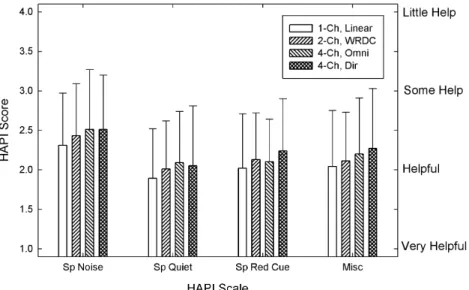
Fig. 3 presents the means and standard deviations for each of the four groups fit with different technologies on the HAPI, a self-report measure of hearing-aid benefit or
Figure 3 Means and standard deviations (error bars¼1 SD) for the four Hearing Aid Performance Inventory (HAPI) subscales and each of the four groups of hearing-aid wearers. Note that lower scores are better on the HAPI.
helpfulness. As recommended by Walden et al,42the 64 items on the HAPI were parti-tioned into four subscales for scoring: (1) speech in noise (Sp Noise); (2) speech in quiet (Sp Quiet); (3) speech with reduced cues (Sp Red Cue), as in communication with another person while not being able to see the talker’s face (in separate rooms, over the telephone, etc.); and (4) miscellaneous (Misc). Note thatlowerscores on the HAPI scale reflect more benefit or greater helpfulness from hearing aids. A mixed-model GLM analysis of the data in Fig. 3 failed to find a significant effect of subject group on any of the HAPI subscales [F(3,208)¼1.1, p>0.1), but the main effect of HAPI subscale was significant [F(3,624)¼58.1,p<0.01] and the interaction between group and subscale was not significant [F(9,624)¼0.6, p>0.1]. Post hoc pairwise comparisons for the significant effect of the HAPI subscale revealed that the scores on the Speech-in-Noise subscale were significantly (p<0.01) higher (worse) than the scores on the other three subscales, and the scores on the Speech-in-Quiet subscale were significantly (p<0.05) lower than the scores on the other three subscales. No other pairwise comparisons for the HAPI subscales were significant.
Thus extensive probing of speech-commu-nication benefits received by the wearers in many everyday listening situations with the HAPI failed to show superiority of one tech-nology over the others. Nonetheless, there were two noteworthy trends in these data. First, on average, the wearers considered their hearing aids, across all technologies, to be helpful. Second, the older adults found the hearing aids, regardless of technology, to be least help-ful in noise and most helphelp-ful in quiet.
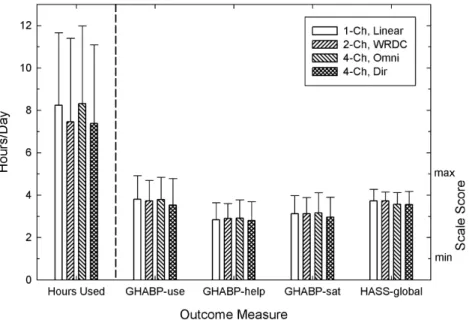
Fig. 4 summarizes the group data for the remaining self-report measures completed by all participants. The means and standard devia-tions from two measures of usage, daily logs of hours used (Hours Used) and GHABP usage ratings (GHABP-use), one measure of benefit or helpfulness from the GHABP (GHABP-help), and two measures of satisfaction, GHABP satisfaction ratings (GHABP-sat) and HASS-global, appear in this figure. The first set of data for Hours Used (left of the vertical dashed line in Fig. 4) should be refer-enced to the left ordinate (Hours/Day), and the remaining four sets of data (to the right of the vertical dashed line) should be referenced to the right ordinate (Scale Score). In all five data sets in this figure, higher scores represent a
Figure 4 Means and standard deviations (error bars¼1 SD) for the (middle) three Glasgow Hearing Aid Benefit Profile (GHABP) scales, (far left) daily use diaries, and (far right) the Hearing Aid Satisfaction Survey (HASS) for each of the four groups. Daily usage logs at the far left make use of the left ordinate (‘‘Hours/ Day’’), whereas the other four self-report measures make use of the right ordinate (‘‘Scale Score’’).
more successful outcome. Separate between-subjects GLM analyses were conducted, one for each of the five outcome measures in Fig. 4, and no significant (p>0.1) differences were observed across groups for any of the outcome measures. Thus the four technologies yielded equivalent self-reported usage, benefit, and satisfaction among older adults wearing hearing aids. Again, however, it is important to note that the average values for each outcome measure, regardless of technology, are quite good. For example, the hearing aids were worn, on average, 7 to 8 hours per day, and the average GHABP and HASS ratings were closer to the maximum end of the scale than the minimum, indicating that the wearers were generally satisfied, received benefit, and used their hearing aids frequently.
The group data presented in Figs. 2, 3 and 4 can be summarized as follows. First, regard-ing differences across the four technologies examined here, only aided CST scores in the sound booth differed significantly across tech-nologies. In particular, the four-channel digital WDRC hearing aids with directional micro-phones yielded significantly higher aided CST scores than the other three technologies. More-over, because one of the other three technolo-gies examined here included hearing aids identical to the directional hearing aids, but with the microphones programmed to be om-nidirectional, one can conclude it is this direc-tional feature of the hearing aids that underlies the significantly higher aided CST perform-ance, rather than the other features of these hearing aids (digital four-channel WDRC). As has been observed previously,45,46however, the advantage of hearing aids with directional mi-crophones measured in the constrained listen-ing conditions of the sound booth often do not generalize to everyday listening situations out-side the sound booth. There were no differ-ences observed across the four hearing-aid technologies for any of the self-report measures of hearing-aid benefit, satisfaction, or usage.
Second, despite the lack of many differ-ences in outcome across technologies, the aver-age data for all four groups were generally quite positive with regard to hearing-aid outcome. That is, on average, older adults wearing hear-ing aids reported that they found the devices to
be helpful, were satisfied with their perform-ance, and used them frequently. In this regard, the group data are similar to the comparison of technologies in the NIDCD/VA clinical trial.25 In that study of >325 hearing-aid wearers, few group differences were observed across the three technologies evaluated. The three hearing-aid technologies evaluated in the NIDCD/VA study, using a within-subject crossover design, were all single channel, with differences in compression characteristics (no compression—linear with peak-clipping, linear with output-limiting compression, and WDRC). In addition, as in the present article, the average performance of the hearing-aid wearers in the NIDCD/VA study also was quite encouraging regarding hearing-aid out-comes, for both objective measures of speech understanding (CST in babble) and self-reported measures of benefit.25–27 Moreover, follow-up studies of various Indiana University and NIDCD/VA cohorts have demonstrated that these positive outcomes are sustained for several years.22,23,30,47,48
Finally, despite the superior performance of the directional-microphone technology for aided CST scores in babble, a detailed survey of the communication difficulties of the older adults while wearing their hearing aids (the HAPI) still revealed significantly less benefit provided by the hearing aids, including those with directional microphones, for speech in noise than for speech in quiet. Thus this remains a challenging listening situation for older adults wearing hearing aids, regardless of technology, and must continue to be ad-dressed in future research.
INDIVIDUAL DIFFERENCES IN OUTCOME MEASURES
REGARDLESS OF TECHNOLOGY Although it is useful to know that hearing aids are beneficial, on average, for older adults with impaired hearing, this general knowledge is of little practical value to clinicians. Clinicians, of course, deal with individual hearing-aid wear-ers and require some means of interpreting individual scores for outcome measures. One approach would simply aim toward every pa-tient achieving scores of 100% on the CST and
ratings of ‘‘very satisfied’’ and ‘‘very helpful’’ for measures of satisfaction and benefit, respec-tively. This is not a very realistic objective. A minimalist approach, in contrast, would be simply to aim toward none of a clinic’s patients being at the bottom of each scale (e.g., 0% on the CST or ‘‘very dissatisfied’’ for satisfaction ratings). This objective is also problematic. Given that the differences in speech recogni-tion for different technologies were not signifi-cant, except for the aided CST with the hearing aids having directional microphones, and as-suming that the subject samples in this report using each technology can be considered typical or representative of older adults in other clinics (see demographics in Table 1), it is both appropriate and informative to pool the data for all outcome measures to form a large data set. From this larger data set, estimates of the median or typical performance can be derived for comparison to scores obtained from other patients in other clinics having similar patient demographics.
If the data from all four studies discussed thus far were pooled, it would represent a total sample of 213 older adults. However, for the study using one-channel linear hearing aids, outcome measures from 1 month post-fit were available for a total of 173 older adults.21 A subset of 53 of these individuals was used in the earlier comparison of technologies to better match the demographics of the other subject samples and to come closer to equating the sample sizes for statistical analysis. To deter-mine whether the data from these additional 120 older adults could be included in this analysis of individual data, the demographic characteristics (gender composition of the group, percentage of new users, ages of the participants and their average high-frequency hearing loss) of each group were compared, as were the groups’ results for the outcome meas-ures included in this article. The high-fre-quency-average hearing loss of the larger group (N¼120) was 3.5 dB worse than that of the smaller group (N¼53), and this differ-ence was significant (p<0.05). In addition, there were fewer new hearing-aid users in the larger group (55%) compared with the smaller group (74%), and this difference was significant (p<0.05). Other than these two differences,
however, there were no significant differences in demographics or hearing-aid outcome be-tween the smaller and larger groups fitted with one-channel linear devices. These differences were considered to be minor, and the data for these 120 older adults were added to the data set to form a larger data set based on the results from 333 older adults. The demographics for this larger group of 333 older adults were as follows: (1) mean age of 73.9 years (SD, 6.8 years; range, 60 to 89 years), (2) mean binaural high-frequency pure-tone average of 50.4 dB HL (SD, 10.6 dB HL; range, 22 to 80 dB HL), (3) 67% men, and (4) 65.5% new hearing-aid users. Not surprisingly, these val-ues are very similar to those shown previously at the bottom of Table 1 for the 213 older adults included in the comparison of hearing-aid technologies.
Fig. 5 provides a cumulative distribution of the HAPI subscale scores for the 333 older adults included in this portion of the report. Notice that the scores for three of the four HAPI subscales could be reasonably repre-sented by a single cumulative distribution. Only the speech-in-noise subscale, which gen-erally gave higher (worse) estimates on the inverted helpfulness scale of the HAPI, re-quires separate interpretation. The horizontal dashed line at a proportion of 0.5 corresponds to the group median. Fifty percent of the group scored at or above the median, and the other half scored below the median. Thus, if the HAPI ratings are assigned numerical scores, as in this report, with ‘‘Very Helpful’’¼1, ‘‘Helpful’’¼2, and so on, and then mean sub-scale scores are calculated using the subsub-scales described by Walden et al42for a given patient, one can compare that patient’s calculated sub-scale scores to the median or ‘‘average’’ per-formance of a similar group of older adults to determine whether the patient is performing as expected, ‘‘above average,’’ or ‘‘below average.’’ The vertical dashed arrows extend from the intersection of the 0.5 proportion horizontal line with the cumulative distributions to the abscissas to facilitate this use of these data. Except for the speech-in-noise subscale of the HAPI, for example, the average rating should be ‘‘helpful’’ with a corresponding numerical value of2. For the speech-in-noise subscale
of the HAPI, the corresponding numerical value representing ‘‘average’’ or ‘‘typical’’ per-formance would be a rating of2.4.
Fig. 6 illustrates similar cumulative distri-butions for the three scales from the GHABP (unfilled symbols), plus a derived scale for ‘‘benefaction’’ (filled symbols), which is simply the arithmetic average of each patient’s help-fulness and satisfaction ratings from the GHABP. Notice that the distributions are not as smooth as they were for the HAPI. This is likely the result, in part, of the small number of items (four) averaged for each scale of the GHABP when deriving the scale score. Nonetheless, the median can again be deter-mined (horizontal dashed line) for each scale and then used to interpret the scores of other patients as ‘‘average,’’ ‘‘above average,’’ or ‘‘below average,’’ as desired. For the GHABP, the helpfulness, satisfaction, and derived bene-faction scales can be represented by the same median score of 3 and the use scale by a median score of 4. This suggested scoring differs from that recommended for the GHABP,43but it is considerably easier to implement. In addition, because several prior factor analyses of
hearing-aid outcome measures have found measures of self-reported benefit and satisfaction to be very highly correlated, it is recommended here that the results of these two scales be combined for a more reliable eight-item measure of ‘‘benefac-tion’’ with a median of 3.0. Moreover, given the small number of items in the scale, individual GHABP scale scores are easier to calculate, even with eight items for the benefaction measure, than HAPI scores. It should be noted that, as described earlier in this article, the GHABP scores reported here were based on ratings for only the four prototypical listening situations included for all patients; none of the open-ended patient-generated listening situa-tions were included in the score calculasitua-tions. If one wishes to use the norms in Fig. 6 clinically, it is important that the GHABP scores be computed in a manner identical to that used for the norms.
When comparing individual scores from patients to norms derived in this article, it would be helpful to have a range of values around the median that could be considered representative of ‘‘average’’ or ‘‘typical’’ perform-ance on that outcome measure. One possible Figure 5 Cumulative distribution of HAPI (Hearing Aid Performance Inventory) subscale scores for 333 older adults. Horizontal dashed line at a proportion of 0.5 represents the median or 50th percentile. The vertical dashed arrows show the approximate values that correspond to the medians for each subscale. Exact values are provided in Table 2.
approach to doing so is illustrated via the cumulative distributions for the remaining hearing-aid outcome measures in this report shown in Fig. 7. Here there are three horizontal dashed lines in each panel, and each panel shows the cumulative distribution for a different outcome measure. The middle horizontal dashed line in each panel of Fig. 7 marks the median, as in the two previous figures. The other two horizontal dashed lines in each panel mark the 75th (upper line) and 25th (lower line) percentiles and together demarcate the inter-quartile range for each outcome measure. There are various ways in which these horizontal boundaries could be applied to interpret indi-vidual data. For example, one could use the entire interquartile range as a region of ‘‘aver-age’’ or ‘‘typical’’ performance and the other two regions, above the 75th percentile and below the 25th percentile, could be considered regions for ‘‘above-average’’ and ‘‘below-average’’ scores, respectively. Alternatively, scores corresponding to the upper quartile (>75th percentile) could be considered to be ‘‘well above average,’’ be-tween the 50th and 75th percentile as ‘‘above average,’’ 25th to 50th percentile as ‘‘below average,’’ and the lower quartile (<25th per-centile) as ‘‘well below average.’’ Regardless of
the labels chosen, it should be possible to use the cumulative distributions provided in Figs. 5–7 for the hearing-aid outcome measures in this article to interpret individual outcome measures from patients at other clinics with similar demographics and use of the same out-come measures. To facilitate this usage of these data, Table 2 provides the numerical values corresponding to the 25th, 50th, and 75th percentiles for the cumulative distributions of the scores from the 333 older adults in this study.
Of the guidelines or norms provided in Table 2, probably the most problematic is that for aided CST scores. The guidelines for this measure simply provide an expected ‘‘average’’ aided score, but the aided score is moderately and significantly correlated with the unaided CST score (r¼0.62; p<0.001) and aver-age high-frequency hearing loss (r¼–0.44;
p<0.001). The unaided CST score, in turn, is moderately and significantly correlated with average high-frequency hearing loss (r¼ –0.66; p<0.001). Of the outcome measures described in this report, aided CST perform-ance was the only one that was moderately correlated with hearing loss. As a result, the accuracy of the guidelines provided in Table 2 Figure 6 Cumulative distribution of Glasgow Hearing Aid Benefit Profile (GHABP) subscale scores for 333 older adults. Horizontal dashed line at a proportion of 0.5 represents the median or 50th percentile. The vertical dashed arrows show the approximate values that correspond to the medians for each subscale. Exact values are provided in Table 2.
for this outcome measure will vary systemati-cally as the amount of high-frequency hearing loss deviates from the average for the group of 333 participants.
To compensate for this inherent inaccur-acy, one could provide norms for aided CST scores broken down by severity of high-fre-quency hearing loss, or alternatively, by unaided Figure 7 Cumulative distributions of (top) aided Connected Speech Test (CST) scores, (middle) hearing-aid usage from daily logs, and (bottom) Hearing Aid Satisfaction Survey (HASS) or MarkeTrak satisfaction survey scores for 333 older adults. Horizontal dashed lines show the scores in each panel that correspond to the 25th, 50th (median), and 75th percentiles. Exact values for each percentile shown are provided in Table 2.
CST scores. The latter approach was chosen here because it is recommended that both un-aided and un-aided CST scores be obtained for a given hearing-aid wearer with the aided scores interpreted according to these guidelines and the difference between aided and unaided scores considered relative to 95% critical differences for speech-recognition scores based on 50 items.49That is, consideration should be given to whether the aided performance of the patient is ‘‘average,’’ ‘‘above average,’’ or ‘‘below average’’
and to whether the aided performance repre-sents a significant improvement from unaided performance. Table 3 provides median and interquartile range values for aided CST scores when unaided CST scores were binned into five groups that were roughly equal in size. This allowed for a sufficient sample size in each bin (n¼51 to 78) on which to base the medians and interquartile ranges while still providing a more accurate prediction of aided CST performance.
The information included in Table 3 could be used as follows. Once the clinician has obtained the unaided CST score, this score will be found in one of the five ‘‘unaided CST’’ bins in the first column. The ‘‘aided CST’’ columns then provide the 25th, 50th, and 75th percentiles for the aided CST scores, given an unaided CST score in the specified range. It will then be possible to determine
whether that individual’s aided CST perform-ance is ‘‘average,’’ ‘‘above average,’’ and so on. Again, as is the case for all of the norms provided in Tables 2 and 3, it is critical that the scores be obtained by the clinician in the same manner as the scores comprising the norms. For the aided (and unaided) CST, this means using commercially available re-corded materials, with the speech presented at 0 degrees azimuth and elevation at a sound level of 65 dB SPL and the multitalker babble presented at 180 degrees azimuth at a sound level of 57 dB SPL (þ8 dB speech-to-babble
Table 3 Quartiles for Aided CST Scores Derived for Subgroups of 333 Older Adults Based on Unaided CST Percent-Correct Performance Unaided CST Score Range (%) N 25th Percentile 50th Percentile 75th Percentile 0–34 66 28 54 70 36–68 73 66 74 82 70–80 61 70 82 90 82–90 78 80 88 94 92–100 51 84 92 96
Note: The ‘‘bins’’ for unaided Connected Speech Test (CST) scores were based on 20th, 40th, 60th, and 80th percentiles for the unaided scores, then adjusted slightly up or down to the nearest possible CST score (that this, the closest even whole-number score, given 50 items per score). The same slight adjustments were made for the aided CST quartiles.
Table 2 Quartiles for the Cumulative Distributions of Scores for the Hearing-Aid Outcome Measures from 333 Older Adults
Outcome Measure 25th Percentile 50th Percentile 75th Percentile
HAPI speech in noise 2.75 2.36 1.95
HAPI speech in quiet 2.18 1.95 1.55
HAPI speech with reduced cues 2.49 2.08 1.62
HAPI miscellaneous 2.36 2.00 1.64 GHABP use 3.00 4.00 5.00 GHABP helpfulness 2.25 3.00 3.50 GHABP satisfaction 2.75 3.25 3.75 GHABP benefaction* 2.62 3.02 3.65 CST aided, 65 dB SPL,þ8 dB SNR 64.50 80.00 90.00y
Daily usage (diary entries) 5.24 8.33 11.10
HASS (satisfaction survey) 3.38 3.70 4.06
*GHABP-benefaction scores are the arithmetic mean of the GHABP-helpfulness and the GHABP-satisfaction scores. yCST scores are percent-correct scores. Speech is presented at 0 degrees azimuth and noise at 180 degrees azimuth. HAPI, Hearing Aid Performance Inventory; GHABP, Glasgow Hearing Aid Benefit Profile; CST, Connected Speech Test; SNR, signal-to-noise ratio; HASS, Hearing Aid Satisfaction Survey.
ratio). Moreover, these assessments, aided and unaided, were all obtained binaurally in the sound field.
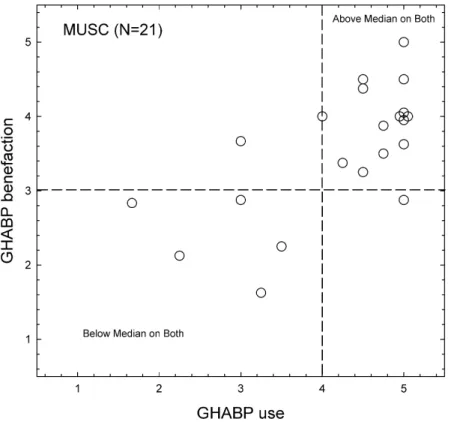
To illustrate the use of the GHABP norms provided in this report, data from 21 adult hearing-aid wearers evaluated at the Medical University of South Carolina were examined. The demographic characteristics of this group were very similar to those shown previously in Table 1 for the groups in the various Indiana University studies. Individuals were fitted bilaterally with digital four-channel WDRC ITE hearing aids pro-grammed to match NAL-NL1 targets. For these 21 hearing-aid wearers, GHABP meas-ures were completed 3 to 6 months after hearing-aid fit. Fig. 8 plots the results from these older adult hearing-aid wearers in a two-dimensional space with GHABP use on the abscissa and GHABP benefaction on the or-dinate. Dashed vertical and horizontal lines mark the median values along each axis from the norms in Table 2. The 14 data points in
the upper right quadrant demarcated by these dashed lines represent 14 hearing-aid wearers who scored ‘‘at or above average’’ on both
GHABP measures. In a similar manner, those data points in the lower left quadrant repre-sent the GHABP results from five older adults who performed ‘‘below average’’ on both of these outcome measures. In addition, two remaining cases fall in the other quadrants, representing below-average performance on only one of the two GHABP measures. Based on this type of analysis, 5 of the 21 cases (those with below-average performance on both GHABP measures) might be considered to be ‘‘at risk’’ for hearing-aid rejection because of the less-than-average performance on these hearing-aid outcome measures. Finally, it should be noted that Fig. 8 provided data for only two of the three outcome dimensions needed for a complete evaluation of outcome. CST scores, however, were not obtained from these 21 older adults and could not be con-sidered in this example.
Figure 8 Scatterplot of individual data from 21 older hearing-aid wearers tested at the Medical University of South Carolina. Dashed lines represent the median values from Table 2 for each of the Glasgow Hearing Aid Benefit Profile (GHABP) outcome measures shown.
The primary purpose of labeling or cate-gorizing the performance of older hearing-aid wearers based on these norms would be to enable early and additional intervention for those patients with outcome measures ‘‘below average.’’ The additional intervention could be in the form of counseling, additional train-ing in communication strategies, or auditory training. The group data presented earlier, however, suggest that the answer does not lie in the technology alone because there were no appreciable differences in outcome when technology was varied from one-channel analog linear devices to four-channel digital WDRC devices (with or without directional microphones). To increase the percentage of older adults with impaired hearing who pur-chase hearing aids (i.e., an increase from 20% market penetration), improvement in out-come through counseling, training, or both appears to be critical. This especially is true in the area for which the technology remains most limited: the understanding of speech in the presence of background competition, fre-quently other speech. In addition to pointing toward the need for additional interventions, such a categorization of outcomes may lead the clinician to closer scrutiny of the hearing-aid fits, including audibility considerations, for those individuals performing below aver-age in multiple dimensions.
ACKNOWLEDGMENTS
This work was supported, in part, by a grant from the National Institute on Aging (R01 AG 08293) and in part by research grants P50 DC00422 and R01 DC00184 from NIH/ NIDCD and the MUSC General Clinical Research Center (M01 RR01070).
REFERENCES
1. Schoenborn CA, Marano M. Current estimates from the National Health Interview Survey. Vital Health Stat 10 1988;166:1–233
2. Ventry IM, Weinstein BE. The hearing handicap inventory for the elderly: a new tool. Ear Hear 1982;3:128–134
3. Lichtenstein MJ, Bess FH, Logan SA. Validation of screening tools for identifying hearing-impaired
elderly in primary care. JAMA 1988;259:2875– 2878
4. Bess FH, Lichtenstein MJ, Logan SA, Burger MC. Comparing criteria of hearing impairment in the elderly: a functional approach. J Speech Hear Res 1989;32:795–802
5. Kochkin S. MarkeTrak III: why 20 million in U.S. don’t use hearing aids for their hearing loss. Part I. Hearing J 1993a;46:20–27
6. Kochkin S. MarkeTrak III: why 20 million in U.S. don’t use hearing aids for their hearing loss. Part II. Hearing J 1993b;46:26–31
7. Kochkin S. MarkeTrak III: why 20 million in U.S. don’t use hearing aids for their hearing loss. Part III. Hearing J 1993c;46:36–37
8. Kochkin S. MarkeTrak V: consumer satisfaction revisited. Hearing J 2000;53:38–55
9. Kochkin S. MarkeTrak VII: hearing loss popula-tion tops 31 million. Hear Rev 2005;12:16–29 10. Ward JA, Lord SR, Williams P, Anstey K.
Hearing impairment and hearing aid use in women over 65 years of age. Cross-sectional study of women in a large urban community. Med J Aust 1993;159:382–384
11. Smeeth L, Fletcher AE, Ng ES, et al. Reduced hearing ownership, and use of hearing aids in elderly people in the UK—the MRC trial of the assessment and management of older people in the community: a cross-sectional survey. Lancet 2002; 359:1466–1470
12. Skafte MD. The 1999 hearing instrument mar-ket—the dispenser’s perspective. Hear Rev 2000;7: 8–40
13. Stro¨m KE. The HR 2006 dispenser survey. Hear Rev 2006;13(6):16–39
14. Bess FH, Lichtenstein MJ, Logan SA, Burger MC, Nelson EC. Hearing impairment as a determinant of function in the elderly. J Am Geriatr Soc 1989;37:123–128
15. Bess FH, Logan SA, Lichtenstein MJ. Functional impact of hearing loss on the elderly. In: Cherow E, ed. Proceedings of the Research Symposium in Communication Sciences and Disorders and
Aging. ASHA Reports, 19. Rockville, MD:
American Speech-Language-Hearing Association; 1990
16. Bess FH, Lichtenstein MJ, Logan SA. Making hearing impairment functionally relevant: linkages with hearing disability and handicap. Acta Oto-laryngol Suppl 1990;476:226–231
17. Crandell C. Hearing aids: their effects on func-tional health status. Hearing J 1998;51:22–30 18. Bess FH. The role of generic health-related
quality of life measures in establishing audiological rehabilitation outcomes. Ear Hear 2000;21:74S– 79S
19. Crandell CC, Lewis MS, Valente M, Enrietto J, Kreisman BM, Kreisman NV. Functional health
benefits of hearing aid and FM systems. In: Seewald R, ed. ACCESS: Achieving Clear Communication Employing Sound Solutions. Sta¨fa, Switzerland: Phonak AG; 2003:53–59 20. Humes LE. Issues in evaluating the effectiveness
of hearing aids in the elderly: what to measure and when. Semin Hear 2001;22:303–314
21. Humes LE, Garner CB, Wilson DL, Barlow NN. Hearing-aid outcome measures following one month of hearing aid use by the elderly. J Speech Lang Hear Res 2001;44:469–486
22. Humes LE, Wilson DL, Barlow NN, Garner CB. Measures of hearing-aid benefit following 1 or 2 years of hearing-aid use by older adults. J Speech Lang Hear Res 2002a;45:772–782
23. Humes LE, Wilson DL, Barlow NN, Garner CB, Amos NE. Longitudinal changes in hearing-aid satisfaction and usage in the elderly over a period of one or two years after hearing-aid delivery. Ear Hear 2002b;23:428–437
24. Humes LE. Factors underlying the speech-recognition performance of elderly hearing-aid wearers. J Acoust Soc Am 2002;112:1112–1132 25. Larson VD, Williams DW, Henderson WG, et al.
Efficacy of 3 commonly used hearing aid circuits: a crossover trial. JAMA 2000;284:1806–1813 26. Haskell GB, Noffsinger D, Larson VD, Williams
DW, Dobie RA, Rogers JL. Subjective measures of hearing aid benefit in the NIDCD/VA clinical trial. Ear Hear 2002;23:301–307
27. Shanks JE, Wilson RH, Larson VD, Williams D. Speech recognition performance of patients with sensorineural hearing loss under unaided and aided conditions using linear and compression hearing aids. Ear Hear 2002;23:280–290 28. Humes LE. Modeling and predicting hearing-aid
outcome. Trends Amplif 2003;7:41–75
29. Humes LE. Hearing-aid outcome measures in older adults. In: Palmer CA, Seewald RC, eds. Hearing Care for Adults 2006. Sta¨fa, Switzerland: Phonak AG; 2007:265–276
30. Humes LE, Wilson DL. An examination of the changes in hearing-aid performance and benefit in the elderly over a 3-year period of hearing-aid use. J Speech Lang Hear Res 2003;46: 137–145
31. Turner CW, Humes LE, Bentler R, Cox RM. A review of past research on changes in hearing-aid benefit over time. Ear Hear 1996;17:14S– 28S
32. Saunders GH, Cienkowski KM. Acclimatization to hearing aids. Ear Hear 1997;18:129–139 33. Surr RK, Cord MT, Walden BE. Long-term
versus short-term hearing aid benefit. J Am Acad Audiol 1998;9:165–171
34. Humes LE, Humes LE, Wilson DL. A comparison of single-channel linear amplification and two-channel wide-dynamic-range-compression
amplifi-cation by means of an independent-group design. Am J Audiol 2004;13:39–53
35. Humes LE, Barlow NN, Garner CB, Wilson DL. Prescribed clinician-fit versus as-worn coupler gain in a group of elderly hearing-aid wearers. J Speech Lang Hear Res 2000;43:879–892 36. Byrne D, Dillon H. The National Acoustic
Laboratories’ (NAL) new procedure for selecting the gain and frequency response of a hearing aid. Ear Hear 1986;7:257–265
37. Killion MC, Fikret-Pasa S. The 3 types of sensorineural hearing loss: loudness and intelligi-bility considerations. Hearing J 1993;46:1–4 38. Dillon H, Byrne D, Brewer S, Katsch R, Ching T,
Keidser G. NAL NonlinearVersion 1.01 User Manual. Chatswood, Australia: National Acous-tics Laboratories; 1998
39. Cornelisse LE, Seewald R, Jamieson D. The input/output formula: a theoretical approach to the fitting of personal amplification devices. J Acoust Soc Am 1995;97:1854–1864
40. Van Buuren RA, Festen JM, Plomp R. Evaluation of a wide range of amplitude-frequency responses for the hearing impaired. J Speech Hear Res 1995;38:211–221
41. Cox RM, Alexander GC, Gilmore C. Develop-ment of the Connected Speech Test (CST). Ear Hear 1987;8(5, Suppl):119S–126S
42. Walden BE, Demorest ME, Hepler EL. Self-report approach to assessing benefit derived from amplification. J Speech Hear Res 1984;27:49–56 43. Gatehouse S. Glasgow Hearing Aid Benefit
Profile: derivation and validation of a client-centered outcome measure for hearing aid services. J Am Acad Audiol 1999;10:80–103
44. Kochkin S. MarkeTrak IV: 10-year trends in the hearing aid market—has anything changed? Hear-ing J 1996;49:1–6
45. Walden BE, Surr R, Cord M, Dyrlund O. Predicting hearing aid microphone preference in everyday listening. J Am Acad Audiol 2004;15:365– 396
46. Cord MT, Surr RK, Walden BE, Dyrlund O. Relationship between laboratory measures of directional advantage and everyday success with directional microphone hearing aids. J Am Acad Audiol 2004;15:353–364
47. Shanks JE, Wilson RH, Stelmachowicz P, Bratt GW, Williams DW. Speech-recognition perform-ance after long-term hearing aid use. J Am Acad Audiol 2007;18:292–303
48. Takahashi G, Martinez CD, Beamer S, et al. Subjective measures of hearing aid benefit and satisfaction in the NIDCD/VA follow-up study. J Am Acad Audiol 2007;18:323–349
49. Thornton ARD, Raffin MJM. Speech-discrim-ination scores modeled as a binomial variable. J Speech Hear Res 1978;21:507–518