2018
A regional information-based multi-attribute and
multi-objective decision-making approach for
sustainable supplier selection and order allocation
Kijung Park
Incheon National University
Gül E. Okudan Kremer
Iowa State University, [email protected]
Junfeng Ma
Mississippi State University
Follow this and additional works at:https://lib.dr.iastate.edu/imse_pubs
Part of theIndustrial Engineering Commons,Operational Research Commons, and theSystems Engineering Commons
The complete bibliographic information for this item can be found athttps://lib.dr.iastate.edu/ imse_pubs/177. For information on how to cite this item, please visithttp://lib.dr.iastate.edu/ howtocite.html.
This Article is brought to you for free and open access by the Industrial and Manufacturing Systems Engineering at Iowa State University Digital Repository. It has been accepted for inclusion in Industrial and Manufacturing Systems Engineering Publications by an authorized administrator of Iowa State University Digital Repository. For more information, please [email protected].
making approach for sustainable supplier selection and order allocation
Abstract
Although extant studies proposed various models and frameworks for sustainable supplier selection problems, they paid limited attention to the incorporation of regional economic, social, and environmental factors simultaneously for global supply chain design due to the difficulty in reflecting varies dimensions of the global business environment and their associated risk in a decision model. Existing supplier selection models also tend to focus on the formulation of a simplified supply chain structure rather than considering more realistic supply chain operations under multiple sourcing and product designs. To facilitate the complex decision-making process of global supplier selection problems, this study proposes an integrated approach that consists of two phases to effectively reflect the multi-perspectives of global supply chain design for sustainability. The first phase identifies sustainable supplier regions through multi-attribute utility theory, considering four regional sustainability indices for economic and social factors in global business and logistics, to reflect the decision maker's risk attitudes on global business opportunities. In the second phase, a multi-objective integer linear programming model for multiple sourcing and multiple product designs that minimizes economic and environmental objectives is applied to find optimal suppliers in the regions selected from the first phase and their order quantities. The proposed approach is illustrated through a bicycle supplier selection case study. The results show that the multi-objective sustainable decision under a multiple sourcing strategy for different product designs leads to a supply chain that is significantly different from the single-objective non-sustainable decisions. The case study under different decision scenarios shows that a decision maker should hold a balanced perspective under the multi-objective decision environment for sustainable supply chain design.
Keywords
Supplier selection, Order allocation, Sustainable global supply chain, Multi-attribute utility theory (MAUT), Multi-objective integer linear programming (MOILP)
Disciplines
Industrial Engineering | Operational Research | Systems Engineering
Comments
This is a manuscript of the article Park, Kijung, Gül E. Okudan Kremer, and Junfeng Ma. "A regional information-based multi-attribute and multi-objective decision-making approach for sustainable supplier selection and order allocation." Journal of Cleaner Production(2018). DOI:10.1016/j.jclepro.2018.03.035. Posted with permission.
Creative Commons License
This work is licensed under aCreative Commons Attribution-Noncommercial-No Derivative Works 4.0
License.
A regional information-based multi-attribute and multi-objective decision-making approach for sustainable supplier selection and order allocation
Kijung Park, Gül E. Okudan Kremer, Junfeng Ma PII: S0959-6526(18)30686-3 DOI: 10.1016/j.jclepro.2018.03.035
Reference: JCLP 12293
To appear in: Journal of Cleaner Production
Received Date: 21 July 2017 Revised Date: 5 January 2018 Accepted Date: 4 March 2018
Please cite this article as: Park K, Okudan Kremer GüE, Ma J, A regional information-based multi-attribute and multi-objective decision-making approach for sustainable supplier selection and order allocation, Journal of Cleaner Production (2018), doi: 10.1016/j.jclepro.2018.03.035.
This is a PDF file of an unedited manuscript that has been accepted for publication. As a service to our customers we are providing this early version of the manuscript. The manuscript will undergo copyediting, typesetting, and review of the resulting proof before it is published in its final form. Please note that during the production process errors may be discovered which could affect the content, and all legal disclaimers that apply to the journal pertain.
M
AN
US
CR
IP
T
AC
CE
PT
ED
A regional information-based multi-attribute and multi-objective decision-making approach for sustainable supplier selection and order allocation
Kijung Parka*, Gül E. Okudan Kremerb, Junfeng Mac
a
Department of Industrial and Management Engineering, Incheon National University, 22012, Korea.
b
Department of Industrial and Manufacturing Systems Engineering, Iowa State University, IA 50011, USA.
c
Department of Industrial and Systems Engineering, Mississippi State University, MS 39762, USA.
*Corresponding author.
M
AN
US
CR
IP
T
AC
CE
PT
ED
AbstractAlthough extant studies proposed various models and frameworks for sustainable supplier selection problems, they paid limited attention to the incorporation of regional economic, social, and environmental factors simultaneously for global supply chain design due to the difficulty in reflecting varies dimensions of the global business environment and their associated risk in a decision model. Existing supplier selection models also tend to focus on the formulation of a simplified supply chain structure rather than considering more realistic supply chain operations under multiple sourcing and product designs. To facilitate the complex decision-making process of global supplier selection problems, this study proposes an integrated approach that consists of two phases to effectively reflect the multi-perspectives of global supply chain design for sustainability. The first phase identifies sustainable supplier regions through multi-attribute utility theory, considering four regional sustainability indices for economic and social factors in global business and logistics, to reflect the decision maker’s risk attitudes on global business opportunities. In the second phase, a multi-objective integer linear programming model for multiple sourcing and multiple product designs that minimizes economic and environmental objectives is applied to find optimal suppliers in the regions selected from the first phase and their order quantities. The proposed approach is illustrated through a bicycle supplier selection case study. The results show that the multi-objective sustainable decision under a multiple sourcing strategy for different product designs leads to a supply chain that is significantly different from the single-objective non-sustainable decisions. The case study under different decision scenarios shows that a decision maker should hold a balanced perspective under the multi-objective decision environment for sustainable supply chain design.
Keywords: Supplier selection; Order allocation; Sustainable global supply chain; Multi-attribute utility theory (MAUT); Multi-objective integer linear programming (MOILP)
M
AN
US
CR
IP
T
AC
CE
PT
ED
1. IntroductionNowadays companies are urged to appropriately respond to customer expectations of higher quality, lower price, shorter lead time, and less environmental impact so that they can gain business competitiveness in marketplaces; in response, many companies strive to improve their supply chain operations. Supplier selection and order allocation are essential decision steps in supply chain design to reduce purchasing costs, supply related risks, and environmental impacts as well as to improve corporate price competitiveness (Azadnia et al., 2015; Kannan et al., 2013; Mafakheri et al., 2011). Indeed, supplier selection and order allocation should be properly handled since they can significantly affect not only associated manufacturing and logistics activities (Bai and Sarkis, 2010; Rao, 2002) but also overall company reputation (Goebel et al., 2012).
Due to the importance of supplier selection and order allocation, various decision approaches and frameworks have been proposed in the literature to guide decision-making in supply chain design (Aissaoui et al., 2007; Govindan et al., 2015; Setak et al., 2012). However, there still exist several issues that should be addressed to have a more effective decision-making process for supplier selection and order allocation. First of all, the extent to which previous studies of supply chain management covered the integration of economic, social, and environmental dimensions of sustainability for sustainable supply chains was limited (Hassini et al., 2012; Seuring, 2013) although environmental sustainability has been widely addressed in supplier selection decision-making (Govindan et al., 2015). This issue has been prevalently raised in supplier selection studies; economic and social perspectives in addition to environmental perspectives should be considered for supply chain management based on the widely accepted conceptualization of sustainability (i.e., economic, social, and environmental sustainability) (Govindan et al., 2013; Luthra et al., 2017; Mangla et al., 2014).
M
AN
US
CR
IP
T
AC
CE
PT
ED
Moreover, region-specific advantages and governmental policies should be considered as significant aspects of supplier selection given the advent of globalization in business (Maltz et al., 2011; Schneider et al., 2013). The geographical and regional differences of potential suppliers can have implications on the decision-making process of supplier selection and thus the competitiveness of global supply chains (Meixell and Gargeya, 2005). For example, the advantages of global outsourcing strategies can be successfully achieved from understanding tangible and intangible regional distance (e.g., cultural, political, geographic, and economic) (Ghemawat, 2001) and finding appropriate regions with business friendly conditions (e.g., labor cost, intellectual property protection, and workplace safety) (Maltz et al., 2011). However, the consideration of regional factors is often disregarded in supplier selection research despite the importance of region selection for global supply chains. Therefore, most studies tend to limit their models to a local supply chain design problem, which is mainly influenced by certain supplier information. A decision problem for supplier selection and order allocation would be more uncertain at a global supply chain level; and the selection of supplier regions is largely affected by a decision-maker’s risk attitudes toward global business opportunities (Min, 1994). Nevertheless, the selection of supplier regions is usually treated in an ad hoc manner due to the difficulty in formulating both regional information and decision risk attitudes in a single decision-making model.
The majority of studies in supplier selection and order allocation focused on either a multi-criteria decision technique or a mathematical optimization model for describing a conceptual or a simple supply chain configuration (Aissaoui et al., 2007; Govindan et al., 2015), exploiting the easiness in decision problem formulation. However, more realistic supply chains that consider multiple suppliers for each order and multiple product designs should be taken into account in supplier selection and order allocation.
M
AN
US
CR
IP
T
AC
CE
PT
ED
Focusing on the above issues in supplier selection, this research proposes a sustainable supplier selection approach that reflects not only the economic and social aspects of regions for global business and logistics but also the economic, environmental, and delivery reliability factors of potential suppliers. The proposed approach facilitates a complex decision-making process in global supply chain design by separating supplier region selection and final supplier selection through two main phases: (1) the supplier region selection phase to identify sustainable supplier locations for global supply chain design, and (2) the supplier selection and order allocation phase to determine sustainable supplier candidates in the selected regions along with optimal order quantities. In the first phase, an aggregate multi-attribute utility function to facilitate the decision maker’s preference assessment for supplier region selection is formulated based on regional ranking data from the World Bank Group
(www.worldbank.org) and the World Economic Forum (www.weforum.org). Then, a
multi-objective integer linear programming model for multiple sourcing and multiple product designs, which considers total cost, carbon footprint (CF), order defect, and delivery delay as multi-objectives to be minimized respectively, is developed to find a set of optimal suppliers in the selected regions and along with specific order quantities.
This paper is organized as follows: Section 2 summarizes the pertinent literature on sustainable supplier selection and order allocation. Based on the research gap identified in Section 2, Section 3 proposes a two-phased approach for sustainable global supplier selection and order allocation and illustrates a bicycle manufacturing case study. Section 4 implements the proposed methodology and discusses related results. Section 5 concludes this paper and addresses plans for future work.
M
AN
US
CR
IP
T
AC
CE
PT
ED
2. A Summary of Research on Sustainable Supplier Selection and Order Allocation
A supplier selection and purchasing process commonly follows the major steps (Aissaoui et al., 2007) of: (1) evaluating each possible supplier’s capabilities to construct a candidate list of potential suppliers, (2) selecting suppliers from this list for single or multi-sourcing of raw materials and components, and (3) determining quantities of each raw material and component to order from each selected supplier. Appropriate supplier selection and order quantity allocation are important strategic activities in successful supply chain design to have a concrete relationship with suppliers (Chen et al., 2006) and purchasing cost reduction (Amid et al., 2011). The importance of optimal supplier selection and order allocation for supply chains has been emphasized in global marketplaces due to a variety of outsourcing arrangements across countries with varying sustainability regulations; in this context, decision-making for supplier selection and order allocation is very complex (Holcomb and Hitt, 2007; Meixell and Gargeya, 2005).
Attesting to the importance of supplier selection and order allocation in supply chain design, there have been attempts to facilitate sustainable supplier selection through supplier assessment frameworks. Genovese et al. (2013) reviewed 28 research publications related to environmentally sustainable supplier selection from 2007 to 2010. They identified that the current research trend for green supplier selection problems is to incorporate environmental criteria within traditional supplier selection approaches mostly using multi-criteria decision-making techniques. Govindan et al. (2015) also performed the literature review for environmentally sustainable supplier selection from 1997 to 2011. Their review revealed that the most widely used multi-criteria decision-making approach and the most widely considered criterion are Analytical Hierarchical Process (AHP) and environmental management system, respectively.
M
AN
US
CR
IP
T
AC
CE
PT
ED
Decision uncertainty in the context of sustainable supplier chain design has been mainly addressed with fuzzy logic in the extant literature. Lu et al. (2007) proposed a multi-objective decision-making process based on AHP along with a fuzzy logic analysis process to evaluate the environmental performance of suppliers. Lee et al. (2009) proposed a green supplier selection model for high-technology industry using the Delphi method for criteria selection and fuzzy extended AHP for supplier rating. Büyüközkan and Çifçi (2011) proposed a fuzzy multi-criteria evaluation framework with five evaluation criteria (i.e., organization, financial performance, service quality, technology, and social responsibility and environmental competencies) and integrated a fuzzy Analytic Network Process (ANP) method to effectively solve a sustainable supplier selection problem, where multi-person decision-making under incomplete preference relations is required. Amindoust et al. (2012) considered economic, environmental, social sustainability criteria and their associated sub-criteria and proposed a fuzzy ranking model for supplier selection. Shaw et al. (2012) proposed a sustainable supplier selection model based on fuzzy AHP and fuzzy multi-objective linear programming by considering cost, quality, lead time, demand, and greenhouse gas emission as main factors for evaluation. Kannan et al. (2013) considered economic and environmental criteria to select the best sustainable supplier through fuzzy AHP and derived the optimal number of order quantities for each supplier through a fuzzy multi-objective linear programming model. Azadnia et al. (2015) proposed an integrated approach of rule-based weighted fuzzy method, fuzzy AHP, and multi-objective linear programming for sustainable supplier selection and multi-period lot-sizing problem with consideration of economic, social, environmental evaluation criteria.
In addition to the studies that featured fuzzy theory, other decision-making methods to effectively handle the complexity and uncertainty in sustainable supplier selection were also proposed. Humphreys et al. (2003) developed a knowledge-based system that utilizes both
M
AN
US
CR
IP
T
AC
CE
PT
ED
quantitative and qualitative factors to evaluate suppliers’ environmental performance in supplier selection. Hsu and Hu (2009) developed a supplier assessment framework based on ANP that considers hazardous substance management issues and employed this assessment framework for the supplier selection problem of a Taiwanese electronics manufacturer. Hsu et al. (2013) proposed DEcision-MAking Trial and Evaluation Laboratory (DEMATEL) to identify casual relationships among evaluation criteria for carbon management and supplier selection. Sarkis and Dhavale (2015) evaluated and selected sustainable suppliers based on a triple-bottom-line (i.e., profit, people, and planet) approach using a Bayesian framework and Monte Carlo Markov Chain simulation. Scott et al. (2015) developed the integrated AHP – QFD (Quality Function Deployment) chance constrained optimization model to solve supply selection problems with stochastic, multi-criteria, and multi-stakeholder requirements. Jia et al. (2015) targeted fashion business operations and employed the Technique for Order of Preference by Similarity to Ideal Solution (TOPSIS) method to select suppliers for fashion business operations covering multiple dimensions of sustainability. Trapp and Sarkis (2016) proposed an optimization model using binary integer programming to integrate supplier selection and supplier development within the context of environmental sustainability. Luthra et al. (2017) integrated AHP and ViseKriterijumska Optimizacija I Kompromisno Resenje (VIKOR), which means Multicriteria Optimization and Compromise Solution, to propose an evaluation framework for sustainable supplier selection.
As seen in Table 1, most studies utilized multi-criteria decision-making techniques integrated with fuzzy set theory to support sustainable supplier selection problems, where uncertain and vague preferences of decision makers are considered. However, extant studies that proposed fuzzy logic-based decision-making methods in this area overwhelmingly focused on the validity of the decision maker’s preferences in decision-making rather than the utility of the decision maker’s preferences under trade-offs given conflicting criteria.
M
AN
US
CR
IP
T
AC
CE
PT
ED
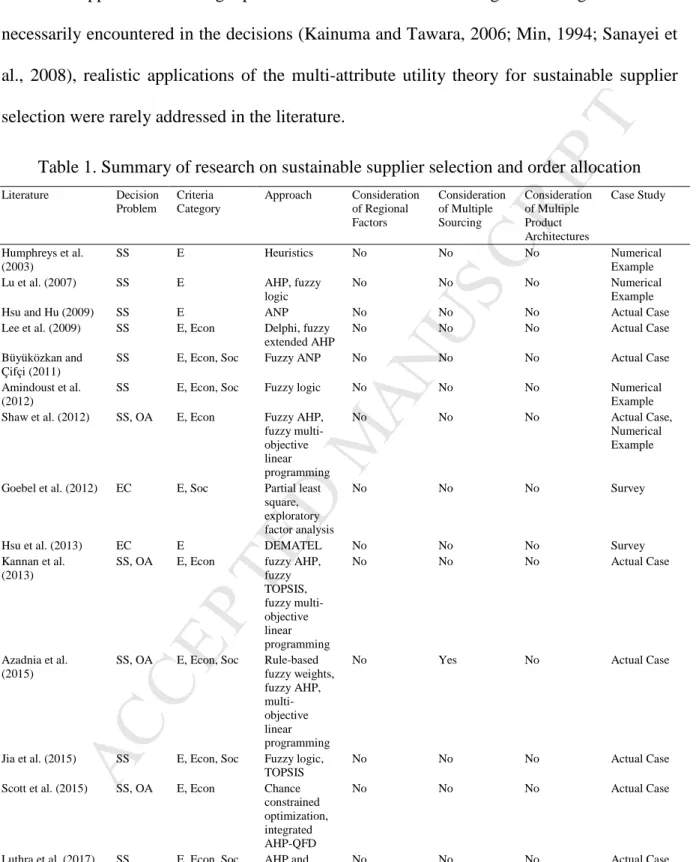
Although a multi-attribute utility theory approach has been employed as an effective method to solve supplier chain design problems where trade-offs among conflicting criteria are necessarily encountered in the decisions (Kainuma and Tawara, 2006; Min, 1994; Sanayei et al., 2008), realistic applications of the multi-attribute utility theory for sustainable supplier selection were rarely addressed in the literature.
Table 1. Summary of research on sustainable supplier selection and order allocation
Literature Decision Problem Criteria Category Approach Consideration of Regional Factors Consideration of Multiple Sourcing Consideration of Multiple Product Architectures Case Study Humphreys et al. (2003) SS E Heuristics No No No Numerical Example
Lu et al. (2007) SS E AHP, fuzzy
logic
No No No Numerical
Example
Hsu and Hu (2009) SS E ANP No No No Actual Case
Lee et al. (2009) SS E, Econ Delphi, fuzzy extended AHP
No No No Actual Case
Büyüközkan and Çifçi (2011)
SS E, Econ, Soc Fuzzy ANP No No No Actual Case
Amindoust et al. (2012)
SS E, Econ, Soc Fuzzy logic No No No Numerical
Example Shaw et al. (2012) SS, OA E, Econ Fuzzy AHP,
fuzzy multi-objective linear programming No No No Actual Case, Numerical Example
Goebel et al. (2012) EC E, Soc Partial least square, exploratory factor analysis
No No No Survey
Hsu et al. (2013) EC E DEMATEL No No No Survey
Kannan et al. (2013)
SS, OA E, Econ fuzzy AHP, fuzzy TOPSIS, fuzzy multi-objective linear programming No No No Actual Case Azadnia et al. (2015)
SS, OA E, Econ, Soc Rule-based fuzzy weights, fuzzy AHP, multi-objective linear programming
No Yes No Actual Case
Jia et al. (2015) SS E, Econ, Soc Fuzzy logic, TOPSIS
No No No Actual Case
Scott et al. (2015) SS, OA E, Econ Chance constrained optimization, integrated AHP-QFD
No No No Actual Case
Luthra et al. (2017) SS E, Econ, Soc AHP and VIKOR
No No No Actual Case
M
AN
US
CR
IP
T
AC
CE
PT
ED
The existing studies in sustainable supplier selection were mostly confined to domestic supplier selection problems and consequently did not sufficiently include attributes that represent global business conditions. Indeed, the listed studies in Table 1 did not address the business environments of supplier regions that can significantly affect the performance of global supply chains. When choosing global suppliers, the decision maker is expected to know business practices and challenges in the regions of potential suppliers. Thus, the decision maker should simultaneously consider multiple regional factors such as economic stability, political volatility, and taxation levels and risk attitudes on those factors to appropriately judge the sustainability of regions. However, relevant regional information was not made part of the modeling and solution processes in the existing studies for sustainable supplier selection and order allocation. The lack of objective data use to reflect the regional attributes of global suppliers in a supply chain decision model can hamper the reliability and effectiveness of the decision model for global supply chain design.
Moreover, the extant studies in Table 1 mainly modeled a decision problem for sustainable supplier selection and order allocation with a simplified and abstract supply chain structure; therefore, more realistic supply chain decisions under multiple sourcing and multiple product structures were not fully considered. The fact that multiple suppliers can provide operational benefits (Aissaoui et al., 2007; Hong and Hayya, 1992) suggests that the decision problem should accommodate multiple sourcing strategies. The close interdependency between product design and supply chain decisions (Kremer et al., 2016; Ülkü and Schmidt, 2011) also supports that the decision problem should be formulated to connect product structure and sustainable supply chain configuration.
M
AN
US
CR
IP
T
AC
CE
PT
ED
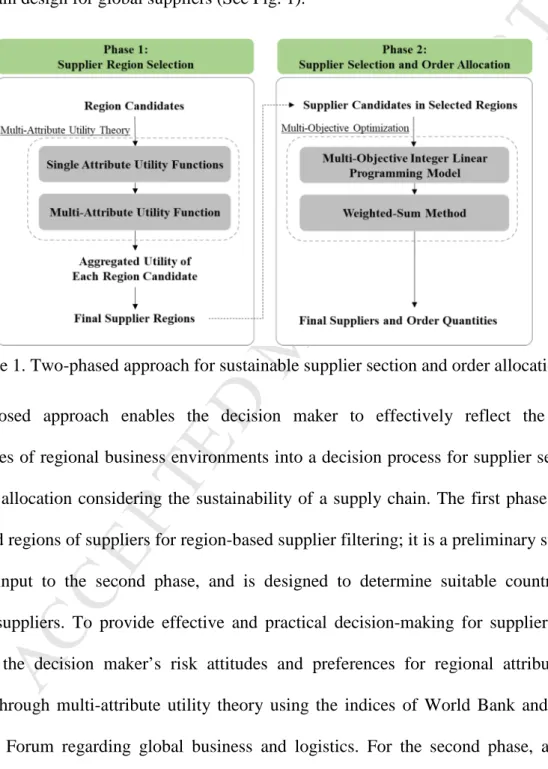
3. MethodologyTo overcome the research gaps discussed above, this research proposes a two-phased approach that aims to simplify the complex decision-making process involved in sustainable supply chain design for global suppliers (See Fig. 1).
Figure 1. Two-phased approach for sustainable supplier section and order allocation The proposed approach enables the decision maker to effectively reflect the multi-perspectives of regional business environments into a decision process for supplier selection and order allocation considering the sustainability of a supply chain. The first phase selects the desired regions of suppliers for region-based supplier filtering; it is a preliminary step that provides input to the second phase, and is designed to determine suitable countries for potential suppliers. To provide effective and practical decision-making for supplier region selection, the decision maker’s risk attitudes and preferences for regional attributes are modeled through multi-attribute utility theory using the indices of World Bank and World Economic Forum regarding global business and logistics. For the second phase, a multi-objective integer linear programming model is developed to determine final suppliers and their optimal order quantities for multiple sourcing and multiple product designs. Supplier
M
AN
US
CR
IP
T
AC
CE
PT
ED
candidates, filtered by the selected regions from the first phase, are included in the model that minimizes total cost, order defect, delivery delay, and carbon footprint. The decision maker’s preferences for the objectives are represented as the relative weights of the objectives to be reflected in the optimization process.
3.1 Supplier Region Selection
A multi-attribute utility (MAU) approach is proposed to select regions where a global supply chain can be favorably formed. Sections 3.1.1 and 3.1.2 show the mathematical representation and procedure of the supplier region selection based on multi-attribute utility theory (MAUT).
3.1.1 Multi-Attribute Utility Theory for Supplier Region Selection
Let c denote a feasible decision alternative representing one country of a set of all
feasible countries (C). For each country c in C, the MAU of a country is expressed by
)} ( ) ( { ) ( c 1 c n c f SAU x ,..., SAU x U Χ = , where Χ=(x1,x2,...,xn) is a vector of x , i x is a i
performance level for its attribute i (= 1, … , n), and SAUc(xi) is a perceived single attribute
utility (SAU) of i for c. In order to find appropriate countries in a region-based supplier
selection problem, it is assumed that there is a certain perceived threshold level for Uc(Χ)
above which the decision maker is likely to consider c for a global supplier region. Then,
supplier region selection is formulated to find a set of c with Uc(Χ) greater than a threshold
utility level U*(Χ) predetermined by the decision maker (See Eq. 1).
) ( ) (Χ ≥ * Χ c U U (1)
The total utility of each county is calculated through a MAU function (Keeney, 1974; Thurston and Locascio, 1994; Von Neumann and Morgenstern, 2007) for supplier region selection (See Eqs. 2 and 3).
M
AN
US
CR
IP
T
AC
CE
PT
ED
∏
= − + = n i i c i c K KkSAU x U 1 ] 1 ) 1 ) ( ( [ / 1 (2)∏
= + = + n i i Kk K 1 ) 1 ( 1 (3)where k is a scaling parameter for attribute i i(0≤ki ≤1), and Kis a non-zero normalizing
constant (−1< K ). This multiplicative model is valid for attributes, where mutual utility
independence and interactions between attributes on preferences may exist (Butler et al., 2001). Utility independence is maintained when conditional preferences for lotteries on one attribute given a fixed level for another attribute do not depend on the level of another attribute (Keeney and Raiffa, 1976). Under these decision conditions, the MAU of the best
country alternative designated with Best
i
x as per the decision maker’s perception is valued at 1
on a utility scale of (0-1), and the worst country ( Worst
i
x ) is assigned 0 for its MAU value.
i
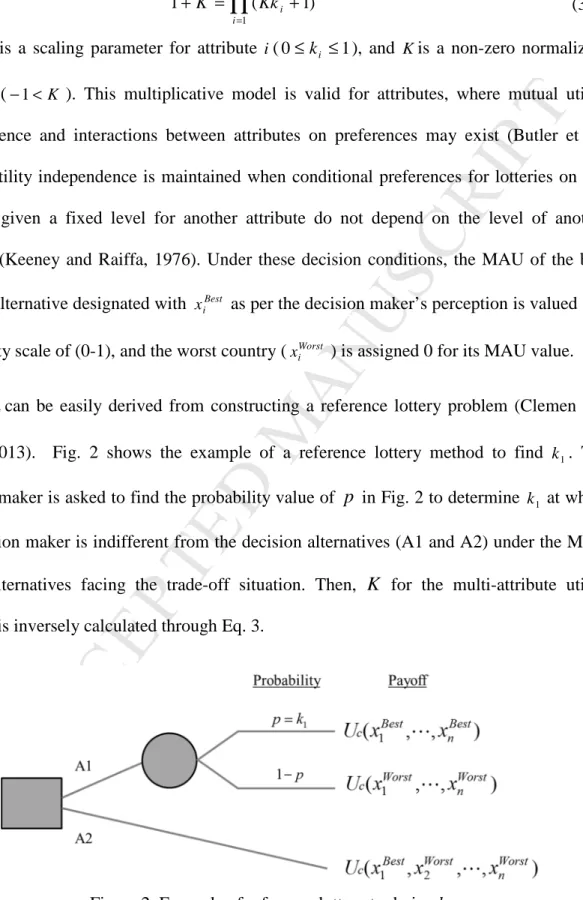
k can be easily derived from constructing a reference lottery problem (Clemen and
Reilly, 2013). Fig. 2 shows the example of a reference lottery method to find k1. The
decision maker is asked to find the probability value of
p
in Fig. 2 to determine k1 at whichthe decision maker is indifferent from the decision alternatives (A1 and A2) under the MAU
of the alternatives facing the trade-off situation. Then,
K
for the multi-attribute utilityfunction is inversely calculated through Eq. 3.
M
AN
US
CR
IP
T
AC
CE
PT
ED
To derive the aggregated utility of each region from the MAU function, each single attribute utility function is required to be formulated. One of the popular forms for a single attribute function is an exponential utility function with a risk tolerance term (Butler et al., 2001; Clemen and Reilly, 2013). The generalized form of an exponential utility function for a single attribute is expressed as shown in Eq. 4.
i i RT x i i i c x A B e SAU ( )= − × − / (4)
where A and i B are scaling parameters for i, and i RT is the decision maker’s risk tolerance i
measured for i. Since SAUc(xiBest)=1 and ( )=0
Worst i c x
SAU are known, the equations for the
scaling parameters in Eq. 4 are derived as shown in Eqs. 5 and 6
]
/[
( / ) ( / )) /
( xWorsti RTi xWorsti RTi xiBest RTi
i
e
e
e
A
=
− −−
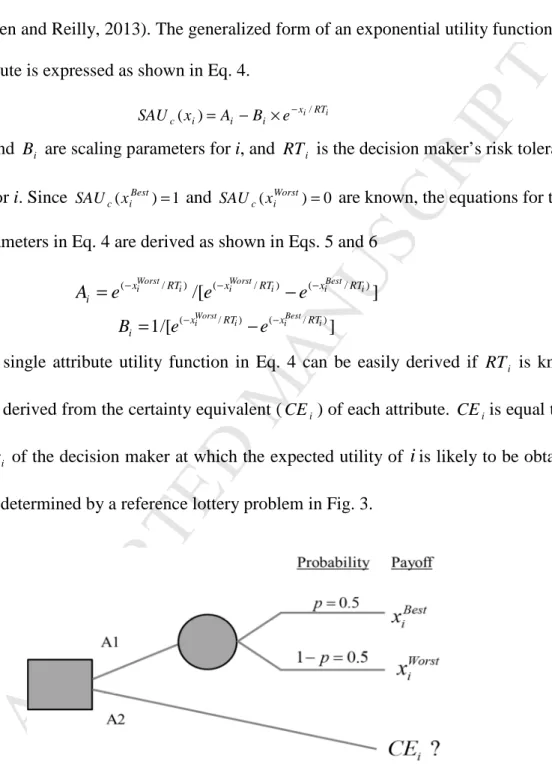
− (5) ] /[ 1 ( xWorsti /RTi) ( xiBest/RTi) i e e B = − − − (6)The single attribute utility function in Eq. 4 can be easily derived if RT is known. i
i
RT can be derived from the certainty equivalent (CE ) of each attribute. i CE is equal to the i
perceived x of the decision maker at which the expected utility of i
i
is likely to be obtained.i
CE can be determined by a reference lottery problem in Fig. 3.
Figure 3. Reference lottery to find certainty equivalent
This lottery problem asks to judge a certain performance level for
i
the decisionmaker is willing to take, while given as the other option of getting the best value ( Best
i
M
AN
US
CR
IP
T
AC
CE
PT
ED
worst value ( Worst
i
x ) with the equal probability of 0.5 for each option. That is, CE is a value i
that makes the decision maker indifferent between the decision alternatives A1 and A2 in Fig. 3. Under this lottery problem, the expected utility becomes 0.5 since the utility of the best
value is 1 and that of the worst value is 0. Since CE can be obtained from the inverse form i
of a single attribute utility function at the expected utility (Butler et al., 2001; Clemen and
Reilly, 2013), Eq. 7 is derived from the inverse of Eq. 4 when x in the right-hand side and i
) ( i
i x
U in the left-hand side are respectively set to CE and the expected utility: i
) ( ] 5 . 0 5 . 0 ln[ ( x /RT) ( x /RT) i i e e RT CE i Worst i i Best i + × × − × = − − (7)
From Eq. 7, RT can be inversely calculated from i CE , and then each single attribute utility i
function can be obtained through Eqs. 4, 5, and 6.
3.1.2 Attribute Selection
Regional sustainability indices and their regional ranking data annually reported by authorized global organizations are employed as attributes and raw data for the multi-attribute theory analysis in this phase. The use of public data from credible organization enhances the practicality and reliability of supplier region selection. Among the available indices from the World Bank (in total 48 indices) and the World Economic Forum (in total 4 indices), four regional sustainability indices that are considered as relevant and significant to global supply chain design are selected: (1) the ease of doing business index (World Bank, 2014), (2) the logistics performance index (Arvis et al., 2014), (3) the global competitiveness index (Schwab et al., 2014), and (4) the global enabling trade index (Hanouz et al., 2014). These indices evaluate the economic performance, business environment, and growth potential of each country from both qualitative and quantitative perspectives. Table 2 summarizes the factors considered in these selected indices.
M
AN
US
CR
IP
T
AC
CE
PT
ED
Table 2. Summary of selected regional sustainability indices
Indices Elements Considered Factor Types
Economic Social Ease of Doing Business
Index (World Bank, 2014)
• Ease of starting a business
• Protecting investors
• Ease of dealing with construction permits
• Ease of paying taxes
• Ease of trading across borders
• Ease of enforcing contracts
• Ease of getting credit
• Ease of resolving insolvency
√ √
Logistics Performance Index (Arvis et al., 2014) •
Efficiency of customs
• Quality of trade infrastructure
• Ease of arranging shipments
• Quality of logistics services
• Ability to track and trace consignments
• Timeliness of delivery
√ √
Global Competitiveness Index (Schwab et al., 2014)
• Fairness of institutional environment
• Extensiveness and efficiency of infrastructure
• Stability of macroeconomic environment
• Quantity and quality of health and education services
• Goods market efficiency
• Labor market efficiency
• Quality and transparency of financial markets
• Technological readiness
• Market size
• Business sophistication
• Technological and non-technological innovation
√ √
Global Enabling Trade Index (Hanouz et al., 2014)
• Domestic and foreign market access
• Efficiency and transparency of border administration
• Availability and quality of transport and communication infrastructure
• Regulatory and security of business environment
√ √
The country ranking results of these indices are used to derive the multi-attribute
utility of each supplier country. That is, xi becomes the ranking of each supplier country
according to index i for Eqs. 2 and 4. After the decision maker obtains the utility of each supplier country through the steps in Section 3.1.1 using the ranking data from the selected indices, a set of feasible countries that have their aggregated utility greater than a threshold utility level is considered as a potential region set for a global supply chain.
3.2 Supplier Selection and Order Allocation
Final suppliers and order quantities for product components and modules are determined in this phase.
M
AN
US
CR
IP
T
AC
CE
PT
ED
3.2.1 Supplier Selection and Order Allocation Model
Based on the identified regions through Section 3.1, all feasible supplier candidates in the regions are considered as an initial set of suppliers. These feasible supplier candidates are assumed to at least have favorable external business environment where a focal company can successfully construct a global supply chain. Then, a final set of suppliers and order allocation for them are determined through a multi-objective optimization model considering suppliers’ economic and environmental sustainability, proposed in this section. This systemic procedure facilitates narrowing down all possible global suppliers to a reduced set of sustainable suppliers.
A multi-objective integer linear programming model is proposed to accommodate a multiple sourcing strategy for multiple product designs under discrepancies in suppliers’ economic and environmental performances for the supply chain design. The following assumptions are made for the model: (1) purchase volume discounts are not allowed, and (2) suppliers can supply multiple items required by the buyer. The detailed information of the proposed model is described as follows:
• Index
i Component suppliers, i = 1, 2, …, Ni
j Module suppliers, j = 1, 2, …, Nj
k Index for purchasing components, k = 1, 2, …, Nk
s Index for purchasing modules, s = 1, 2, …, Ns
• Decision Variables
xik Order quantity of component k from supplier i
xjs Order quantity of module s from supplier j
• Parameters
Cik Unit cost of component k from supplier i
Cjs Unit cost of module s from supplier j
Tik Unit transportation cost of component k from supplier i
Tjs Unit transportation cost of module s from supplier j
Oik Unit order cost of component k from supplier i
Ojs Unit order cost of module s from supplier j
TC Unit transportation cost per mass times distance
DISi Distance from component supplier i
DISj Distance from module supplier j
Qik Average defect rate of component k from supplier i
M
AN
US
CR
IP
T
AC
CE
PT
ED
Lik Average delivery delay of component k from supplier i
Ljs Average delivery delay of module s from supplier j
Gik Unit carbon footprint occurring while manufacturing component k in supplier i
Gjs Unit carbon footprint occurring while manufacturing module s in supplier j
TG Unit carbon footprint per mass times distance during transportation
B Total budget for procurement
Dk Order demand for component k
Ds Order demand for module s
Capik Supply capacity of component k from supplier i
Capjs Supply capacity of module s from supplier j
EC Carbon emission cap
Wk Mass of component k Ws Mass of module s • Model Minimize
∑∑
∑∑
= = = = ⋅ + + + ⋅ + + = i k Nj s j N s js js js js N i N k ik ik ik ik T O x C T O x C f 1 1 1 1 1 ( ) ( ) (8) Minimize∑∑
∑∑
= = = = ⋅ + ⋅ = Ni k j s i N k N j N s js js ik ik x Q x Q f 1 1 1 1 2 (9) Minimize∑∑
∑∑
= = = = ⋅ + ⋅ = Ni k j s i N k N j N s js js ik ik x L x L f 1 1 1 1 3 (10) Minimize∑∑
∑∑
∑∑
∑∑
= = = = = = = = ⋅ + ⋅ + ⋅ ⋅ ⋅ + ⋅ ⋅ ⋅ = i k j s Ni k j s i N k N j N s js s j ik k i N j N s js js N i N k ik ik x G x DIS TG W x DIS TG W x G f 1 1 1 1 1 1 1 1 4 (11) Subject to, B x O T C x O T C js js js N i N j N s js ik N k ik ik ik i k j s ≤ ⋅ + + + ⋅ + +∑
∑
∑∑
= = = = ) ( ) ( 1 1 1 1 (12)k
D
x
i N i k ik≥
∀
∑
=,
1 (13) s D x s N j js j ∀ ≥∑
= , 1 (14) k i Cap xik ≤ ik,∀, (15) s j Cap xjs ≤ js ,∀ , (16) EC x W TG DIS x W TG DIS x G x G i k j s j s i k N i N k N j N s js s j ik k i N j N s js js N i N k ik ik +∑∑
+∑∑
⋅ ⋅ ⋅ +∑∑
⋅ ⋅ ⋅ ≤∑∑
= = = = = = = =1 1 1 1 1 1 1 1 (17) s k j i x xik, js ≥0,∀, , , (18) s k j i x xik, js areinteger,∀, , , (19)Eqs. 8, 9, 10, and 11 are objective functions to minimize the total supply chain cost, the number of defective components and modules, the total deviations from the due date of order delivery, and the total carbon footprint, respectively. Eq. 12 indicates that the total cost of ordering should not exceed the total allocated budget. Eqs. 13 and 14 are demand
M
AN
US
CR
IP
T
AC
CE
PT
ED
constraints that should be satisfied for components and modules. Eqs. 15 and 16 are supplier capacity constraints that indicate the total available order quantities for component and modules from each supplier. Eq. 17 is a constraint for the total amount of carbon footprint occurring from orders. Eqs. 18 and 19 indicate that all order quantities should be non-negative and integer values. Unit transportation costs for component and module orders in Eq 8 are calculated as seen in Eqs. 20 and 21.
k i W TC DIS Tik = i⋅ ⋅ k,∀ , (20) s j W TC DIS Tjs = j⋅ ⋅ s,∀, (21) 3.2.2 Optimization Process
The decision maker can have different preferences for the objectives of the proposed model for supplier selection and order allocation. For the optimization of the preemptive objectives, the weighted-sum method shown in Eq. 22 is used:
∑
= ⋅ = N i i i f w x f Minimize 1 ) ( (22)where wi is a relative weight assigned to the i
th
objective function, fi. The weighted-sum
method is known as the most common approach to multi-objective function problems and effectively transforms multi-objective functions into a single-objective function (Azadnia et al., 2015; Marler and Arora, 2004).
All the objective functions of the model should be normalized before using the weighted-sum method since they have values on different scales. For the normalization of the objective functions, the following steps are performed (Azadnia et al., 2015). First, each objective function is optimized separately as a single-objective optimization problem in the model. Then, the decision variable values obtained in each optimization case become inputs for each objective function to find its negative ideal value (worst value) and positive ideal
M
AN
US
CR
IP
T
AC
CE
PT
ED
value (best value). Eq. 23 is applied to each minimization objective function of the model for normalization. ) /( ) ( ibest worst i i worst i i f f f f f′ = − − (23)
where fi′is the normalized objective function of the i
th
objective function, worst
i
f is the worst
value of the ith objective function, and best
i
f is the best value of the ith objective function. Eq.
23 scales all the objective functions to have values between 0 and 1, and converts them into objective functions for maximization. Thus, Eq. 22 for the original multi-objective model is transformed into Eq. 24:
∑
= ′ ⋅ = ′ N i i i f w x f Maximize 1 ) ( (24)The multi-objective model is transformed into a single objective model through Eq. 24 once all the objective weights are identified. Appendix A.1 introduces a fuzzy AHP approach employing the extent analysis method (Chang, 1992, 1996) as one of the methods that can be employed to derive the objective weights.
3.3 Case Study: Bicycle Supply Chain Network
The proposed supply chain design approach is illustrated through a bicycle supply chain case study. The descriptions and data provided in Chiu and Okudan (2011) and Lei and Okudan Kremer (2013) are employed for this case study. X-bike produces bicycle components and modules. This company also manufactures final products by assembling components and/or modules provided by multiple suppliers. It is assumed that X-bike constructs a sustainable global supply chain for three structural types of its major bikes: (1) single component architecture (i.e., [A]: saddle, [B]: frame, [C]: fork, [D]: brake, [E]: wheels, and [F]: transmissions), (2) modular architecture with modules coupled with two functional components (i.e., [AB]: structure module, [CD]: orientation module, and [EF]: transport module), and (3) modular architecture with modules coupled with three functional
M
AN
US
CR
IP
T
AC
CE
PT
ED
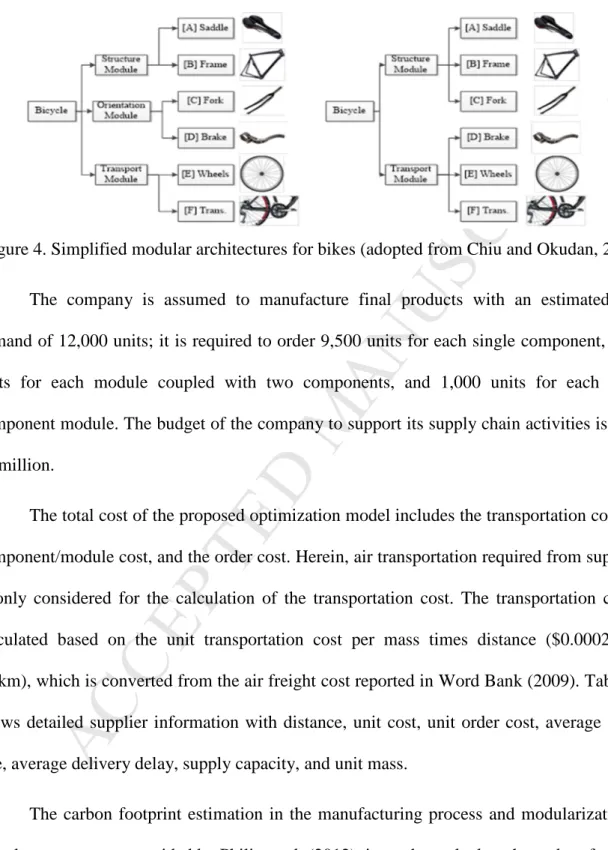
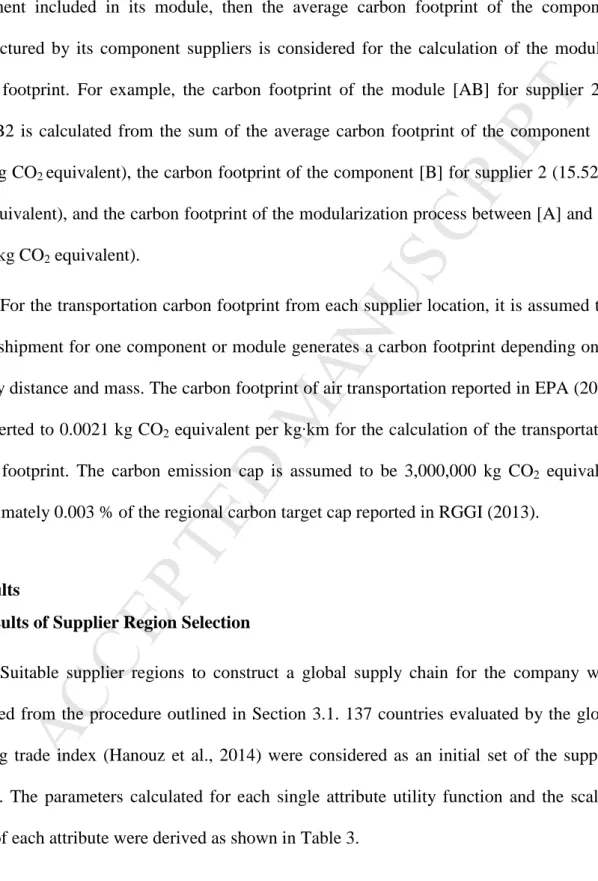
components (i.e., [ABC]: structure module and [DEF]: transport module). The modular architecture types are described in Fig. 4.
Figure 4. Simplified modular architectures for bikes (adopted from Chiu and Okudan, 2011) The company is assumed to manufacture final products with an estimated total demand of 12,000 units; it is required to order 9,500 units for each single component, 1,500 units for each module coupled with two components, and 1,000 units for each three-component module. The budget of the company to support its supply chain activities is set to $9 million.
The total cost of the proposed optimization model includes the transportation cost, the component/module cost, and the order cost. Herein, air transportation required from suppliers is only considered for the calculation of the transportation cost. The transportation cost is calculated based on the unit transportation cost per mass times distance ($0.00023 per
kg·km), which is converted from the air freight cost reported in Word Bank (2009). Table B1
shows detailed supplier information with distance, unit cost, unit order cost, average defect rate, average delivery delay, supply capacity, and unit mass.
The carbon footprint estimation in the manufacturing process and modularization of bicycle components, provided by Philip et al. (2012), is used to calculate the carbon footprint of each component and module for the case study. Each module’s carbon footprint is calculated by summing the estimated carbon footprints of the components associated in the
M
AN
US
CR
IP
T
AC
CE
PT
ED
module design and the modularization process. The resultant component and module carbon footprints are specified in Table B2. If a module supplier does not produce a certain component included in its module, then the average carbon footprint of the component manufactured by its component suppliers is considered for the calculation of the module’s carbon footprint. For example, the carbon footprint of the module [AB] for supplier 2 in Table B2 is calculated from the sum of the average carbon footprint of the component [A]
(0.62 kg CO2 equivalent), the carbon footprint of the component [B] for supplier 2 (15.52 kg
CO2 equivalent), and the carbon footprint of the modularization process between [A] and [B]
(0.308 kg CO2 equivalent).
For the transportation carbon footprint from each supplier location, it is assumed that the air shipment for one component or module generates a carbon footprint depending on its delivery distance and mass. The carbon footprint of air transportation reported in EPA (2015)
is converted to 0.0021 kg CO2 equivalent per kg·km for the calculation of the transportation
carbon footprint. The carbon emission cap is assumed to be 3,000,000 kg CO2 equivalent
approximately 0.003 % of the regional carbon target cap reported in RGGI (2013).
4. Results
4.1 Results of Supplier Region Selection
Suitable supplier regions to construct a global supply chain for the company were identified from the procedure outlined in Section 3.1. 137 countries evaluated by the global enabling trade index (Hanouz et al., 2014) were considered as an initial set of the supplier regions. The parameters calculated for each single attribute utility function and the scaling factor of each attribute were derived as shown in Table 3.
Table 3. Parameters of single-attribute utility functions for bike supplier regions
i
M
AN
US
CR
IP
T
AC
CE
PT
ED
1x : Ease of Doing Business Index 1 (Singapore) 189 (Eritrea) 70 168.2 -0.49 -1.49 0.3
2
x : Logistics Performance Index 1 (Germany) 160 (Somalia) 60 147.2 -0.51 -1.52 0.4
3
x : Global Competitiveness Index 1 (Switzerland) 144 (Guinea) 80 -338.3 2.90 1.90 0.1
4
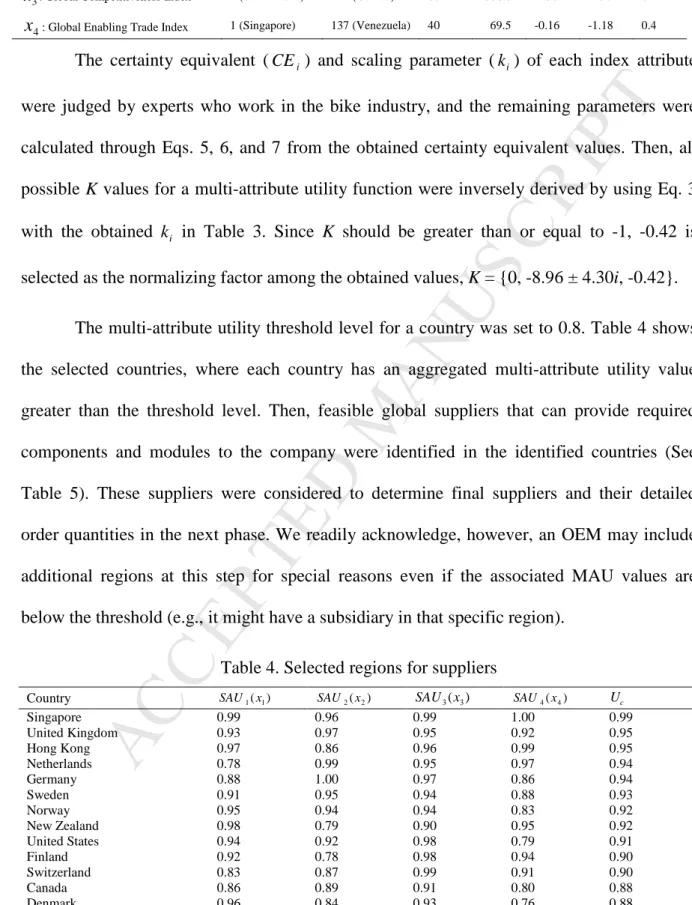
x : Global Enabling Trade Index 1 (Singapore) 137 (Venezuela) 40 69.5 -0.16 -1.18 0.4
The certainty equivalent (CE ) and scaling parameter (i k ) of each index attribute i
were judged by experts who work in the bike industry, and the remaining parameters were calculated through Eqs. 5, 6, and 7 from the obtained certainty equivalent values. Then, all possible K values for a multi-attribute utility function were inversely derived by using Eq. 3
with the obtained k in Table 3. Since K should be greater than or equal to -1, -0.42 is i
selected as the normalizing factor among the obtained values, K = {0, -8.96 ± 4.30i, -0.42}. The multi-attribute utility threshold level for a country was set to 0.8. Table 4 shows the selected countries, where each country has an aggregated multi-attribute utility value greater than the threshold level. Then, feasible global suppliers that can provide required components and modules to the company were identified in the identified countries (See Table 5). These suppliers were considered to determine final suppliers and their detailed order quantities in the next phase. We readily acknowledge, however, an OEM may include additional regions at this step for special reasons even if the associated MAU values are below the threshold (e.g., it might have a subsidiary in that specific region).
Table 4. Selected regions for suppliers
Country SAU1(x1) SAU2(x2) SAU3(x3) SAU4(x4) Uc
Singapore 0.99 0.96 0.99 1.00 0.99 United Kingdom 0.93 0.97 0.95 0.92 0.95 Hong Kong 0.97 0.86 0.96 0.99 0.95 Netherlands 0.78 0.99 0.95 0.97 0.94 Germany 0.88 1.00 0.97 0.86 0.94 Sweden 0.91 0.95 0.94 0.88 0.93 Norway 0.95 0.94 0.94 0.83 0.92 New Zealand 0.98 0.79 0.90 0.95 0.92 United States 0.94 0.92 0.98 0.79 0.91 Finland 0.92 0.78 0.98 0.94 0.90 Switzerland 0.83 0.87 0.99 0.91 0.90 Canada 0.86 0.89 0.91 0.80 0.88 Denmark 0.96 0.84 0.93 0.76 0.88 Japan 0.76 0.91 0.97 0.82 0.87 Australia 0.91 0.85 0.87 0.69 0.84
M
AN
US
CR
IP
T
AC
CE
PT
ED
Belgium 0.67 0.98 0.90 0.72 0.84 Ireland 0.89 0.90 0.85 0.65 0.84 Luxembourg 0.56 0.93 0.89 0.85 0.84 Austria 0.83 0.80 0.88 0.75 0.83United Arab Emirates 0.82 0.76 0.93 0.78 0.82
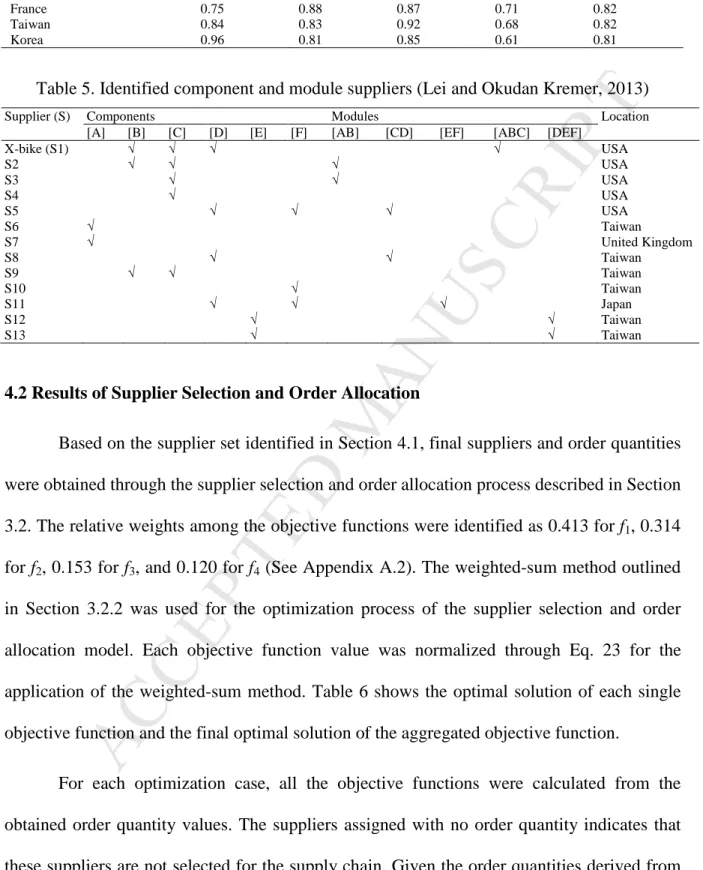
France 0.75 0.88 0.87 0.71 0.82
Taiwan 0.84 0.83 0.92 0.68 0.82
Korea 0.96 0.81 0.85 0.61 0.81
Table 5. Identified component and module suppliers (Lei and Okudan Kremer, 2013)
Supplier (S) Components Modules Location
[A] [B] [C] [D] [E] [F] [AB] [CD] [EF] [ABC] [DEF]
X-bike (S1) √ √ √ √ USA S2 √ √ √ USA S3 √ √ USA S4 √ USA S5 √ √ √ USA S6 √ Taiwan S7 √ United Kingdom S8 √ √ Taiwan S9 √ √ Taiwan S10 √ Taiwan S11 √ √ √ Japan S12 √ √ Taiwan S13 √ √ Taiwan
4.2 Results of Supplier Selection and Order Allocation
Based on the supplier set identified in Section 4.1, final suppliers and order quantities were obtained through the supplier selection and order allocation process described in Section
3.2. The relative weights among the objective functions were identified as 0.413 for f1, 0.314
for f2, 0.153 for f3, and 0.120 for f4 (See Appendix A.2). The weighted-sum method outlined
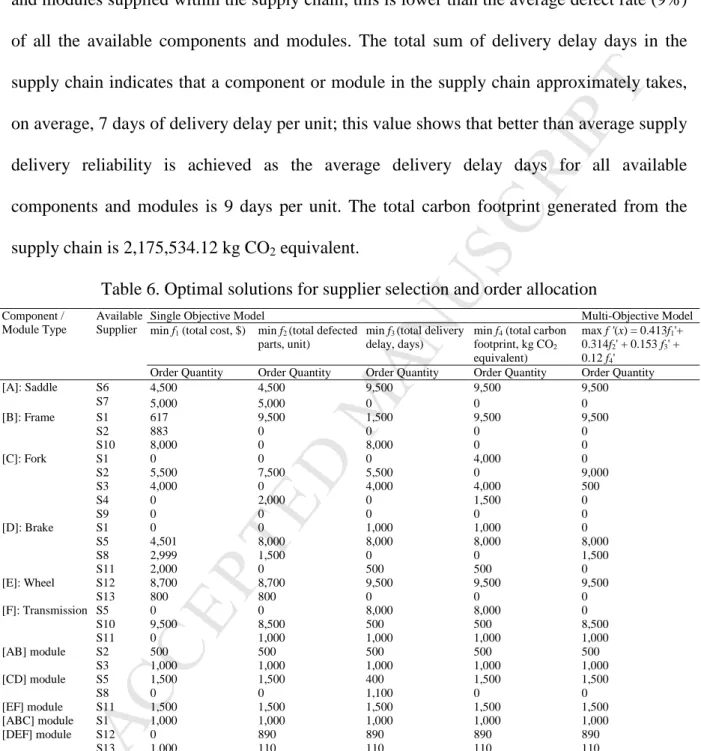
in Section 3.2.2 was used for the optimization process of the supplier selection and order allocation model. Each objective function value was normalized through Eq. 23 for the application of the weighted-sum method. Table 6 shows the optimal solution of each single objective function and the final optimal solution of the aggregated objective function.
For each optimization case, all the objective functions were calculated from the obtained order quantity values. The suppliers assigned with no order quantity indicates that these suppliers are not selected for the supply chain. Given the order quantities derived from the suppliers in the final optimal solution, the total cost occurring in the supply chain is
M
AN
US
CR
IP
T
AC
CE
PT
ED
$ 6,121,949.51. The supply chain is expected to have 4,559 units of the total defected components and modules, indicating 7% defect rate for the total 63,500 units of components and modules supplied within the supply chain; this is lower than the average defect rate (9%) of all the available components and modules. The total sum of delivery delay days in the supply chain indicates that a component or module in the supply chain approximately takes, on average, 7 days of delivery delay per unit; this value shows that better than average supply delivery reliability is achieved as the average delivery delay days for all available components and modules is 9 days per unit. The total carbon footprint generated from the
supply chain is 2,175,534.12 kg CO2 equivalent.
Table 6. Optimal solutions for supplier selection and order allocation
Component / Module Type
Available Supplier
Single Objective Model Multi-Objective Model
min f1 (total cost, $) min f2 (total defected
parts, unit)
min f3 (total delivery
delay, days)
min f4 (total carbon
footprint, kg CO2
equivalent)
max f '(x) = 0.413f1'+
0.314f2' + 0.153 f3' +
0.12 f4'
Order Quantity Order Quantity Order Quantity Order Quantity Order Quantity
[A]: Saddle S6 4,500 4,500 9,500 9,500 9,500 S7 5,000 5,000 0 0 0 [B]: Frame S1 617 9,500 1,500 9,500 9,500 S2 883 0 0 0 0 S10 8,000 0 8,000 0 0 [C]: Fork S1 0 0 0 4,000 0 S2 5,500 7,500 5,500 0 9,000 S3 4,000 0 4,000 4,000 500 S4 0 2,000 0 1,500 0 S9 0 0 0 0 0 [D]: Brake S1 0 0 1,000 1,000 0 S5 4,501 8,000 8,000 8,000 8,000 S8 2,999 1,500 0 0 1,500 S11 2,000 0 500 500 0 [E]: Wheel S12 8,700 8,700 9,500 9,500 9,500 S13 800 800 0 0 0 [F]: Transmission S5 0 0 8,000 8,000 0 S10 9,500 8,500 500 500 8,500 S11 0 1,000 1,000 1,000 1,000 [AB] module S2 500 500 500 500 500 S3 1,000 1,000 1,000 1,000 1,000 [CD] module S5 1,500 1,500 400 1,500 1,500 S8 0 0 1,100 0 0 [EF] module S11 1,500 1,500 1,500 1,500 1,500 [ABC] module S1 1,000 1,000 1,000 1,000 1,000 [DEF] module S12 0 890 890 890 890 S13 1,000 110 110 110 110 Objective Function f1 5,631,931.15(best) 6,191,631.63 6,784,943.14 7,289,545.22 (worst) 6,121,949.51 f2 5,661.61 4,136.40 (best) 5,782.40 (worst) 5,199.40 4,559.40 f3 495,097 517,410 (worst) 441,410 (best) 481,110 465,610 f4 2,999,991.04 (worst) 2,168,374.13 2,716,840.54 1,810,852.97 (best) 2,175,534.12 f '(x) 0.48 0.67 0.31 0.30 0.71
The best value from each objective function in Table 6 forms the ideal solution of the aggregated multi-objective model. The best value of each objective function is derived when
M
AN
US
CR
IP
T
AC
CE
PT
ED
one objective function is only optimized in the multi-objective model without considering the other objectives. Although the optimal solution of the aggregated multi-objective model does not reach the ideal values that can be achieved for the individual objective functions, the derived solution reflects trade-offs and priorities among the objective functions.
Table 7. Normalized objective function values
Normalized objective function min f1 min f2 min f3 min f4 max f '(x)
f1' 1.000 0.662 0.304 0.000 0.704
f2' 0.074 1.000 0.000 0.354 0.743
f3' 0.294 0.000 1.000 0.478 0.682
f4' 0.000 0.699 0.238 1.000 0.693
Average 0.342 0.590 0.386 0.458 0.706
This is explained in Table 7, which shows the normalized objective function values of each optimization case through Eq. 23. Each normalized value in Table 7 reveals how close
the objective value is to the ideal value. For example, the normalized total cost value (f1') for
the aggregated multi-objective case (max f '(x)) indicates that the objective function value reaches 70.4 % of its ideal value. Table 7 shows that the normalized objective function values for the aggregated multi-objective model are more balanced than those for other optimization cases with a single objective function. The average of the normalized objective function values shows that the optimal solution reaches 70.6% of the ideal solution; it is the highest value in all optimization cases shown in Table 7.
Depending on objective weights, the optimal solution for supplier selection and order allocation can be varied; the decision maker’s decisions for relative objective weights play a significant role in supplier selection and order allocation. To identify the decision impact of objective weights on the optimal solution, five scenarios with different objective weights were set to obtain their optimal solutions as seen in Table 8. These scenarios represent the decision maker’s supply chain strategies under the multi-objective situation.
Table 8. Optimal solutions for decision scenarios
Scenario f1 f2 f3 f4 f '(x)
M
AN
US
CR
IP
T
AC
CE
PT
ED
(w1: 0.7, w2: 0.1, w3: 0.1, w4: 0.1) (2) Quality oriented (w1: 0.1, w2: 0.7, w3: 0.1, w4: 0.1) 6,206,692.13 4,194.40 499,610.00 2,148,158.46 0.836 (3) Delivery oriented (w1: 0.1, w2: 0.1, w3: 0.7, w4: 0.1) 7,045,040.11 4,867.40 449,910.00 2,011,812.19 0.775 (4) Environmental impact oriented(w1: 0.1, w2: 0.1, w3: 0.1, w4: 0.7)
7,234,691.92 5,264.40 471,610.00 1,849,144.51 0.773 (5) Balanced
(w1: 0.25, w2: 0.25, w3: 0.25, w4: 0.25)
6,177,309.79 4,579.40 464,610.00 2,130,176.63 0.707
Figure 5. Normalized objective function values for decision scenarios
Table 8 and Fig. 5 show that all the objective functions have more balanced values without significant loss on any objective when the decision maker recognizes the importance of each objective equally. However, the aggregated multi-objective function of the balanced scenario results in the lowest value of all the scenarios. On the other hand, the aggregated multi-objective function values in other scenarios, where the decision maker considers only one specific objective as a high priority, are relatively higher although there are objectives with significant loss. Although various objectives should be sufficiently satisfied in supply chain design, the reason why sustainability issues are often less considered in current practice might be due to this loss in additional objectives when a decision-maker values an objective at a very high level (e.g., cost).
Companies might focus on cost or profit in their supply chain design since its immediate incremental benefit over multi-objectives may be much greater than other
M
AN
US
CR
IP
T
AC
CE
PT
ED
secondary factors such as environmentally-friendly business and socially-favorable business. The observations presented here clearly show that multi-objective supply chain design with consideration of sustainability are challenging in practice, and therefore, should be guided with an appropriate decision-making tool.
5. Discussion and Conclusions
This paper proposes a sustainable supply chain design approach employing multi-attribute utility theory and multi-objective integer linear programming to support sustainable supplier selection and optimal order allocation. First, the application of multi-attribute utility theory based on regional ranking data from sustainability indices (i.e., Ease of Doing
Business Index, Logistics Performance Index, Global Competitiveness Index, and Global
Enabling Trade Index) determines the regions of potential global suppliers. For possible suppliers in the selected regions, multi-objective integer linear programming identifies final supplier candidates and optimal order quantities that can satisfy pre-defined economic and environmental objectives under supply chain operations with multiple sourcing and multiple product designs. A case study of supply chain network design for a bicycle company was used to illustrate the proposed methodology.
The integration of information for global business environment, supply chain cost, supply chain quality, and supply chain environmental impact in the proposed supplier selection and order allocation approach provides an effective framework to help the decision maker properly design sustainable global supply chains. The proposed approach addresses several research gaps that were not sufficiently considered in the extant research (See Table 1). Importantly, it has a great potential to be implemented in practice since it can comprehensively cover various decision activities that would be performed in planning sustainable global supply chains. The deployment of attribute utility theory and
multi-M
AN
US
CR
IP
T
AC
CE
PT
ED
objective integer linear programming in the proposed approach makes it possible to effectively formulate complex decision environments for sustainable supply chain design that involve various criteria and objectives.
The supplier and order allocation results (See Table 6) reveal that supplier selection and order allocation under a multiple sourcing strategy for multiple product designs can significantly vary depending on operational objectives for the supply chain. The discrepancy in the results between the single objective for cost and the multi-objectives for sustainability shows that a traditional approach relying on the minimization of costs for supply chain design should be reformed by considering each supplier’s sustainability in product configuration. In other words, a multiple sourcing strategy with various products for sustainable supply chain design can be greatly influenced by design architectures and their relevant suppliers’ sustainability. This supports the recent research attention that product design and supply chain decisions should be coordinated to fully obtain benefits from sustainable supply chain (Kremer et al., 2016).
The results shown in Table 8 and Fig. 5 describe not only why a decision maker often has a focused perspective toward a specific operational goal but also why a decision maker should hold an appropriately balanced perspective under the multi-objective circumstance of supplier selection and order allocation. The normalized multi-objective function for each decision scenario with specific objective orientation has a relatively higher value than that for the balanced scenario. This indicates that the perceived multi-objective value of a specific objective-oriented strategy may be over-evaluated by the decision maker despite significant loss in other objectives. In contrast, the decision maker may under-evaluate the perceived multi-objective value of a balanced multi-objective strategy even though it leads to well-rounded results on desired objectives. This represents the necessity of appropriate methods
M
AN
US
CR
IP
T
AC
CE
PT
ED
that can guide the decision maker to appropriately capture objective priorities under multi-objective decision-making.
The use of the proposed methodology requires four decision parameters that should be subjectively determined by the decision maker (See Table 9). Other information required for the methodology can be automatically computed, or is based on objective data collection. The use of public data relevant to regional sustainability in global business and logistics, provided by credible global organizations such as World Bank and World Economic Forum, facilitates finding appropriate global suppliers with consideration of regional business environments from economic and social aspects.
Table 9. Summary of required user input data for the proposed methodology
Phase Input data Derivation process Method
Supplier region selection
Scaling parameter of each index Decision-making Lottery problem setting
Certainty equivalent of each index Decision-making Lottery problem setting
Utility threshold Decision-m