Procedia Computer Science 72 ( 2015 ) 527 – 534
1877-0509 © 2015 The Authors. Published by Elsevier B.V. This is an open access article under the CC BY-NC-ND license (http://creativecommons.org/licenses/by-nc-nd/4.0/).
Peer-review under responsibility of organizing committee of Information Systems International Conference (ISICO2015) doi: 10.1016/j.procs.2015.12.160
ScienceDirect
The Third Information Systems International Conference
Distribution-Sensitive Learning on Relevance Vector Machine
for Pose-Based Human Gesture Recognition
Vina Ayumi, Mohamad Ivan Fanany
aFaculty of Computer Science, University of Indonesia, Depok, West Java, 16424, Indonesia
Abstract
Many real-world gesture datasets are by nature containing unbalanced number of poses across classes. Such imbalance severely reduces bag-of-poses based classification performance. On the other hand, collecting a dataset of human gestures or actions is an expensive and time-consuming procedure. It is often impractical to reacquire the data or to modify the existing dataset using oversampling or undersampling procedures. The best way to handle such imbalance is by making the used classifier be directly aware and adapt to the real condition inside the data. Balancing class distribution, i.e., the number of pose samples per class, is one of difficult tasks in machine learning. Standard statistical learning models (e.g., SVM, HMM, CRF) are insensitive to unbalanced datasets. This paper proposes a distribution-sensitive prior on a standard statistical learning, i.e., Relevance Vector Machine (RVM), to deal with the imbalanced data problem. This prior analyzes the training dataset before learning a model. Thus, the RVM can put more weight on the samples from under-represented classes, while allows overall samples from the dataset to have a balanced impact to the learning process. Our experiment uses a publicly available gesture datasets, the Microsoft Research Cambridge-12 (MSRC-12). Experimental results show the importance of adapting to the unbalanced data and improving the recognition performance through distribution-sensitive prior.
© 2015 Published by Elsevier Ltd. Selection and/or peer-review under responsibility of the scientific committee of The Third Information Systems International Conference (ISICO 2015)
Keywords: Distribution-Sensitive Learning, Relevance Vector Machine, human gesture recognition
1. Introduction
Gesture is one of the most important communication tools used by humans. People sometimes communicate us- ing their body movements such as hands or head rather than talking [1]. Such movements are also used in human and computer interaction [1]. Human gesture recognition is one of the most active research in machine learning and computer vision communities. Its application extends across broad and attractive areas of research such as video surveillance, human machine interaction, video retrieval, sports analysis, gaming, biometrics, analysis of sign lan- guage, and robotics. Human gesture recognition automatically aims to analyze the various kinds of gesture in human activity [2]. Gesture recognition method has been developed using video data, motion capture, depth data or some the combination of these modalities. [2].
Collecting gesture or action datasets is an activity that takes time and expensive procedure. It is hard to balance the distribution of the class or number of samples per class. An example of such scenario is in anomaly detection where a usual or normal pattern of pedestrian movement to be compared to an unusual or anomalous pattern of pedestrian movements. In many real world applications, the samples of the anomalous pattern usually much less than the samples of the normal pattern.
© 2015 The Authors. Published by Elsevier B.V. This is an open access article under the CC BY-NC-ND license (http://creativecommons.org/licenses/by-nc-nd/4.0/).
Some studies have developed statistical learning algorithm such as Decision Trees [3], Neural Networks [4], Hidden Markov Models [5], Support Vector Machines [6], Conditional Random Field [7], and Relevance Vector Machine [8]. The standard formulation of these models does not consider data imbalance. For example, in some cases we may have data with unbalanced distribution (highly skewed) with 1:10000 ratio for positive and negative samples. Due to such unbalanced data, the training process using standard algorithms will be dominated by negative class, so that it would classify many samples as negative rather than positive at the testing phase [9].
One solution to the problem is to balance the original dataset by resampling (undersampling or oversampling). Such approaches, however, have drawbacks. Whereas, undersampling eliminates potentially important samples (rep- resentatives), oversampling might adds redundant samples. Undersampling may cause underfitting due to the lack of training data while oversampling may cause overfitting during testing. [10].
Some studies have suggested the application of statistical learning algorithms to handles unbalanced data. Lin and Wang proposed a Fuzzy Support Vector Machine (FSVM) to eliminate effects caused by the unbalanced data and noise [11]. Ding-Fang Li et al., proposed Fuzzy Relevance Vector Machine to address unbalanced and noise in the data by giving weight to the punishment terms of error in the process of Bayesian inference in RVM [12]. Meanwhile, Yale Song et al., proposed distribution-sensitive prior to overcoming the problem of unbalanced data by analyzing training data before learning the model, and gives more weight to the sample of under-represented classes. They use a standard sequence classification algorithm namely Hidden Conditional Random Field (HCRF) to evaluate the distribution-sensitive prior[13].
Relevance vector machine is a popular machine learning technique motivated by the statistical learning theory. RVM is popular for its theoretical attractive features and profound empirical performance [8], [14], [15]. However, RVM has the same limitation of the standard statistical learning. During its training process, all data are treated equally by assuming that the overall data has a balanced distribution. In real world application, however, we often find the amount of training data are imbalanced on each class [12].
This study proposes a distribution-sensitive learning strategy using a standard statistical learning algorithm, namely Relevance Vector Machine. Experiments is performed using Microsoft Research Cambridge-12 (MSRC-12), which is one of widely used and publicly available human gesture dataset. This dataset, as many other gesture datasets, con- tains unbalanced number of poses per each class of gesture. The application of distribution-sensitive prior to the RVM is expected to overcome unbalanced data problems and can improve the accuracy of overall gesture poses recognition.
2. Related Works
Recently, several studies for gesture recognition have been proposed. Chung and Yang [16] performed gesture recognition using depth information from Microsoft Kinect sensor. They proposed a method to combine gestures and non-gestures thresholds inside a CRF classification models. Biswas [1] proposed a gesture recognition using SVM. Hee-Deok Yang et al., proposed sign language recognition using hierarchical CRF and boost map embedding to detect manual signals and non-manual signals, and SVM and active appearance model to recognition [17].
Jiang and Zhong [18] proposed hierarchical models for the complex action recognition consist of three stages, namely group-labeling, frame-labeling, and action-labeling. KNN classifier used for labeling the frame and used adaptive weighting approach to labeling the action. Hussein et al., proposed action recognition from the 3D skeleton sequences extracted from the depth data [19]. They proposed a new descriptor for gesture recognition using covariance matrix. The descriptor is built by computing the covariance matrix in the body skeleton joint coordinate. To overcome temporal dependency of the joint locations used multiple covariance matrices.
Some studies proposed RVM for classification. Wei et al., proposed RVM to detect clustered microcalcifications (MC) on the mammogram image [20]. Agarwal et al., proposed RVM regressor for recovering 3D human body pose of a single image and monocular image sequences [21]. Oikonomopoulos et al., proposed the human action recognition by using sparse representation in image sequences as a collection of spatiotemporal events [22]. Member [23] proposed RVM for image hyperspectral classification.
The following are some related studies that handled unbalanced data. Lin and Wang proposed Fuzzy Support Vector Machine (FSVM) to eliminate the effect caused by unbalanced data and noise [11]. Song et al., address the issue on unbalanced dataset by proposed distribution-sensitive prior to the analysis of the training dataset before learning models [13]. Ding-Fang Li et al., Proposed Fuzzy Relevance Vector Machine to overcome unbalanced and noise in the data to give a weighting of punishment terms of error in the process of Bayesian inference in RVM [12].
i=1 w j j i i=1 N 2 2 p(w|t, α, σ2) = | |
2.1. Relevance Vector Machine
RVM is a regression and classification technique introduced by Tipping [12]. RVM is a Bayesian model of Gener- alized Linear Model (GLM) that have an identical function with SVM. RVM is a non-linear probabilistic model with the prior distribution on maintaining weight sparsity. Weight prediction procedure performed in the fully probabilistic framework. On the issue of regression, RVM makes predictions based functions:
y(x, w) =N w
i K(x, xi) + w0 (1)
where K(x, xi) is a kernel function, which defines a base function to each sample in the training set, and w = (w0, w1, ..., wN )T are unknown parameters. For that, we treat these parameters as random variables drawn from a particular distribution. Suppose we can assume that these parameters are Gaussian distributed with mean zero and variance σ2. Then the Gaussian prior distribution with zero mean and variance σ2 ≡α−1 applied to each parameter with the following equation:
N
p(w|α) = .
(wi|0, α−1) (2)
Given a data set of input-target pairs G = {(xi, ti)}N i=0
(where xi is the input vector, ti is the real-valued label, and N
is the number of the input data). Then the likelihood for the dataset is:
p(t|w, σ2) = (2πσ2)−2 exp{− 1
2σ2 "t −Φw" } (3) where t = (t1, t2, ..., tN )T , = [φ(x1), φ(x2), ..., φ(xN )]T and φ(xn) = [1, K(xn, x1, K(xn, x2), ..., K(xn, xN ]T
Based on the prior distribution and the likelihood function that has been defined, from the Bayesian rule, then the posterior over the parameters is thus given by
p(t w, σ)p(w α)
p(t|α, σ2) ∼ N(w|μ, ) (4) where posterior covariance and mean are:
where A = diag(α) = diag(α0, α1, .., αN )
Σ = (σ−2T + A)−1 = H−1 (5)
μ = σ−2ΦT t
(6) Likelihood distribution of the training targets can be marginalized by integrating out the parameters to get a marginal likelihood of the hyperparameters:
¸
p(t|α, σ2) = p(t|w, σ2)p(w|α)dw, ∼N(0, C) (7)
where covariance defined by C = σ2 I + ΦA−1ΦT .
The estimated value of the parameter (w) obtained by the mean of the posterior distribution, which is also the estimated maximum a posteriori (MAP) of the parameter (w). The MAP of the parameter depends on the value of the hyperparameters αand the noise σ2 whose value is estimated by maximizing the equation (7).
Iterative procedure is done to update the parameter αby: αnew γi
i = i2
(8) where μi is the ith posterior mean weight from (6) and γi is defined by
γi = 1 − αiΣii (9)
2
(1+e−y )
i=1
where Σii is the diagonal element of the posterior covariance (6), calculated from the current value of αand σ2, where noise variance σ2 updated by:
(σ2)new = "t −Φμ"
N −i γi
(10) Relevance Vector Classification followed the regression frameworks those described above, but using Bernoulli likelihood and a sigmoidal link function. As a consequence, there is an additional step in the approximation algorithm. Applying logistic sigmoid link function σ(y) = 1 to y(x) and adopt Bernoulli distribution to P(t|x), then the
likelihood can be written as: N
P(t|w) = . σ{y(xi; w)}ti [1 −σ{y(xi; w)}]1−ti (11) i=1
where the targets ti ∈0, 1 the most probable value of parameter (w) obtained by finding a minimum of
where yi = σ{y(xi; w)}.
N
−log{p(t|w)p(w|α)} = − .
[ti log yi + (1 −ti) × log(1 −yi)] + i=1
1
wT Aw (12)
2
2.2. Distribution-Sensitive Prior
The essence of statistical learning algorithm is solving an optimization problem with the objective function L(w) which is the model parameter w. Given a training dataset of D = {(xi, yi)|xi ∈Rd , yi ∈y}N , where xi is a real-valued d-dimentional input feature vector and yi is the output label. Then the standard formulation of objective function is
min L(w) = Ω(w) + Qemp(D, w) (13)
w
where Ω(w) is a regularizer that prevents over-fitting, and Qemp is a quality empirical measure of the solution w that derived from the training dataset D. On the issue of classification, where y is a finite set of numbers, then Qemp(D, w) is defined as the negative log of conditional probability:
N
Qemp(D, w) = −
.
logp(yi|xi) (14)
i=1
Because we minimize Qemp(D, w), this formulation maximizes the linear sum of the conditional log probabilities that computed from each of training samples (xi, yi) by using the current solution of w. Unfortunately, this formulation is not sensitive to the distribution. This formulation treats each p(yi|xi) are equally important and computes the linear sum of them, assuming the training dataset has a balanced distribution in each class. As a result, if we have a dataset with unbalanced distribution (highly skewed) (e.g., 1: 10000 ratio of positive and negative samples). The linear sum in equations (14) resulting a solution w, will be dominated by the most frequent classes. Such condition will cause a decrease in the accuracy of most data testing because one class dominates the other classes as shown at [14]. To address the issue of data unbalance, introduced distribution-sensitive prior si [18] as
N where s = ( 1 Nyi )k (15) N = ( |y| ) . Ny (16) y
where Ny is the number of samples in the class label y (equal to yi), |y| is the number of classes, and N is the average number of samples per class. The degree of k is the magnitude control of the distribution-sensitive prior. si then multiplied with the log probability for each sample (xi, yi) so that Qemp becomes:
N
Qemp(D, w) = −
.
silogp(yi|xi), (17)
When the dataset has a balanced distribution (when all Ny have the same value), or when k = 0, Equation 17 will become the standard formulation of Equation 14. Prior (si) will give more weight to a sample of fewer classes, making all the sample dataset into balance that will affect the learning process.
2.3. Distribution-Sensitive Learning on Relevance Vector Machine
2.3.1. For classification problems
For the two-class classification problem, RVM applied the GLM model and logistic sigmoid link function, then the likelihood is:
where the targets tn ∈ {0, 1}
N
p(t|w) = .
σ{y(xi; w)}ti [1 −σ{y(xi; w)}]1−ti (18) i=1
Then most probable weights w obtained by finding the minimum of N
−log{p(t|w)p(w|α)} = − .
[ti log yi + (1 −ti) × log(1 −yi)] + i=1
1
wT Aw (19)
2
with yn = σ{y(n; w)}. Where the first term is sum error data, and the second term is the regularizer. When applied the distribution-sensitive prior, then Eq. 19 can be changed as follows:
N
−log{p(t|w)p(w|α)} = − .
si[ti log yi + (1 −ti) × log(1 −yi)] + i=1
1
wT Aw (20)
2
3. Experimental Setup
Hardware and software specification that used in this experiment are: Processor Intel Core i7-5820K CPU 3.3 @Ghz, Memory DDR2 RAM 64.00 GB, Hard disk 240 GB, Ubuntu 14.04 LTS 64 bit, Matlab R2014a 64 bit, Sparse- Bayes2.0 [24].
3.1. Dataset
To show the effectiveness of the proposed DSL-RVM method, we used a publicly available database, the Microsoft Research Cambridge-12 (MSRC-12) Kinect gesture dataset [25]. The dataset consists of sequences of human skeletal body movements and its meaning which will be recognized by the system. The dataset that was captured using a Kinect depth sensor in Microsoft platform consists of 594 sequences collected from 30 people performing 12 gestures. One actor performed an action several times in every sequence. The 12 gestures are: lift arms, duck, push right, goggles, wind up, shoot, bow, throw, had enough, change weapon, beat both and kick. Different types of instruction are giving to them to shows the effect on subjects movements. Therefore, the dataset is constructed to not only measure the performance of recognition system but also to evaluate all the instruction such as by text, picture and video. Kinect Pose Estimation pipeline used to estimate 20 3D joints in every frame.
In this study, experiments carried out did not use the entire of the data contained in the MSRC-12 gesture database because the training on RVM requires costly computational time. To reduce the computational time, the twelve gesture performed five times by only five people. So that total there are 300 gesture with 37952 frame pose. Features that used are 20 joint human body skeleton in 3-dimensional (x,y,z) so that the total there are 60 features.
4. Result
Experiments are carried out by three folds cross-validation, where 2/3 of the data are treated as training data, while the rest as testing data. The experiment uses a same kernel to make the comparison equivalent namely Radial Basis Function (RBF), with a 0.3 scale. Experiments are using MRSC-12 data, which consists of 12 gestures performed five times by five people.
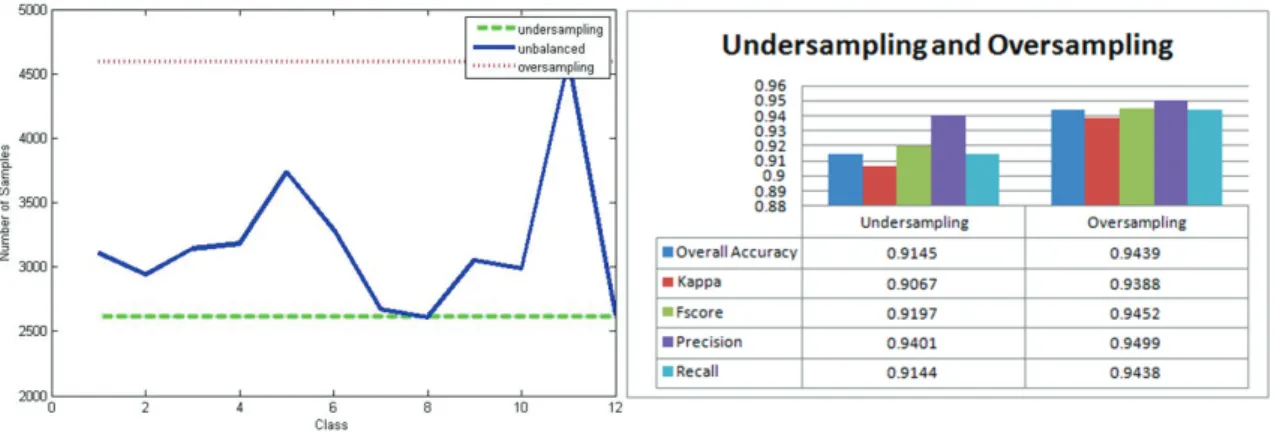
Figure 1: (a) Class distribution of unbalanced and balanced data using undersampling and oversampling ; (b) Experimental result on Undersampling and Oversampling
4.1. Experiment I: undersampling and oversampling
In this experiment, we performed an evaluation of the classification of the balanced data that is carried out by two methods of sampling, i.e., undersampling and oversampling, using standard RVM. Figure 1(a) shows unbalanced and balanced class distribution with undersampling and oversampling. Experimental result in figure 1(b) shows overall classification accuracy over 12 gestures that described in Subsection 2.1. Results show that oversampling better than undersampling. On the data that performed undersampling, accuracy is 0.9145 with standard deviation 0.0516. On data that performed oversampling, accuracy is 0.9439 with standard deviation 0.0324. Thus, the undersampling is possible to eliminate the representative data while oversampling is not, even though also oversampling add redundant sample.
4.2. Experiment II: Distribution-Sensitive Prior
This experiment evaluated Distribution-Sensitive Learning on the unbalanced data. This is done by comparing the data without learning using Distribution-Sensitive Priors (k = 0), and learning using Distribution-Sensitive Prior with k = 0.5, 1, 2. The value of k is the degree of the distribution-sensitive prior. Whereas k = 0 means that no distribution-sensitive prior was used (see Equation 15). It is possible if k valued more than 2, but in this experiment we only used the value of k = 0.5, 1, 2. This experiment shows how sensitive the classification performance to the degree of k of the distribution-sensitive priors.
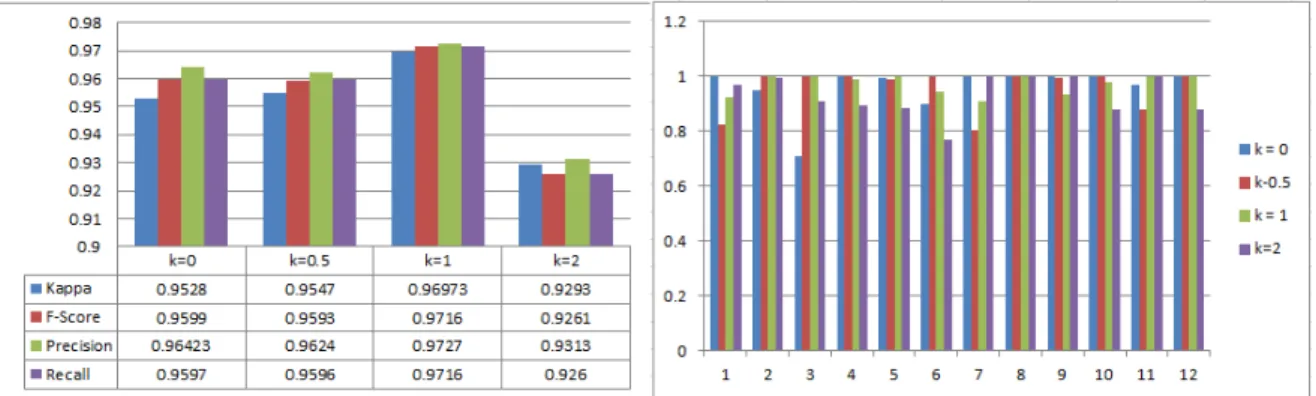
Figure 2(a) shows overall accuracy on classification of 12 gestures that described on subsection 2.1 using DSL- RVM with degrees k = 0, 0.5, 1, 2. On the value of k = 0, i.e., without sensitive-distribution prior, accuracy is 0.9568 with a standard deviation 0.0160. On the value of k = 0.5, the accuracy is 0.9585 and standard deviations 0.093. On the value of k = 1, the accuracy is 0.9723 with a standard deviation 0.004. On the value of k = 2 accuracy is 0.9353 with a standard deviation 0.0184. Results show that the distribution-sensitive prior improve accuracy recognition for the value of k = 1, since the learning of each class becomes well balanced.
Figure 2(b) shows per-class mean accuracy comparing DSL-RVM with varied degrees of k. Accuracy is obtained by calculating the percentage of the amount of data that correctly classified on a class. Results show the value of k =
1 have per-class accuracy more stable than k = 0, k = 0.5, or k = 2. For the k = 0 the highest accuracy achieved in classes 8 and 9 are 1, whereas the lowest accuracy at class 3 is 0.70. For the k = 0.5, the highest accuracy achieved in classes 4, 8, and 12 with accuracy are 1, while the lowest accuracy at class 7 is 0.80. For the k = 1 the highest accuracy achieved in class 12 with a value of 1, while the lowest accuracy with a value of 0.91 on class 7. For the k =
2 the highest accuracy is achieved at class 7 with a value of 1 while the lowest accuracy with a value of 0.77 at class 6. The k=2 has the lower accuracy than the others because when the distribution-sensitive prior k=2 the learning process becomes highly unbalanced.
Figure 2: (a) Accuracy, Kappa, F-score, Precision, Recall with varied k value; (b) Comparison per-class accuracy using varied k value
Table 1: Table computational time (in seconds) of DSL-RVM and RVM Preprocessing DSL RVM Train RVM Test
DSL-RVM 0.056 14027 1.546667
RVM 0 13470 3.006667
Table 1 shows the computational time (in seconds) required in the experiment. Experiments using DSL-RVM requires additional time 0.056 for preprocessing prior calculation on the dataset, whereas in standard RVM does not require extra time to prior calculation.
Experimental result of all accuracy shown in figure 3(a). Experimental results showed DSL-RVM with k = 1 has the most excellent accuracy than standard RVM on unbalanced data, and also better than standards RVM on resampling data both undersampling and oversampling. We also compare the DSL-RVM with k=1 using balanced data (unbalanced data that obtained using resampling: undersampling and oversampling). The result in figure 3(b) showed that balanced data both obtained using undersampling and oversampling can not improve the performance of DSL-RVM. It is due to the undersampling eliminates the representative samples and the oversampling adds redun- dant samples. So that the unbalanced data has the best performance better than balanced data that obtained using resampling.
5. Conclusion
This study proposed a Distribution-Sensitive Learning that addressed the problem of unbalanced data using stan- dard statistical learning algorithm namely Relevance Vector Machine. Distribution-Sensitive Learning introduced
Figure 3: (a) Comparison accuracy of undersampling, oversampling, DSL-RVM, and standard RVM; (b) Accuracy of balanced data (undersampling
prior which gives more weight to the under-represented data and enable all samples in the dataset have a balanced influence in learning the process. Experiments conducted using Microsoft’s gesture 12 Research Cambridge (MSRC- 12) database. This study shows the performance comparison with the standard RVM with data unbalanced, resampling data (undersampling and oversampling), and RVM with Distribution-Sensitive learning with varied k values. Exper- imental results showed DSL-RVM with a value of k = 1 achieved the best accuracy compared if the value of k = 0, 0.5, or 2. DSL-RVM with value k = 1 is also better when compared with the standard RVM with unbalanced data, and the data that has been carried out resampling (undersampling and oversampling). The accuracy of each class indicates DSL-RVM with k = 1, has stable accuracy. Experimental result shows DSL-RVM can improve the performance on the unbalanced data better than the balanced data that obtained by using resampling.
Acknowledgments
This work is supported by Higher Education Center of Excellence Research Grant funded by Indonesia Ministry of Research, Technology and Higher Education. Contract No. 0475/UN2.R12/HKP.05.00/2015.
References
[1] K. K. Biswas and Saurav KB. Gesture Recognition using Microsoft Kinect. In: Proc. 5th International Conference on Automation Robotics
and Applications, New Zealand; 2011, vol 2 ,pages = pp. 100103
[2] Qing C, N. D. Georganas, Emil. M, K. Edward, A. Ottawa, C. Kin. Real-time Vision-based Hand Gesture Recognition Using Haar-like
Features. In: IEEE Instrumentation and Measurement Technology Conference, Wersaw: Poland; May 2007
[3] JR Quinlan. Induction of decision trees. Machine Learning; 1986, vol 1(1):81- 106
[4] Christopher. MB. Neural Networks for Pattern Recognition. Oxford University Press. USA; 1996, 1 edition
[5] Lawrence RR. A tutorial on hidden markov models and selected applications in speech recognition. In Proceedings of the IEEE; 1989, pages 257-286.
[6] Vladimir NV. The nature of statistical learning theory. Springer-Verlag New York, New York; 1995.
[7] John DL, Andrew M, and Fernando CNP. Conditional random fields: Probabilistic models for segmenting and labeling sequence data. In
Proceedings of the Eighteenth International Conference on Machine Learning (ICML 2001); 2001, pages 282-289.
[8] Michael ET. Sparse Bayesian learning and the relevance vector machine. Journal Machine Learning Res; 2001, vol. 1, p. 211244
[9] Garry MW, Foster P. The effect of class distribution on classifier learning: An empirical study. Technical report, ML-TR-44, Departement of Computer Science, Rutgers University; 2001
[10] D. Mease, A. J. Wyner, and A. Buja. Boosted classification trees and class probability/quantile estimation. journal of Machine Learning Research, 8:409-439, 2007.
[11] Lin, Chun-Fu, Wang, Sheng-De. Fuzzy support vector machines. In: IEEE Trans. Neural Networks; 2002, 13 (2), 464471.
[12] Ding-Fang Li, Wen-Chao Hu, Wei Xiong, and Jin-Bo Yang. Fuzzy relevance vector machine for learning from unbalanced data and noise. Pattern Recognit. Lett.; 2008, vol. 29, no. 9, pp. 11751181
[13] Yale S, Louise M, and Randall D. Distribution-Sensitive Learning for Imbalanced Datasets. A. Face, G. Recognition; 2014
[14] Michael ET. The relevance vector machine. In: Advances in Neural Information Processing Systems, Cambridge: The MIT Press; 2001, vol.
12.
[15] Majumder, S.K., Ghosh, N., Gupta, P.K. Relevance vector machine for optical diagnosis of cancer. Lasers Surg. Med; 2005, 36 (4), 323333
[16] Hyunsook C, Hee-Deok Y. Conditional random field-based gesture recognition with depth information. Optical Engineering SPIE; Jan. 2013,
vol. 52, no. 1, p. 017201.
[17] Hee-Deok Y, Sheong-Wan L. Combination of Manual and Non-Manual Features for Sign Language Recognition Based on Conditional Ran-
dom Field and Active Appearance Model. In: IEEE proceeding of the 2011 International Conference on Machine Learning and Cybernetics;
2011, 1013
[18] Xinbo J, Fan Z, Qunsheng P, Xueying Q. Robust Action Recognition Based on a Hierarchical Model. In: International Conference on
Cyberworlds; 2013, pp. 191198
[19] M. E. Hussein, M. Torki, M. A. Gowayyed, and M. El-saban. Human Action Recognition Using a Temporal Hierarchy of Covariance Descriptors on 3D Joint Locations; 2011
[20] L. Wei, Y. Yang, R. M. Nishikawa, M. N. Wernick, and A. Edwards. Relevance vector machine for automatic detection of clustered micro- calcifications. In IEEE Trans. Med. Imaging; 2005, vol. 24, no. 10, pp. 127885
[21] A. Agarwal, B. Triggs, and D. Europe. 3D Human Pose from Silhouettes by Relevance Vector Regression. In Proc. of the 2004 IEEE
Computer Society Conference on Computer Vision and Pattern Recognition; 2004
[22] A. Oikonomopoulos, I. Patras, and M. Pantic. Spatiotemporal salient points for visual recognition of human actions. IEEE Trans. Syst. Man. Cybern. B. Cybern.; 2006, vol. 36, no. 3, pp. 7109
[23] S. Member. Hyperspectral Image Classification Using Relevance Vector Machines; 2007, vol. 4, no. 4, pp. 586590
[24] Tipping, M. E., Faul, A. C. Fast Marginal Likelihood Maximisation for Sparse Bayesian Models. In: Ninth International Workshop on
Aritficial Intelligence and Statistics; 2003, 113
[25] S. Fothergill, H. Mentis, P. Kohli, and S. Nowozin. Instructing people for training gestural interactive systems. In: Proc. 2012 ACM Annu. Conf. Hum. Factors Comput. Syst.; 2012, p. 1737