149
THOMAS S. DEE
University of VirginiaBRIAN A. JACOB
University of MichiganThe Impact of No Child Left Behind
on Students, Teachers, and Schools
ABSTRACT The controversial No Child Left Behind Act (NCLB) brought test-based school accountability to scale across the United States. This study draws together results from multiple data sources to identify how the new accountability systems developed in response to NCLB have influenced stu-dent achievement, school-district finances, and measures of school and teacher practices. Our results indicate that NCLB brought about targeted gains in the mathematics achievement of younger students, particularly those from dis-advantaged backgrounds. However, we find no evidence that NCLB improved student achievement in reading. School-district expenditure increased signifi-cantly in response to NCLB, and these increases were not matched by federal revenue. Our results suggest that NCLB led to increases in teacher compensa-tion and the share of teachers with graduate degrees. We find evidence that NCLB shifted the allocation of instructional time toward math and reading, the subjects targeted by the new accountability systems.T
he No Child Left Behind (NCLB) Act of 2001 is arguably the most far-reaching education policy initiative in the United States over the last four decades. The hallmark features of this legislation compelled states to conduct annual student assessments linked to state standards, to identify schools that are failing to make “adequate yearly progress” (AYP), and to institute sanctions and rewards based on each school’s AYP status. A fun-damental motivation for this reform is the notion that publicizing detailed information on school-specific test performance and linking that perfor-mance to the possibility of meaningful sanctions can improve the focus and productivity of public schools.NCLB has been extremely controversial from its inception. Critics charge that NCLB has led educators to shift resources away from impor-tant but nontested subjects, such as social studies, art, and music, and to focus instruction within mathematics and reading on the relatively narrow set of topics that are most heavily represented on the high-stakes tests (Rothstein, Jacobsen, and Wilder 2008, Koretz 2008). In the extreme, some suggest that high-stakes testing may lead school personnel to inten-tionally manipulate student test scores (Jacob and Levitt 2003). Although there have been hundreds of studies of test-based accountability policies in the United States over the past two decades, the evidence on NCLB is more limited, both because it is a newer policy and because the national scope of the policy makes it extremely difficult to find an adequate control group by which to assess the national policy.
This paper examines the impact NCLB has had on students, teachers, and schools across the country. We investigate not only how NCLB has influenced student achievement, but also how it has affected education spending, instructional practice, and school organization. Given the com-plexity of the policy and the nature of its implementation, we are skeptical that any single analysis can be definitive. For this reason we present a broad collage of evidence and look for consistent patterns.
Several findings emerge. First, the weight of the evidence suggests that NCLB has had a positive effect on elementary student performance in mathematics, particularly at the lower grades. The benefits appear to be concentrated among traditionally disadvantaged populations, with particu-larly large effects among Hispanic students. We do not find evidence that the policy has adversely affected achievement at either the top or the bot-tom end of the test-score distribution. Instead, the policy-induced gains in math performance appear similar across the test-score distribution. How-ever, the available evidence suggests that NCLB did not have a compara-ble effect on reading performance.
A closer look at the potential mechanisms behind the observed improve-ment provides some additional insight. For example, we find evidence that NCLB increased average school district expenditure by nearly $600 per pupil. This increased expenditure was allocated both to direct student instruction and to educational support services. We also find that this increased expenditure was not matched by corresponding increases in federal support. The test-score gains associated with these expenditure increases fall short of the ambitious goals enshrined in NCLB. However, we present some qualified evidence suggesting that the size of the gains reflects a reasonable return on investment.
We also discuss evidence on how NCLB may have influenced alterna-tive measures of educational practice and student outcomes. This evi-dence suggests that NCLB led to an increase in the share of teachers with master’s degrees. We also find evidence that teachers responded to NCLB by reallocating instructional time from social studies and science toward key tested subjects, particularly reading. We also present evidence that NCLB led to distinct improvements in a teacher-reported index of student behaviors (which covers, among other things, attendance, timeliness, and intellectual interest) commonly understood as measuring “behavioral engagement” with school.
The paper proceeds as follows. Section I outlines the theoretical under-pinnings of school accountability and provides background on the NCLB legislation. Section II examines the impact of NCLB on student achieve-ment, marshaling evidence from a variety of different sources. Section III investigates potential mediating mechanisms, discussing how the policy affected educational expenditure, classroom instruction, and school orga-nization, among other things. Section IV concludes with recommendations for future policy and research.
I. Background on School Accountability and NCLB
NCLB represented a bold new foray into education policy on the part of the federal government. However, the provisions it embodied built on a long history of reforms in standards and accountability at the state and local levels over several decades.
I.A. Theoretical Underpinnings of School Accountability
A basic perception that has motivated the widespread adoption of school accountability policies like NCLB is that the system of public ele-mentary and secondary schooling in the United States is “fragmented and incoherent” (Ladd 2007, p. 2). In particular, proponents of school account-ability reforms argue that too many schools, particularly those serving the most at-risk students, have been insufficiently focused on their core perfor-mance objectives, and that this organizational slack reflected weak incen-tives and a lack of accountability among teachers and school administrators. For example, Eric Hanushek and Margaret Raymond (2001, pp. 368–69) write that accountability policies are “premised on an assumption that a focus on student outcomes will lead to behavioral changes by students, teachers, and schools to align with the performance goals of the system”
and that “explicit incentives . . . will lead to innovation, efficiency, and fixes to any observed performance problems.”
The theoretical framework implicitly suggested by this characteriza-tion of public schools is a principal-agent model: the interests of teachers and school administrators, the agents in this framework, are viewed as imperfectly aligned with those of parents and voters. Furthermore, parents and voters cannot easily monitor or evaluate the input decisions made by these agents. The performance-based sanctions and rewards that charac-terize accountability policies are effectively output-based incentives that can be understood as a potential policy response to this agency problem. Similarly, some of the provisions in NCLB with regard to teacher qualifi-cations can be construed as an agent selection approach to a principal-agent problem.
The principal-agent lens is also useful for understanding criticisms of accountability-based reforms. The assumption that the self-interest of teachers and administrators is misaligned implies that they may respond to accountability policies in unintentionally narrow or even counterproduc-tive ways. For example, in the presence of a high-stakes performance threshold, schools may reallocate instructional effort away from high- and low-performing students and toward the “bubble kids”—those most likely, with additional attention, to meet the proficiency standard (see, for exam-ple, Neal and Schanzenbach 2010). Similarly, concerns about “teaching to the test” reflect the view that schools will refocus their instructional effort on the potentially narrow cognitive skills targeted by their high-stakes state assessment, at the expense of broader and more genuine improve-ments in cognitive achievement. Schools may also reallocate instructional effort away from academic subjects that are not tested, or even attempt to shape the test-taking population in advantageous ways.
I.B. Research on Accountability Reforms Adopted by States before NCLB
School accountability reforms similar to those brought about by NCLB were adopted in a number of states during the 1990s. Several studies have evaluated the achievement consequences of these reforms. Because of the similarities between NCLB and aspects of these pre-NCLB accountability systems, this body of research provides a useful backdrop against which to consider the potential achievement impacts of NCLB. In a recent review of this diverse evaluation literature, David Figlio and Helen Ladd (2007) suggest that three studies (Carnoy and Loeb 2002, Jacob 2005, and Hanushek and Raymond 2005) are the “most methodologically sound” (Ladd 2007, p. 9).
A study by Martin Carnoy and Susanna Loeb (2002), based on state-level achievement data from the National Assessment of Educational Progress (NAEP), found that the within-state improvement in math perfor-mance between 1996 and 2000 was larger in states with higher values on an accountability index, particularly for black and Hispanic students in eighth grade.1Similarly, Jacob (2005) found that, following the
introduc-tion of an accountability policy, math and reading achievement increased in the Chicago public schools, relative both to prior trends and to con-temporaneous changes in other large urban districts in the region. How-ever, Jacob (2005) also found that younger students did not experience similar gains on a state-administered, low-stakes exam and that teachers responded strategically to accountability pressures (for example, increas-ing special education placements).
Hanushek and Raymond (2005) evaluated the impact of school account-ability policies on state-level NAEP math and reading achievement, as measured by the difference between the performance of a state’s eighth-graders and that of fourth-eighth-graders in the same state 4 years earlier. This gain-score approach applied to the NAEP data implied that there were two cohorts of state-level observations in both math (1992–96 and 1996–2000) and reading (1994–98 and 1998–2002). Hanushek and Raymond (2005) classified state accountability policies as implementing either “report-card accountability” or “consequential accountability.” States with report-card accountability provided a public report of school-level test performance, whereas states with consequential accountability both publicized school-level performance and could attach consequences to that performance. The types of potential consequences were diverse. However, virtually all of the systems in consequential accountability states included key ele-ments of the school accountability provisions later enacted in NCLB (for example, identifying failing schools, replacing principals, allowing stu-dents to enroll elsewhere, and taking over, closing, or reconstituting schools). Hanushek and Raymond (2005, p. 307) note that “all states are now effectively consequential accountability states (at least as soon as they phase in NCLB).”
Hanushek and Raymond (2005) find that the introduction of consequen-tial accountability within a state was associated with statistically significant
1. The accountability index constructed by Carnoy and Loeb (2002) ranged from 0 to 5 and combined information on whether a state required student testing and performance reporting to the state, whether the state imposed sanctions or rewards, and whether the state required students to pass an exit exam to graduate from high school.
increases in the gain-score measures. The achievement gains implied by consequential accountability were particularly large for Hispanic stu-dents and, to a lesser extent, white stustu-dents. However, the estimated effects for the gain scores of black students were statistically insignificant, as were the estimated effects of report-card accountability. The authors argue that these achievement results provide support for the controversial school accountability provisions in NCLB, because those provisions are so similar to the consequential accountability policies that had been adopted in some states.
I.C. Key Features of the NCLB Legislation
The NCLB legislation was actually a reauthorization of the historic Ele-mentary and Secondary Education Act (ESEA), the central federal legisla-tion relevant to K-12 schooling. The ESEA, first enacted in 1965 along with other Great Society initiatives and previously reauthorized in 1994, introduced Title I, the federal government’s signature program for target-ing financial assistance to schools and school districts servtarget-ing high con-centrations of economically disadvantaged students. NCLB dramatically expanded the scope and scale of this federal legislation by requiring that states introduce school accountability systems that applied to all public schools and their students in the state. In particular, NCLB requires annual testing of public-school students in reading and mathematics in grades 3 through 8 (and at least once in grades 10 through 12), and that states rate each school, both as a whole and for key subgroups of students, with regard to whether they are making “adequate yearly progress” toward their state’s proficiency goals.
NCLB also requires that states introduce “sanctions and rewards” rel-evant to every school and based on their AYP status. It mandates explicit and increasingly severe sanctions (from implementing public-school choice to staff replacement to school restructuring) for persistently low-performing schools that receive Title I aid. According to data from the Schools and Staffing Survey of the National Center for Education Statis-tics, 54.4 percent of public schools participated in Title I services during the 2003–04 school year. Some states applied these explicit sanctions to schools not receiving Title I assistance as well. For example, 24 states introduced accountability systems that threatened all low-performing schools with reconstitution, regardless of whether they received Title I assistance.2
II. The Impact of NCLB on Student Achievement
The overarching goal of NCLB has been to drive broad and substantive improvements in student achievement. This section discusses the available empirical evidence on the achievement effects of NCLB, drawing on a variety of research designs and data sources including national time trends, comparisons between private and public schools, and comparisons across schools and states.
II.A. National Time Trends in Student Achievement
Because NCLB was introduced simultaneously throughout the United States, many observers have turned to state and national time-series trends in student achievement to assess its impact. For example, several studies have noted that student achievement, particularly as measured by state assessment systems, appears to have improved both overall and for key subgroups since the implementation of NCLB (Center on Education Policy 2008b). Others, however, argue that changes in student performance on high-stakes state tests can be highly misleading when states strategically adjust their assessment systems and teachers narrow their instructional focus to state-tested content (Fuller and others 2007).
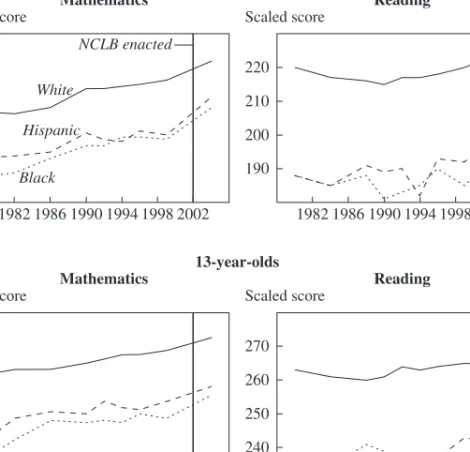
Figure 1 presents data on national trends in student achievement from 1992 to 2007. These data are from the main NAEP and provide separate trends by grade (fourth and eighth), by subject (math and reading), and by race and ethnicity (white, black, and Hispanic).3These trends suggest that
NCLB may have increased the math performance of fourth-graders. That is, these NAEP data suggest that fourth-grade math achievement has shifted noticeably higher during the NCLB era and may have also begun trending upward more aggressively. The trend data suggest similar gains in the math performance of black eighth-graders. However, the trends pro-vide no clear suggestion that the onset of NCLB improved performance in
3. There are several different versions of the NAEP. The original NAEP, first admin-istered in the early 1970s, is now called the Long-Term Trend (LTT) NAEP, because the Department of Education has made an effort to keep the content of this examination as con-sistent as possible over time in order to accurately gauge national trends. The LTT NAEP is administered to a small random sample of 9-, 13-, and 17-year-olds across the country and generally focuses on what many educators now think of as “basic” skills. What is now called the main NAEP was initiated in the early 1990s in an effort both to update the con-tent and format of the national assessment so as test a broader domain of knowledge and skills, and to allow individual states to obtain their own, state-representative estimates. This exam is administered to fourth and eighth graders (and more recently to twelfth-graders).
the other three grade-subject combinations. Figure 2 shows achievement growth for 9- and 13-year-olds in math and reading, using data from the Long-Term Trend (LTT) NAEP, which has tracked student perfor-mance from the early 1970s. These data similarly suggest that the effects of NCLB on student achievement have been at best limited to certain groups.
II.B. Evidence from International Comparisons
Although these national achievement trends are suggestive, they do not necessarily provide the basis for reliable inferences about the impact of NCLB. Simple time-series comparisons may be biased by the achievement consequences of other time-varying determinants, such as the recession
Source: National Center for Education Statistics.
a. Data are for all public schools.
Scaled score Scaled score
Mathematics
Fourth-graders
Eighth-graders
Reading
Scaled score Scaled score
Mathematics Reading 200 190 220 240 210 230 250 1994 1998 2002 2006 Black Hispanic White NCLB enacted 240 270 260 250 290 280 1994 1998 2002 2006 190 200 210 220 1994 1998 2002 2006 240 250 260 270 1994 1998 2002 2006
that just preceded the introduction of NCLB. One straightforward way to benchmark the achievement trends observed in the United States is to compare them with the contemporaneous trends in other countries.
Because the time-series evidence in figure 1 suggests that any posi-tive achievement effects from NCLB were likely to have been concen-trated in fourth-grade math achievement, the comparative international achievement data from the Trends in International Mathematics and Sci-ence Study (TIMSS) are particularly relevant. The TIMSS collected trend data on fourth-grade math achievement for participating countries in 1995, 2003, and 2007. The top panel in figure 3 presents the fourth-grade scale scores in math from the TIMSS for the United States, for the 12 other countries that collected these performance data in each of these
Source: National Center for Education Statistics.
a. Data are for all public schools.
Scaled score Scaled score
Mathematics
9-year-olds
13-year-olds
Reading
Scaled score Scaled score
Mathematics Reading 200 220 240 200 190 220 210 1982 1986 1990 1994 1998 2002 1982 1986 1990 1994 1998 2002 1982 1986 1990 1994 1998 2002 1982 1986 1990 1994 1998 2002 Black Hispanic White NCLB enacted 240 230 270 260 250 280 290 240 250 260 270
three study years, and for the subset of these comparison countries that are members of the Organization for Economic Cooperation and Devel-opment (OECD).
These trend data indicate that average math achievement on the TIMSS fell for all sets of countries by roughly equal amounts between the only available pre-NCLB year (1995) and the first academic year in which
Source: National Center for Education Statistics.
a. The TIMSS (Trends in International Mathematics and Science Study) is an international assessment
of the mathematics and science knowledge of fourth- and eighth-grade students, administered every 4
years since 1995. The PIRLS (Progress in International Reading Literacy Study) is an international
assessment of the literacy achievement of fourth-grade students, administered every 5 years since 2001.
Both studies are conducted by the International Association for the Evaluation of Educational
Achieve-ment.
b. Australia, England, Hungary, Japan, Netherlands, New Zealand, Norway, and Scotland.
c. Countries in note b plus Iran, Latvia, Singapore, and Slovenia.
d. England, France, Germany, Hungary, Italy, Kuwait, Netherlands, New Zealand, Norway, Scotland,
Slovak Republic, and Sweden.
e. Countries in note d plus Bulgaria, Hong Kong, Iran, Israel, Latvia, Lithuania, Macedonia, Moldova,
Morocco, Romania, Russia, Singapore, and Slovenia.
Scaled score Reading (PIRLS) 510 520 540 530 2002 2003 2004 2005 All non-U.S.c Other OECDb United States NCLB enacted Mathematics (TIMSS) Scaled score 1994 1996 1998 2000 2002 2004 2006 2008 All non-U.S.e Other OECDd United States NCLB enacted 510 530 520 540
Figure 3. Mean Scaled Scores of Fourth-Graders on the TIMSS and the PIRLS in the United States and Other Countriesa
NCLB was implemented (2002–03). Without additional years of data, we cannot assess the extent to which these comparative changes deviate from pre-NCLB trends. However, the available TIMSS data indicate that, by 2007, math achievement had comparatively improved in the United States, particularly with respect to the other OECD countries (an improvement of 11 scale points versus 4). These cross-country trends provide suggestive evidence consistent with the hypothesis that NCLB led to improvements in the math performance of younger students in the United States. However, the comparative test-score gain for the United States is relatively modest, amounting to only a 1.35 percent increase in average performance over pre-NCLB scores, and an 8 percent increase relative to the standard devia-tion in test scores.
Moreover, like the national time-series evidence, international com-parisons provide no indication that NCLB improved the reading achieve-ment of young students. The Progress in International Reading Literacy Study (PIRLS) reports data on the reading achievement of fourth-graders across a number of countries both in 2001 and in 2006. The bottom panel of figure 3 presents overall reading scores from the PIRLS by year for the United States, the group of 26 other countries that participated in both surveys, and the OECD members of this comparison group. On average, the United States outperformed these comparison countries. However, over the period that NCLB was implemented, all three sets of countries experienced quite similar and modest changes in PIRLS read-ing achievement.
Overall, then, the international evidence is at best suggestive. Contem-poraneous changes within other countries may make them a poor compar-ison group for evaluating NCLB. The lack of multiple years of data also makes it difficult to distinguish possible policy effects from other trends or to identify any comparative differences with statistical precision. A subtler shortcoming of national and international time-series comparisons is that the presumption of a common, national effect ignores the possibil-ity of heterogeneous effects of NCLB across particular types of states and schools.
II.C. Evidence from Accountability Risk Studies
However, several recent econometric studies have creatively leveraged this heterogeneity to identify the effects of NCLB. In particular, a widely used approach involves structuring comparisons across schools or students that face different risks of sanctions under NCLB. Derek Neal and Diane Schanzenbach (2010) present evidence that following the introduction of
NCLB in Illinois, the performance of Chicago public-school students near the proficiency threshold (that is, those in the middle of the distribution) improved while the performance of those at the bottom of the distribu-tion remained the same or fell. Using data from the state of Washington, John Krieg (2008) finds that the performance of students in both tails of the distribution is lower when their school faces the possibility of NCLB sanctions.
Dale Ballou and Matthew Springer (2008), using data from a low-stakes exam fielded in seven states over a 4-year period, identify the achievement consequences of NCLB by constructing comparisons across grade-year cells that were included in AYP calculations and those that were not. Their approach takes advantage of the fact that between 2002–03 and 2005–06, states differed with respect to whether particular grades mattered for a school’s accountability rating. Hence, their identification strategy leverages the fact that if the math scores of fourth-graders counted toward a school’s accountability rating in one year but the math scores of fifth-graders in the same school did not count until the following year, one would expect student achievement to rise more quickly among fourth-graders relative to fifth-graders in the current year. Ballou and Springer find that the presence of AYP accountability modestly increased the math achievement of elementary-school students, particularly lower-performing students.
A recent study by Randall Reback, Jonah Rockoff, and Heather Schwartz (2010) adopts a similar approach, comparing student performance across elementary schools on the margin of making AYP. Using nationally representative data from the Early Childhood Longitudinal Study (ECLS), they find that reading and science scores on low-stakes tests improve by as much as 0.07 standard deviation when a school is on the margin for mak-ing AYP, but that the effects on math scores are smaller and statistically insignificant.
These accountability risk studies provide credible evidence on how NCLB-induced pressure influences the level and the distribution of student achievement. However, they have at least three potential limitations with respect to understanding the broad achievement consequences of NCLB. First, most of these studies have limited external validity because they do not rely on national data. Second, some rely on high-stakes assessments, which may not accurately reflect true student ability in the presence of strategic responses to NCLB (such as teaching to the test). Third, and perhaps most important, the treatment contrast in these studies may not approximate the full impact of NCLB because they rely on comparisons
across schools or students, all of whom were observed in the post-NCLB policy regime. To the extent that NCLB had broad effects on public schools (that is, even on students and schools not under the direct threat of sanctions), these comparisons could understate the effects of interest.
II.D. Evidence from a Comparison of States over Time
To address some of the limitations described above and estimate what one might consider the “full” impact of NCLB, we utilize a strategy that compares changes in student performance within states over time (see Dee and Jacob forthcoming). We take advantage of the fact that NCLB was explicitly modeled on an earlier generation of state-level school account-ability systems. In the decade before NCLB, about 30 states implemented consequential school accountability policies that were fundamentally sim-ilar to NCLB in that they mandated systematic testing of students in read-ing and math, public reportread-ing of school performance on these exams, and the possibility of meaningful sanctions (including school takeover, closure, or reconstitution, replacing the principal, and allowing students to change schools) based on test-based school performance. In fact, some state officials argued that NCLB needlessly duplicates preexisting state accountability systems.4
The existence of these earlier NCLB-like accountability systems estab-lishes natural treatment and control state groups. In our framework, states that adopted NCLB-like accountability before NCLB form our control group. Other states, for which NCLB catalyzed an entirely new experi-ence with consequential school accountability, form our treatment group.5
Of course, states that adopted accountability programs before NCLB were not randomly distributed. For this reason our “comparative interrupted time series” (CITS) strategy, described in more detail below, relies on within-state variation over time, allowing not only for different levels of
4. Michael Dobbs, “Conn. Stands in Defiance of Enforcing ‘No Child.’ ” Washington Post,May 8, 2005.
5. We relied on a number of different sources to categorize pre-NCLB accountability policies across states, including prior studies of such policies (for example, Carnoy and Loeb 2002, Lee and Wong 2004, and Hanushek and Raymond 2005) as well as primary sources such as the Quality Counts series put out by Education Week(“Quality Counts ’99,” January 11, 1999, www.edcounts.org/archive/sreports/qc99/), the state-specific “Account-ability and Assessment Profiles” assembled by the Consortium for Policy Research in Edu-cation (Goertz, Duffy, and Le Floch 2001), annual surveys on state student assessment programs fielded by the Council of Chief State School Officers, information from state edu-cation department websites, Lexis-Nexis searches of state and local newspapers, and con-versations with academics and state officials in several states.
achievement across states before NCLB but also for different trendsin achievement across states before NCLB.
GRAPHICAL EVIDENCE. We illustrate the logic of our identification strat-egy through a series of figures. This graphical evidence has the advantages of transparency and simplicity. We then present regression estimates that more clearly show the magnitude and statistical precision of our findings and allow us to demonstrate that the results are robust to a variety of alter-native specifications and several falsification exercises.
Figure 4 shows the trends in NAEP scores for two groups: states that had adopted school accountability by 1998 (control states), and states that
Source: National Center for Education Statistics and authors’ calculations.
a. Data are for public schools only. Treatment states are those that did not adopt consequential school accountability policies before NCLB, and control states those that had adopted such policies before 1998. A small number of states that adopted accountability programs between 1999 and 2001 are excluded.
Scaled score Scaled score
Mathematics
Fourth-graders
Eighth-graders
Reading
Scaled score Scaled score
Mathematics Reading 220 230 225 235 1994 1998 2002 2006 Control states Treatment states NCLB enacted 265 270 280 275 1994 1998 2002 2006 214 216 218 1994 1998 2002 2006 259 260 261 262 1994 1998 2002 2006
Figure 4. Mean Scaled Scores on the Main NAEP, by Timing of Increased School Accountability, 1992–2007a
had not adopted school accountability before NCLB (treatment states).6
The NAEP data are particularly well suited to this evaluation for several reasons. First, the NAEP is a technically well-developed assessment that covers a broad domain of knowledge and schools. Second, it provides consistent, state-representative measures of student performance for most states over the last two decades. Finally, the exam is a low-stakes exam for students, teachers, and schools.7 Because teachers have no incentive to
“teach to” the NAEP, it is likely to provide the most accurate measure of student achievement (Fuller and others 2007).
The figure plots the simple (unweighted) average scale score of each group of states in all years in which the exam was administered. Years are identified by the spring of the relevant academic year (for example, “1992” refers to the 1991–92 school year). The sample of states is consistent across years (that is, it is a balanced panel), and the state classification is a time-invariant characteristic. Data points to the left of the vertical line that indicates the enactment of NCLB are considered “pre-policy,” and those to the right “post-policy.”8To illustrate the pre- and post-NCLB achievement
trends within each group, we also plot the fitted regression line from a sim-ple linear regression conducted separately for each group ×period (pre- or post-NCLB).
6. These figures exclude a small number of states that adopted state accountability pro-grams between 1999 and 2001, in order to make a clear distinction between our treatment and comparison groups. However, the regression analysis described in the following sec-tion includes these “late adopter” states. Dee and Jacob (forthcoming) show that the inclu-sion of these late adopters does not change the findings in any substantive way.
7. That is, the NAEP is not used as the basis for student promotion or retention, teacher evaluation, or school accountability. Indeed, the NAEP is administered only to a small, ran-dom sample of fourth-, eighth-, and twelfth-grade students in each state.
8. When one dates the start of NCLB is a potentially important issue. NCLB secured final congressional approval on December 18, 2001, and was signed by President George W. Bush on January 8, 2002, both events thus occurring in the middle of the 2001–02 aca-demic year. NCLB is often characterized as having been implemented during 2002–03 because states were required to use testing outcomes from the previous academic year as the starting point for determining whether a school was making adequate yearly progress (Palmer and Coleman 2003; Lynn Olson, “States Strive toward ESEA Compliance,” Edu-cation Week,December 1, 2002). However, one could reasonably conjecture that the dis-cussion and anticipation surrounding the adoption of NCLB would have influenced school performance during the 2001–02 school year. Alternatively, it could also be argued that NCLB should not be viewed as in effect until the 2003–04 academic year, when new state accountability systems were more fully implemented as well as more informed by guid-ance from and negotiations with the U.S. Department of Education (Lynn Olson, “States Strive toward ESEA Compliance,” Education Week,December 1, 2002; Olson, “Taking Root,” Education Week, December 8, 2004). For a more detailed discussion, see Dee and Jacob (forthcoming).
The top left panel of figure 4, which plots trends in fourth-grade math achievement, shows that in 1992, states that did not adopt accountability until NCLB scored roughly 5 scale points (0.18 standard deviation) higher on average than states that adopted school accountability policies by 1998. Although both groups of states made modest gains between 1992 and 2000, the group that adopted accountability policies before 1998 experi-enced more rapid improvement during this period.9
If the NCLB accountability provisions had an impact on student perfor-mance, one would expect achievement to increase more after 2002 in states with no prior accountability than in states with prior accountability. It is possible that NCLB led to a level shift in student achievement, which would be manifest as a shift in the intercept after NCLB. It is also possible that NCLB changed the rate of achievement growth, which would be manifest as a change in the slopeof the achievement trend after NCLB.10
Whether one considers a shift in the intercept or a change in the slope, our identification strategy relies on a comparison of treatment versus control states that accounts not only for the pre-NCLB levels of achieve-ment in each group but also for the pre-NCLB achieveachieve-ment trends in each group.
The top left panel of figure 4 shows that the mean level of math achievement jumped noticeably in 2003 for both groups of states. How-ever, relative to prior trends, this shift was larger among the “no prior accountability” group (the treatment states). Interestingly, there was little noticeable change in the growth rateacross periods for the states with prior accountability (the control states): the slope of the achievement trend for this group is roughly the same before and after 2002. In contrast, achieve-ment rose more rapidly in states with no prior accountability from 2003 to 2007 than from 1992 through 2000, such that the growth rates after 2002 were roughly equivalent across both groups of states. These trends suggest that NCLB had a positive impact on fourth-grade math achievement.
9. This visual evidence is consistent with the earlier evaluation literature that studied pre-NCLB state accountability reforms (for example, Carnoy and Loeb 2002, Jacob 2005, and Hanushek and Raymond 2005).
10. The rate of achievement growth might have increased after NCLB for several rea-sons. First, it may take states time to implement new curricula, instructional strategies, or other support services for students. Second, later cohorts of students will have been “exposed” to NCLB for a larger fraction of their school careers than earlier cohorts. With-out imposing additional assumptions, we cannot cleanly distinguish between these effects. For this reason we focus on the “net” impact of NCLB in different years after the legisla-tion was passed.
The trends for eighth-grade math (bottom left panel of figure 4) are sim-ilar to those for fourth-grade math, although less pronounced. The pattern for fourth-grade reading (top right panel of figure 4) is much less clear. The pre-NCLB reading trends for both groups are much noisier than the math trends. In particular, the two groups both experienced a decline in achievement in 1994 and then diverged in 1998, but both had made very large gains by 2002.11 The states with prior accountability experienced a
drop in achievement from 2002 to 2003, both in absolute terms and rela-tive to trend. The other group experienced very little increase from 2002 to 2005. Perhaps most important, however, visual inspection of the data in these plots indicates that the earlier achievement trend was not linear, which is a central assumption of the linear CITS model. Similarly, the bottom right panel of the figure provides no evidence of an NCLB effect on eighth-grade reading achievement.
ESTIMATION STRATEGY. Perhaps the most straightforward approach to estimating the impact of NCLB in the framework described above is a simple difference-in-differences framework in which one compares the achievement levels of treatment and control states before and after the introduction of NCLB. However, a fundamental assumption of this model is that any preexisting trends in the outcome variables are equivalent across treatment and control groups. Figure 4 clearly showed that the con-trol states (those that implemented consequential accountability before NCLB) realized more rapid improvements during the pre-NCLB period. For this reason we estimate a more flexible specification that allows for preexisting trends to differ across groups. Our model is the following:
where Ystis a measure of student achievement for state sin year t, YEARtis a trend variable (defined as the year of the test minus 1989 so that it starts with a value of 1 in 1990), and NCLBtis a dummy variable equal to 1 for observations starting in the academic year 2002–03. YR_SINCE_NCLBtis defined as the year of the test minus 2002, so that this variable takes on a value of 1 for the 2002–03 year, which corresponds to the 2003 NAEP testing. Xst represents a vector of state × year covariates. In the main
( )1 Yst =β0 +β1YEARt +β2NCLBt +β3
(
YR_SINCE NCLB_ t))
+(
×)
+(
×)
+ × β β β 4 5 6 T YEAR T NCLB T YR SINCE s t s t s _ _NNCLBt st s st(
)
+β7X + +ε ,11. The graph is scaled to accentuate what are really quite small absolute changes from year to year.
specification the only state-year covariates included are the fraction and its square of students who were tested but excluded from official reporting because of limited English proficiency or some type of learning disability. The variables µsand strepresent state fixed effects and a mean-zero ran-dom error, respectively.
Tsis a time-invariant variable that measures the treatment imposed by NCLB. In the most basic setup, Tscould be specified as a dummy variable, with a value of 1 indicating that a given state did not institute consequen-tial accountability before NCLB. This is the approach implicitly taken in figure 4. However, it is more accurate to view the “treatment” provided by the introduction of NCLB in the framework of a dosage model. Slightly more than half of the states that introduced consequential school account-ability before NCLB did so within the 4 years before NCLB’s implemen-tation. The simple binary definition of Tsabove could lead to attenuated estimates of the NCLB effect, because the control group would include some states for which the effects of prior state policies and NCLB are closely intertwined.
For this reason we instead define Tsas the number of years during our panel period that a state did not have school accountability. Specifically, we define the treatment as the number of years without prior school accountability between the 1991–92 academic year and the onset of NCLB. Hence, states with no prior accountability have a value of 11. Illi-nois, which implemented its policy during the 1992–93 school year, has a value of 1; Texas has a value of 3, since its policy started in 1994–95; and Vermont has a value of 8, since its program started in 1999–2000. Our identification strategy implies that the larger the value of this treatment variable, the greater the potential impact of NCLB.
This regression specification allows for an NCLB effect that can be reflected in both a level shift in the coefficient on the outcome variable (β5) and a shift in the coefficient on the achievement trend variable (β6), each of which varies with treatment status, Ts. Specifications based on alternative functional forms generate results similar to those based on this canonical CITS design.12For the sake of parsimony, the impact estimate we report is
the effect of NCLB by 2007 for states with no prior accountability relative to states that adopted school accountability in 1997 (the mean adoption
12. For example, we get similar results when we allow for a separate NCLB “effect” unique to each post-NCLB year. We also find similar results when we measure treatment status with multiple dummy variables, allowing the trend and shift variables to differ across groups of states that were early, middle, or late adopters of pre-NCLB accountability.
year among states that adopted accountability before NCLB).13For all
models we present standard errors clustered by state to account for serial correlation and other forms of heteroskedasticity.
The primary threat to causal inference in our CITS design is the existence of time-varying unobservable factors that are coincident with the introduc-tion of NCLB, affect treatment and control states differently, and inde-pendently affect student performance. One example is endogenous student mobility, such as might occur if NCLB caused families to leave or return to the public schools. Another problematic scenario would be one where either the treatment or the control states recovered from the 2001 recession more quickly. As discussed below, we examine the empirical relevance of these concerns in several ways and find no evidence that our findings are biased. Other threats to the causal validity of this state-based research design are closely linked to exactly how the NCLB impact estimates from equation 1 should be interpreted. For example, our estimates will capture the impact of the accountability provisions of NCLB but notthe effects of other NCLB pro-visions such as Reading First or the “highly qualified teacher” provision, which were unique nationwide. Second, under the maintained assumption that NCLB was effectively irrelevant in states with prior consequential accountability systems, our estimates will identify the effects of NCLB-induced school accountability provisions for a particular subgroup of states (those without prior accountability policies). To the extent that one believes that those states expecting to gain the most from accountability poli-cies adopted them before NCLB, the results we report would understate the average treatment effects of school accountability. Similarly, our estimates will also understate the general effects of school accountability if NCLB amplified the effects of school accountability within the states that already had it. An alternative concern is that the accountability systems within control states may have been weakened as they were adjusted in response to NCLB. To the extent this occurred, our CITS approach would instead overstate the effects of NCLB. We suspect this concern is not empirically relevant because the school reporting and performance sanctions occasioned by NCLB (such as the possibility of school reconstitution or closure) were strong relative to prior state accountability policies. There is also direct empirical evidence
13. Specifically, the effect as of 2007 would be calculated as β5+ β6(5) in the simple
case where Tsis binary, but as β5(6) + β6(6 ×5) in our preferred specification where Tsis
allowed to vary across states and the NCLB effect is identified relative to a state that imple-mented school accountability in 1997. As a practical matter, both approaches generate sim-ilar results (Dee and Jacob forthcoming, table 3).
consistent with this assumption: Dee and Jacob (forthcoming) find that states with preexisting school accountability systems did not change their proficiency thresholds after the onset of NCLB.
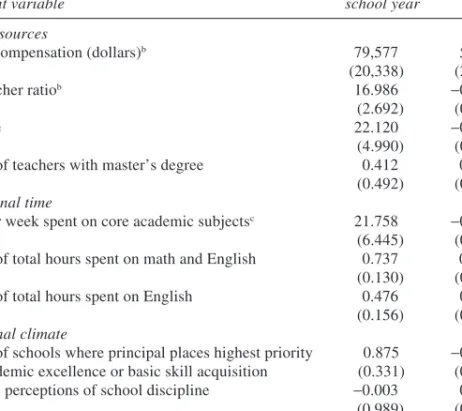
RESULTS. Table 1 presents estimates of regressions, based on equation 1, of the impact of NCLB on student performance in mathematics and read-ing. Overall, the results suggest that NCLB had uniformly positive effects on math performance among elementary students, particularly fourth-graders. The mean impact of 7.2 score points for fourth-grade math trans-lates to an effect size of 0.23 standard deviation. The effects are even larger toward the left of the ability distribution. These estimates suggest that NCLB increased the proportion of fourth-graders reaching the basic level on NAEP by 10 percentage points, or a 16 percent increase relative to the control mean of 64 percent. Although the mean effects for eighth-graders are not statistically significant at conventional levels (a 0.10-standard-deviation effect, with a p-value of 0.12), the effects at the bottom tail are stronger. NCLB increased the fraction of eighth-graders reaching the basic level in math by 5.9 percentage points (9 percent).
Although we find that NCLB had larger impacts on the mathematics per-formance of lower-achieving students, we do not find any evidence that the introduction of NCLB harmed students at higher points on the achievement distribution. In contrast to some prior work within individual districts and states, we find that NCLB seems to have increased achievement at higher points on the achievement distribution more than one might have expected. For example, in fourth-grade math the impacts at the 75th percentile were only 3 scale points lower than those at the 10th percentile.
In contrast to the mathematics results, we do not find consistent evidence that NCLB influenced student achievement in reading. The NCLB impact estimates for the reading measures are smaller and, in most cases, statistically indistinguishable from zero. The one notable exception is the finding that NCLB improved the reading performance of higher-achieving fourth-graders (those at the 75th and the 90th percentiles) modestly but significantly. How-ever, as noted earlier, a caveat to the reading results is the suggestive evi-dence that the pre-NCLB trends in reading achievement, which are noisy and nonlinear, poorly match the assumptions of the CITS design. Further-more, the capacity of this research design to detect effects on the reading achievement of eighth-graders is attenuated by the fact that only 2 years of pre-NCLB NAEP data are available for this grade-subject combination.
To test the sensitivity of our results to some of the potentially time-varying unobservable factors described above, we conducted a series of falsification exercises in which we reestimated equation 1 with a variety of
Table 1.
Regressions Estimating the Effect of NCLB on Fourth- and Eighth-Grade NAEP Mathematics and Reading Scores
a Mat h e m atics Reading Fourt h grade Eig h t h grade Fourt h grade Eig h t h grade (39 states, N = 227) (38 states, N = 220) (37 states, N = 249) (34 states, N = 170) Mean pre-NCLB Mean pre-NCLB Mean pre-NCLB Mean pre-NCLB outco m e in states outco m e in states outco m e in states outco m e in states Esti m ated wit h out prior Esti m ated wit h out prior Esti m ated wit h out prior Esti m ated wit h out prior D ependent variable effect accountability effect accountability effect accountability effect accountability
Mean NAEP score
7.244** 224 3.704 272 2.297 216 − 2.101 261 (2.240) (2.464) (1.441) (2.070) Percent of pupils 10.090** 64 5.888** 64 2.359 61 − 3.763 73 achieving at or above (3.145) (2.680) (1.592) (2.561) basic level 75th-percentile 6.634** 244 4.340** 296 2.258** 240 1.289 282 NAEP score (1.902) (2.189) (0.938) (2.249) 90th-percentile 5.205** 259 2.537 314 2.097** 258 1.172 299 NAEP score (1.916) (2.404) (0.805) (2.897)
Source: Authors’ regressions. a. Each reported coefficient is from a separate regression specified as in equation 1 in the text and is the sum of coefficients
β5
and
β6
. Effects are as of 2007 for states with no prior
accountability relative to states that adopted school accountability in 1997. See the text for details. Standard errors cluster
ed by state are in parentheses. Asterisks indicate statistical
alternative outcome measures, including state-year poverty rates, median household income, employment-population ratios, and the fraction of stu-dents in the public schools. Across 40 regressions (10 models for each of the four grade ×subject combinations), we find only one estimate signifi-cant at the 5 percent level and three estimates signifisignifi-cant at the 10 percent level. These largely null findings suggest that the assumptions required for identification are indeed met. In Dee and Jacob (forthcoming), we also show that the results presented in table 1 are robust to a host of alternative specifications, including the inclusion of a variety of state-year covariates,
Table 2. Regressions Estimating the Effect of NCLB on Fourth- and Eighth-Grade NAEP Mathematics Scores, by Ethnicity and Eligibility for Free School Lunch Programa
Whites Blacks
Mean pre-NCLB Mean pre-NCLB
outcome in states outcome in states Estimated without prior Estimated without prior Dependent variable effect accountability effect accountability Fourth-graders
Mean NAEP score
OLS 5.953** 232 4.582 203
(1.990) (5.436)
WLS 5.074** 233 15.378** 202
(2.159) (3.710)
Percent of pupils achieving at or above basic level
OLS 7.278** 76 8.431 35
(3.016) (6.693)
WLS 7.597** 77 22.690** 33
(3.531) (6.199)
Eighth-graders
Mean NAEP score
OLS 2.863 281 9.261 241
(2.561) (6.774)
WLS 1.828 282 8.826 242
(3.680) (8.999)
Percent of pupils achieving at or above basic level
OLS 4.740* 74 9.977 28
(2.639) (7.886)
WLS 4.253 76 10.004 28
(3.134) (11.955)
Source: Authors’ regressions.
a. Each reported coefficient is from a separate regression and estimates the effect of NCLB as of 2007.
See table 1 and the text for details. OLS =ordinary least squares; WLS =weighted least squares (weighting
by student enrollment). Standard errors clustered by state are in parentheses. Asterisks indicate statistical significance at the ***1 percent, **5 percent, or *10 percent level.
the inclusion of state-specific time trends, the inclusion of a full set of year fixed effects, and weighting the data by the number of students enrolled in that state and year.14Moreover, the inclusion of 2009 NAEP data does
not change the basic pattern of results presented here.
Table 2 reports regression estimates separately by subgroup, both unweighted and weighted by student enrollment. Interestingly, the positive
Hispanics Eligible for free school lunch Not eligible for free school lunch
Mean pre-NCLB Mean pre-NCLB Mean pre-NCLB
outcome in states outcome in states outcome in states Estimated without prior Estimated without prior Estimated without prior
effect accountability effect accountability effect accountability
12.409** 204 6.934* 212 3.916 232 (4.540) (3.604) (3.102) 11.625** 204 9.734** 212 2.603 234 (1.572) (2.836) (2.907) 12.499* 40 11.186* 49 5.388 76 (6.334) (5.769) (4.435) 25.883** 36 17.256** 49 6.832** 78 (2.779) (4.986) (3.118) 20.031** 246 10.702* 257 2.199 279 (5.766) (6.155) (3.924) 8.219** 247 15.761** 256 0.992 281 (4.135) (5.631) (4.171) 22.006** 36 12.773* 47 3.152 72 (4.618) (7.328) (4.045) 18.692** 36 23.432** 46 2.392 74 (4.666) (6.398) (3.478)
14. Dee and Jacob (forthcoming) show that these results are also robust to measuring the intensity of the treatment imposed by NCLB in terms of the stringency of the profi-ciency standards imposed by the state. Wong, Cook, and Steiner (2009) find this as well.
effects are particularly large among lower-income and minority stu-dents. For example, among fourth-graders, NCLB increased the math achievement of black and Hispanic students. Interestingly, the enrollment-weighted estimates are systematically larger than the unenrollment-weighted esti-mates for low-income and black students. For example, the weighted estimate for African-American students is 15.4 points (roughly 0.5 stan-dard deviation) compared with the unweighted estimate of 4.6 points. Taken at face value, this suggests an important source of treatment-effect heterogeneity, namely, that NCLB had a more positive effect on disadvan-taged students in states with a greater number of such children (for exam-ple, NCLB was more effective for black students in Alabama than for black students in South Dakota). However, given the relatively small number of treatment states with large populations of black students, the possibility that this heterogeneity reflects other state-specific traits can-not be discounted. The effect of NCLB on Hispanic students was also quite large (roughly 12 points) and did not vary with weighting. The weighted impact on students eligible for subsidized lunches was 9.7 points (roughly 0.3 standard deviation).
II.E. Evidence from Public- and Private-School Comparisons
The above comparison of trends in student performance within states over time suggests that NCLB had a substantial impact on math achieve-ment, particularly among disadvantaged students in fourth grade. As with any nonexperimental design, however, the findings rest on assumptions that cannot be fully tested. For this reason we present results from a com-plementary analysis that makes use of an alternative control group.
In this approach we assess the impact of NCLB by comparing trends over time in student performance in public versus Catholic schools.15
Stu-dents in private schools are eligible to participate in a number of major programs under the ESEA, and NCLB’s reauthorization of ESEA left these prior provisions largely intact (U.S. Department of Education 2007), implying that the NCLB reforms were comparatively irrelevant for private schools. The use of Catholic schools in this analysis improves upon interna-tional comparisons by providing a within-nation control group. However, as with the national and international time-series evidence, this approach
15. In earlier work (Dee and Jacob forthcoming) we identify several potential concerns with using Catholic schools to identify the impact of NCLB.
also conflates the effects of NCLB across states and schools where its impact was heterogeneous.
Figure 5, which follows the same structure as figure 4 in comparing treatment and control states, shows pre- and post-NCLB achievement trends across public and Catholic schools. Although the performance of both public and Catholic students trended upward during the sample period, the latter consistently outperformed their public-school counterparts. How-ever, following the implementation of NCLB, the math performance of public-school students converged somewhat toward that in the Catholic schools and entered a period of somewhat stronger trend growth. This comparative convergence is particularly pronounced for fourth-graders and is consistent with the other time-series evidence suggesting that NCLB
Source: National Center for Education Statistics.
Scaled score Scaled score
Mathematics
Fourth-graders
Eighth-graders
Reading
Scaled score Scaled score
Mathematics Reading 220 215 230 225 235 245 240 1992 1996 2000 2004 Public Catholic NCLB enacted 265 270 280 290 275 285 295 1992 1996 2000 2004 215 220 225 230 235 1992 1996 2000 2004 260 265 270 275 280 1992 1996 2000 2004
Figure 5. Mean Scaled Scores on the Main NAEP in Public and Catholic Schools, 1990–2007
improved math achievement, particularly among younger students. The reading achievement trends of eighth-graders are quite similar across public and Catholic schools, suggesting the absence of a meaningful NCLB impact. However, the reading achievement of public-school fourth-graders trended upward during the NCLB era, particularly relative to that of Catholic-school fourth-graders, which began a distinctive downward trend during the NCLB era.
These public-Catholic comparisons are broadly consistent with the state-based comparisons, suggesting that NCLB led to substantial gains in the mathematics achievement of fourth-graders and possibly of eighth-graders as well. These particular cross-sector comparisons also suggest that NCLB increased the reading achievement of fourth-graders. A recent study by Manyee Wong, Thomas Cook, and Peter Steiner (2009) includes regression estimates based on public-Catholic comparisons of this sort and draws similar conclusions. They also find similar, although less precisely estimated, results in comparisons of public schools and non-Catholic pri-vate schools.
II.F. Summary of Achievement Effects
Given the national scope of the policy, assessing the causal impact of NCLB on student performance is not straightforward. However, the body of evidence presented above seems to suggest that the federal school accountability policy did improve the math achievement of elementary students, particularly among socioeconomically disadvantaged groups. Comparable evidence that NCLB generated meaningful improvements in reading achievement is lacking, however. Moreover, the analysis pre-sented above focuses exclusively on elementary schools. NCLB also requires AYP determinations for high schools, but here relatively little is known about NCLB’s effects, in part because of data limitations: for exam-ple, no state-level data for secondary-school math achievement on the main NAEP are available after 2000.
What is the relevance for policy of the overall gains in math achieve-ment that NCLB appears to have brought about? One way to benchmark a 7.2-point (0.23-standard-deviation) gain in fourth-grade math achievement is to compare this effect with achievement gaps that are of interest. For example, a test-score gain of this size is equivalent to approximately 24 per-cent of the black-white test-score gap observed in the 2000 NAEP data. Furthermore, because NCLB appears to have been more effective among disadvantaged subgroups, it may have contributed to closing some achieve-ment gaps. For example, the effect of NCLB on the math achieveachieve-ment of
Hispanic fourth-graders was roughly 6 points larger than the corresponding effects on white students, implying that NCLB closed the white-Hispanic achievement gap by 19 percent.
III. Impact of NCLB on the Organization and Practice
of Education
Given the encouraging effects on math achievement and the somewhat puzzling lack of effects for reading, it is natural to ask how NCLB affected the organization and practice of elementary education across the coun-try. Such evidence on potential mediating mechanisms could not only guide revisions to the NCLB legislation, but also shed light on the edu-cation production function in ways that would inform other school reforms. To provide some coherence to the discussion that follows, we group nonachievement outcomes from a variety of sources into several broad categories: changes in educational resources, changes in instruc-tional focus or methods or both, and changes in school organization, cli-mate, or culture.
III.A. Impact on Education Expenditure
The direct costs of managing an accountability system are quite small on a per-pupil basis (Hoxby 2002). However, standards-based reforms have often been presented to the public as a trade: greater resources and flexibility for educators in exchange for greater accountability. One of the most strident criticisms of NCLB is that it failed to deliver on this bargain. However, there is surprisingly little research on the relationship between school accountability and spending, despite an extensive literature on edu-cation finance more generally.
One notable exception is an analysis of district-level expenditure data from 1991–92 to 1996–97 by Jane Hannaway, Shannon McKay, and Yasser Nakib (2002). Examining four states that implemented compre-hensive accountability programs in the 1990s—Kentucky, Maryland, North Carolina, and Texas—they find that only two (Texas and Kentucky) increased educational expenditure more than the national average (but those two did so substantially). Hannaway and Maggie Stanislawski (2005) present evidence that the major pre-NCLB accountability reforms in Florida were associated with increased expenditure for instructional staff support and professional development, particularly in low-performing schools. Of course, it is difficult to determine whether the accountability policy caused the increased expenditure or whether both were merely parts of a broader
16. Also as before, the figures omit states that adopted school accountability programs between 1999 and 2001, because the impacts of these state programs might be confounded with the introduction of NCLB in 2002. In the regression estimates discussed below, how-ever, we include all states.
reform agenda. Overall, the extant literature offers at best suggestive evi-dence on how accountability reforms may have influenced school spending. To provide new evidence on how NCLB influenced local school finances, we pooled annual, district-level data on revenue and expenditure from U.S. Census surveys of school district finances (the F-33 Annual Sur-vey of Local Government Finances) over the period from 1994 to 2008 (Dee, Jacob, and Schwartz 2010). Our analytical sample consists of all operational, unified school districts nationwide (roughly 10,000) for each survey year. To identify the effects of NCLB accountability on district finances, we utilize the same cross-state trend analysis described above, comparing within-state changes in school finance measures across states with and without pre-NCLB accountability programs.
Figure 6 shows trends in district expenditure over time separately for states that adopted consequential accountability before NCLB and those that did not. All results are reported in 2009 dollars and are weighted by district enrollment. As in the earlier figures, the trend lines are fitted linear regression lines.16The top left panel of figure 6 shows that total per-pupil
expenditure rose more quickly from 1994 to 2002 in states that adopted pre-NCLB accountability policies. But following the introduction of NCLB, spending grew more slowly in these early-adopting states, suggest-ing that NCLB increased expenditure. The top right and bottom left panels of the figure show comparable results for the two largest categories of total expenditure, instructional and support service spending.
Table 3 presents regression estimates based on the model in equation 1, with the inclusion of the following district-year controls: enrollment, enrollment squared, the fraction of the student population that is black or Hispanic, the poverty rate (based on 2000 census data), the poverty rate squared, and the interaction between the poverty rate and the fraction black or Hispanic. As in earlier models, we present standard errors clustered by state. We report estimates of the impact of NCLB as of 2008 for states that did not have consequential accountability before NCLB relative to states that adopted consequential accountability in 1997.
The results indicate that NCLB increased total current expenditure by $570 per pupil, or by 6.8 percent from the 1999–2000 mean of $8,360. The increased expenditure was allocated to direct instruction and support
ser-Source: Authors’ calculations using data from the Common Core of Data’s Local Education Agency
(School District) Finance Survey.
a. All data are for elementary and secondary school expenditure. Sample is composed of all noncharter,
unifed local education agency school districts, excluding Hawaii, the District of Columbia, and
zero-enrollment districts. Estimates are weighted by district enrollment. Treatment and control states are
defined as in figure 4.
Thousands of 2009 dollars per pupil Thousands of 2009 dollars per pupil
Total Instructional
Thousands of 2009 dollars per pupil Thousands of 2009 dollars per pupil
Support services Other
7.5 9.5 9.0 8.5 8.0 10.0 1996 2000 2004 2008 1996 2000 2004 2008 Control states
Treatment states
NCLB enacted 2.6 2.7 2.8 2.9 3.0 3.1 3.2 3.3 3.4 5.0 5.5 6.0 1996 2000 2004 2008 1996 2000 2004 2008 0.34 0.36 0.38 0.40
Figure 6. Expenditure per Pupil by Timing of Increased School Accountability, 1995–2008a
vices in proportions roughly equivalent to average spending patterns, with effects of $430 (8.3 percent) and $155 (5.6 percent), respectively. Results presented in the bottom two rows of the table reveal that the increased expenditure was not matched by corresponding increases in federal sup-port, consistent with allegations that NCLB constitutes an unfunded mandate. (However, the increase in spending on student support is not statistically significant at conventional levels.) In results not shown here, we find that the effects were fairly similar across districts with different baseline levels of student poverty, suggesting that NCLB did not meaning-fully influence distributional equity. Moreover, in results reported else-where, we demonstrate that these findings are robust to the same falsification
exercises and alternative specifications described earlier for the achieve-ment analysis (Dee, Jacob, and Schwartz 2010).17
In light of the achievement effects discussed in the previous section, a natural and policy-relevant question is to ask how the monetized bene-fits of those test-score gains compare with the corresponding expenditure increases presented here. On the basis of prior estimates that a 1-standard-deviation increase in elementary math scores is associated with an 8 percent increase in adult earnings (Krueger 2003), the 0.23-standard-deviation impact of NCLB would translate into a lifetime earnings boost of 1.8 per-cent. Assuming a 3 percent discount rate, the present discounted value as of age 9 of such an increase beginning at age 18 is at least $13,300.18
Hence, even if we assume that the increased expenditure due to NCLB is
17. As discussed in related work, we do not find substantial impacts on class size, sug-gesting that the increase in instructional expenditure due to NCLB may have been allocated to other functions (Dee, Jacob, and Schwartz 2010).
18. This calculation uses an age-earnings profile of 18- to 65-year-olds taken from the March 2007 Current Population Survey. Allowing for reasonable productivity-related growth in earnings of 2 percent a year increases the monetized benefit of the test-score gains due to NCLB to roughly $25,500.
Table 3. Regressions Estimating Effects of NCLB on Education Expenditure by Function and Revenue by Source
Constant (2009) dollars per pupil
Mean for 1999–2000 Estimated impact
Dependent variable school year of NCLBa
Expenditure
Total current expenditure, K-12 8,360 570**
Instructional (2,061) (237) 5,209 430*** Support services (1,428) (137) 2,786 155 Other (772) (112) 365 −0.015 (111) (25) Revenue Federal 660 42 (473) (31)
State and local 9,155 448
(2,250) (288)
Source: Authors’ regressions.
a. Each reported coefficient is from a separate regression, based on roughly 140,000 district-year observations, that identifies the effect of NCLB as of 2008. See table 1 and the text for details. Standard deviations or standard errors clustered by state are in parentheses. Asterisks indicate statistical signifi-cance at the ***1 percent, **5 percent, or *10 percent level.