Doctoral Dissertations Student Theses and Dissertations
Spring 2014
Sparse nonlinear optimization for signal processing and
Sparse nonlinear optimization for signal processing and
communications
communications
Zengli YangFollow this and additional works at: https://scholarsmine.mst.edu/doctoral_dissertations Part of the Electrical and Computer Engineering Commons
Department: Electrical and Computer Engineering Department: Electrical and Computer Engineering Recommended Citation
Recommended Citation
Yang, Zengli, "Sparse nonlinear optimization for signal processing and communications" (2014). Doctoral Dissertations. 2267.
https://scholarsmine.mst.edu/doctoral_dissertations/2267
This thesis is brought to you by Scholars' Mine, a service of the Missouri S&T Library and Learning Resources. This work is protected by U. S. Copyright Law. Unauthorized use including reproduction for redistribution requires the permission of the copyright holder. For more information, please contact [email protected].
by
ZENGLI YANG
A DISSERTATION
Presented to the Faculty of the Graduate School of the MISSOURI UNIVERSITY OF SCIENCE AND TECHNOLOGY
In Partial Fulfillment of the Requirements for the Degree DOCTOR OF PHILOSOPHY
in
ELECTRICAL ENGINEERING 2014
Approved by
Yahong Rosa Zheng, Advisor Chengshan Xiao
Reza Zoughi Steve Grant Serhat Hosder
PUBLICATION DISSERTATION OPTION
This dissertation consists of the following three published or accepted papers, formatted in the style used by the Missouri University of Science and Technology, listed as follows:
Paper I, Z. Yang, Y. R. Zheng, and S. L. Grant, “Proportionate affine projection sign algorithm for network echo cancellation,” has been published in IEEE Transactions on Audio, Speech, and Language Processing, vol. 19, no. 8, pp. 2273–2284, Nov. 2011.
Paper II, Z. Yang, and Y. R. Zheng, “A comparative study of compressed sensing for 3-D synthetic aperture radar image reconstruction,” has been accepted in Elsevier Digital Signal Process., pp. 1–28, Mar. 2014.
Paper III, Z. Yang, and Y. R. Zheng, “Robust adaptive channel esti-mation in MIMO underwater acoustic communications,” has been accepted in MTS/IEEE OCEANS’14, Taipei, Taiwan, Apr. 7–10, 2014, pp. 1–6.
ABSTRACT
This dissertation proposes three classes of new sparse nonlinear optimization algorithms for network echo cancellation (NEC), 3-D synthetic aperture radar (SAR) image reconstruction, and adaptive turbo equalization in input multiple-output (MIMO) underwater acoustic (UWA) communications, respectively.
For NEC, the proposed two proportionate affine projection sign algorithms (APSAs) utilize the sparse nature of the network impulse response (NIR). Benefiting from the characteristics of l1-norm optimization, affine projection, and proportionate matrix, the new algorithms are more robust to impulsive interferences and colored input than the conventional adaptive algorithms.
For 3-D SAR image reconstruction, the proposed two compressed sensing (CS) approaches exploit the sparse nature of the SAR holographic image. Combining CS with the range migration algorithms (RMAs), these approaches can decrease the load of data acquisition while recovering satisfactory 3-D SAR image through l1-norm optimization.
For MIMO UWA communications, a robust iterative channel estimation based minimum mean-square-error (MMSE) turbo equalizer is proposed for large MIMO de-tection. The MIMO channel estimation is performed jointly with the MMSE equalizer and the maximuma posteriori probability (MAP) decoder. The proposed MIMO de-tection scheme has been tested by experimental data and proved to be robust against tough MIMO channels.
ACKNOWLEDGMENTS
First and foremost, I would like to gratefully and sincerely thank my advisor Dr. Yahong Rosa Zheng. I truly appreciate her support and guidance for my Ph.D. study and research work during the past four years. She has provided numerous valuable suggestions and discussions to make this dissertation possible, and has culti-vated my ability of independent thinking. She has also given me the opportunities to work on practical wireless communication projects. These valuable experiences not only enhance my theoretical understanding but also lay a solid foundation for my future career. Her enthusiasm and attitudes towards research were contagious and motivational for me.
I would also like to thank the members of my advisory committee, Drs. Cheng-shan Xiao, Reza Zoughi, Steve L. Grant and Serhat Hosder, for their precious time in examining this dissertation and their constructive suggestions to my research work.
In addition, it is my pleasure to acknowledge my particular appreciation to some of my co-authors and labmates, especially Mr. Bing Han, Mr. Weimin Duan, Ms. Tiange Shao, Mr. Kajbaf Hamed, and Mr. Joseph T. Case, with whom I worked on the theoretical problems or the practical projects. I enjoyed the productive discussions and collaborations. I also cherish the time that I spent with all the other group members in the research lab.
Last, but certainly not the least, I wish to express my heartful thanks to my family for their unselfish love, everlasting support and sacrifice. Particularly, this dissertation is dedicated to my brilliant and outrageously loving and supportive wife, Hui He, our brand new, exuberant, smart and lovely baby boy, Lewis Yanche Yang, and to my always encouraging, ever faithful parents, Chuandong Yang and Lingyun Zeng.
TABLE OF CONTENTS
Page
PUBLICATION DISSERTATION OPTION . . . iii
ABSTRACT . . . iv ACKNOWLEDGMENTS . . . v LIST OF ILLUSTRATIONS . . . ix LIST OF TABLES . . . xi SECTION 1 INTRODUCTION . . . 1
1.1 BACKGROUND AND PROBLEM STATEMENT . . . 1
1.2 SUMMARY OF CONTRIBUTIONS . . . 5
PAPER I. PROPORTIONATE AFFINE PROJECTION SIGN ALGORITHMS FOR NETWORK ECHO CANCELLATION . . . 8
ABSTRACT . . . 8
1 INTRODUCTION . . . 9
2 PROPORTIONATE AFFINE PROJECTION SIGN ALGORITHMS . 13 3 COMPUTATIONAL COMPLEXITY . . . 17
4 SIMULATION RESULTS . . . 18
4.1 PERFORMANCE COMPARISON BETWEEN THE PROPORTIONATE APSAS AND OTHER ALGORITHMS . . . . 19
4.2 DOUBLE-TALK SCENARIO . . . 23
4.3 CHARACTERISTICS OF THE PROPORTIONATE APSAS . . . 23
4.4 EFFECT OF SPARSENESS OF THE IMPULSE RESPONSES . . 27
4.5 TRACKING PERFORMANCE OF THE PROPORTIONATE APSAS . . . 30
5 CONCLUSION . . . 36
6 APPENDIX: GEOMETRICAL ILLUSTRATION OF CONVERGENCE 37 7 ACKNOWLEDGEMENT . . . 45
8 REFERENCES . . . 46
II. A COMPARATIVE STUDY OF COMPRESSED SENSING APPROACHES FOR 3-D SYNTHETIC APERTURE RADAR IMAGE RECONSTRUCTION 49 ABSTRACT . . . 49
1 INTRODUCTION . . . 50
2 CONVENTIONAL 3-D SAR IMAGE RECONSTRUCTION WITH FULL SAMPLING . . . 54
3 COMPRESSED SENSING APPROACHES FOR 3-D SAR IMAGE RE-CONSTRUCTION . . . 57
3.1 TWO COMPRESSED SENSING APPROACHES . . . 57
3.2 SPLIT BREGMAN FRAMEWORK FOR 3-D IMAGE RECONSTRUCTION . . . 58
4 SIMULATIONS AND EXPERIMENTAL RESULTS . . . 62
4.1 IMAGE QUALITY METRICS AND PARAMETER SELECTIONS 62 4.2 SIMULATIONS AND RESULTS . . . 65
4.2.1 Reconstruction Performance . . . 65
4.2.2 Computational Complexity . . . 70
4.3 EXPERIMENTS AND RESULTS . . . 70
5 CONCLUSION . . . 73
6 APPENDIX: PROCEDURES FOR UPDATING AUXILIARY VARI-ABLES IN THE SPLIT-BREGMAN ALGORITHM FOR 3-D SAR IM-AGE RECONSTRUCTION . . . 74
7 REFERENCES . . . 75
III. ROBUST ADAPTIVE CHANNEL ESTIMATION IN MIMO UNDERWATER ACOUSTIC COMMUNICATIONS . . . 78
ABSTRACT . . . 78
2 SIGNALING AND DATA STRUCTURE . . . 81
3 ITERATIVE MIMO CHANNEL ESTIMATION BASED TURBO MMSE EQUALIZATION . . . 83
3.1 SYSTEM MODEL . . . 84
3.2 ITERATIVE MIMO UWA CHANNEL ESTIMATION . . . 85
3.2.1 MMSE Nonadaptive Channel Estimation . . . 85
3.2.2 IPNLMS Adaptive Channel Estimation . . . 86
3.3 LOW-COMPLEXITY MIMO MMSE TURBO EQUALIZATION . 88 4 EXPERIMENTAL RESULTS . . . 90 5 CONCLUSION . . . 96 6 ACKNOWLEDGEMENT . . . 97 7 REFERENCES . . . 98 SECTION 2 CONCLUSIONS . . . 100 3 PUBLICATIONS . . . 102 BIBLIOGRAPHY . . . 104 VITA . . . 105
LIST OF ILLUSTRATIONS
Figure Page
SECTION 1
1.1 Structure of a network echo canceller (NEC). . . 2 PAPER I
1 Structure of a network echo canceller (NEC). . . 13 2 Typical impulse responses of the echo path for NEC applications. . . 20 3 Normalized misalignment comparison of the APA, PAPA, APSA and
RP-APSA without interference. . . 21 4 Normalized misalignment comparison of the NLMS, PNLMS, IPNLMS, NSA,
APSA, RP-APSA and RIP-APSA with interference. . . 21 5 Normalized misalignment comparison of the APA, PAPA, IPAPA, NSA,
APSA, RP-APSA and RIP-APSA with interference. . . 22 6 Speech signals used in the double-talk scenario. . . 24 7 Performance of the APSA family, nonrobust and robust PAPA for speech
signals during double-talk. . . 25 8 Normalized misalignment of the proportionate APSA with varying
projec-tion orders M = 1,2,5,10. . . 26 9 Convergence of the RP-APSA for different ρ using µ= 0.005. . . 28 10 Convergence of the RIP-APSA for different values of α using µ= 0.005. . . 29 11 Number of samples to reach the −25 dB normalized misalignment against
different sparseness measure of ten systems for the APSA, RP-APSA and RIP-APSA. . . 29 12 Tracking performance of the APSA, RP-APSA and RIP-APSA. . . 30 13 Steady-state excess MSE of the RP-APSA as a function of the step size µ. 33 14 Steady-state excess MSE vs. the step size µ for the RP-APSA and
RIP-APSA with varying projection order and proportionate parameters. . . 34 15 Two dimensional weight vector space observation for NLMS. . . 38 16 Geometrical illustration of NLMS weight updating process. . . 40
17 Geometrical illustration of APSA weight updating process. . . 43 PAPER II
1 Conventional 3-D SAR image reconstruction methods. . . 55 2 Normalized error vs. γ1 with Nouter = 4 and Nouter = 10 for the two CS
approaches. . . 64 3 Ground truth image, and reconstructed image from 100% raw data using
conventional methods. . . 66 4 Reconstructed images from undersampled simulated measurements using
the CS approaches. . . 67 5 Averaged MSSIM of the reconstructed 3-D SAR images, using the CS
ap-proaches, with varying undersampling rates and SNRs. . . 68 6 Averaged MSSIM of the reconstructed 3-D SAR images using the CS
ap-proaches with varying undersampling rates andη. . . 69 7 Averaged running time for the two CS approaches with varying
undersam-pling rate. . . 71 8 Schematic of the rubber pads in the scanned area of SUT. . . 71 9 The reconstructed images from undersampled experimental measurements,
using the CS approaches, with 40% data. . . 72 PAPER III
1 Signaling process on nth transmit branch. . . 81 2 The burst structure of the nth transmit branch in the SPACE08 experiment. 81 3 MIMO detector using iterative channel estimation and turbo MMSE
equal-ization. . . 82 4 The partition of the transmitted pilot and data payload. . . 84 5 Structure of N ×M MIMO adaptive channel estimator. . . 86 6 An example of the estimated channel impulse responses in the SPACE08
experiment. . . 91 7 Experimental results with iterative MIMO channel estimator and MMSE
LIST OF TABLES
Table Page
PAPER I
1 Proportionate Affine Projection Sign Algorithms . . . 16 2 Computational Complexity of Algorithms’ Coefficients Update . . . 17 PAPER III
1 Description On The Hydrophone Arrays . . . 90 2 Results of 2×6 MIMO Transmission . . . 93
1.1 BACKGROUND AND PROBLEM STATEMENT
Sparse nonlinear optimization [1] [2] is to solve the large-scale problem with sparse nature efficiently and effectively. In the last decade, sparse nonlinear opti-mization has made significant achievements and has been widely researched in many signal processing applications: system identification, radar imaging, magnetic reso-nance imaging (MRI), wireless communication, etc. This dissertation proposed three classes of sparse nonlinear optimization algorithms for network echo cancellation, 3-D synthetic aperture radar (SAR) image reconstruction, and adaptive turbo equalization in multiple-input multiple-output (MIMO) underwater acoustic (UWA) communica-tions, respectively.
A network echo canceller (NEC) is an adaptive filter essential to modern voice communication networks. An NEC first estimates the echo path of the network, generates a replica of the network impulse response (NIR), and then subtracts the replica of the far-end echo from the near-end signal to obtain clean signals. Although NEC is a classic system identification application, modern VoIP (Voice over Internet Protocol) and telephone networks impose several challenges on conventional adaptive filters. The first is that today’s large scale network often experiences long delays and causes long network impulse responses (NIRs) that require adaptive filters with 1000 or more taps; while the traditional network only requires adaptive filters with less than 100 taps. However, the response of the long-distance/local-loop interface is still typically only 6 to 12 milliseconds long, which with a typical sample rate of 8 kHz yields a flat delay of zero to nearly 900 samples followed by a damped ringing of about 50 samples. This means that the NIR is typically rather sparse, in that most of the
coefficients are close to zero. The second challenge is that the excitation signals in NECs are speech signals which are often highly colored non-Gaussian processes rather than white Gaussian noises. Many adaptive algorithms suffer reduced convergence rate in this scenario. The third challenge of NEC is due to double-talk where both near-end speech and far-end speech are active simultaneously. This often causes extremely slow convergence or even divergence in adaptive filters.
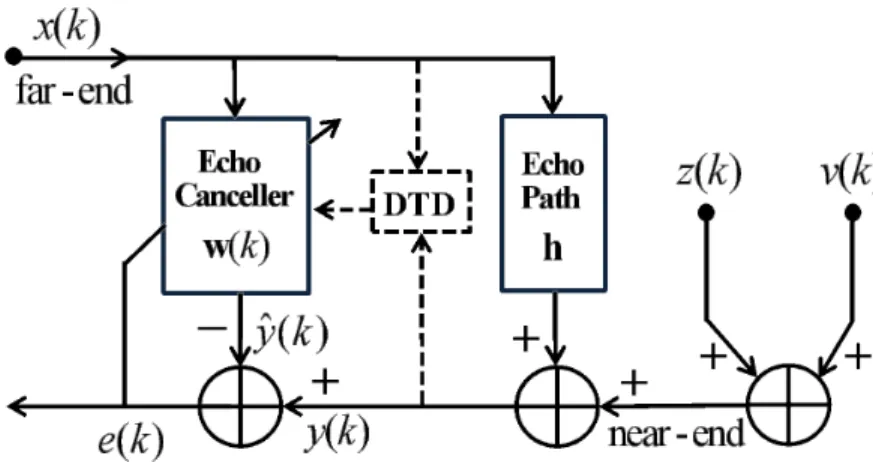
The NEC scheme is shown in Fig. 1.1, where x(k) is the far-end signal, z(k) and v(k) are the near-end speech and background noise signal, respectively. The NIR of the true echo path is denoted by a length Lcoefficient vector h.
Figure 1.1. Structure of a network echo canceller (NEC).
The estimated impulse response of the NEC is denoted byw(k) = [w0(k), w1(k), . . . , wL−1(k)]T, where k is the time index and the superscript T denotes transpose.
The signal y(k) contains the echo, the near-end speech, and background noise. That is, y(k) = xT(k)h+z(k) +v(k), where x(k) = [x(k), x(k −1), . . . , x(k−L+ 1)]T is
the far-end signal vector. Generating the replica echo ˆy(k) = xT(k)w(k), the NEC tries to minimize the difference between y(k) and ˆy(k) with an adaptive w(k).
Different from the l2-norm algorithms [3], the formulation of sparse nonlinear optimization for NEC is obtained by minimizing thel1-norm of the a posteriori error vector with a constraint on the filter coefficients,
min
w(k+1) ky(k)−X
T(k)w(k+ 1)
k1 (1.1)
subject to kw(k+ 1)−w(k)k22 ≤µ2 (1.2) where µ2 is a parameter to ensure the weight coefficient vector does not change too
much in one iteration, X(k) = [x(k),x(k−1), . . . ,x(k−M+ 1)],y(k) = [y(k), y(k−
1), . . . , y(k−M + 1)]T, and M is the projection order.
Wideband 3-D SAR imaging has important applications in the area of non-destructive testing and evaluation (NDT&E). This is due to its feasibility to acquire high-resolution holographic images of specimen under test. Microwave and millime-ter wave as inmillime-terrogating signals can not only penetrate dielectric mamillime-terials but also interact with their inner structure to render a comprehensive image for inspection. Microwave and millimeter wave NDT&E techniques have been applied to diverse ap-plications (i.e., the detection and evaluation of corrosion under paint and composite laminates, the detection and sizing of fatigue cracks in metal surfaces, and the char-acterization of dielectric material). However, the speed of data acquisition for these wideband 3-D SAR imaging systems hinders their practical applications due to the slowness of mechanical scanning. For example, uniform raster scanning requires ap-proximately one hour to scan a 120×180 mm2 area at 2 mm spacing. In contrast,
random undersampling can reduce the acquisition time when the antenna probe is placed at only a fractional number of positions on the uniform grid. Advanced sparse methods are required to reconstruct images when undersampled measurements are used.
For 3-D SAR image reconstruction, the sparse nonlinear optimization problem can be interpreted as [4] min ˆ g J(gˆ) subject to kΦˆg−rk 2 2 < σ2, (1.3)
where k · k2 is the l2 norm, gˆ ∈ CN×1 is the vectorized estimated 3-D SAR image, σ2 is the noise variance, and Φ∈ CM×N (M < N) is the measurement matrix that
reflects the acquisition of the vectorized raw measurements r∈CM×1. For the Stolt-CS and NUFFT-Stolt-CS, Φ is the reverse Stolt-RMA and NUFFT-RMA, respectively. The measurement operator Φcan be written as
ΦStolt =UF2D−1
Θ†[F3D(·)] , (1.4)
ΦNUFFT=UF2D−1{FNUFFT[F2D(·)]}, (1.5)
Note that the phase compensation term is omitted for brevity. Here, Θ† represents the pseudoinverse 1-D Stolt transform with the nearest neighbor interpolation, F3D
denotes the 3-D FFT, and U denotes the binary matrix that is used to select the random (x, y) positions for random undersampling.
The cost function J(ˆg) represents some l1 regularization term with respect to
ˆ
g. In this paper, it is selected as
J(ˆg) = γ2
2kΨˆgk1+
λ
2kDˆgk1, (1.6) where k · k1 denotes the l1 norm, Ψ ∈ CN×N is the linear operator that transforms
the image from voxel representation into a sparse representation, D is the discrete 3-D isotropic TV operator, andγ2 and λ are the weights for the consistency of thel1
MIMO UWA communications are challenging for three main reasons: first, the available channel bandwidth is very limited; second, the multipath delay is excessively long; third, the Doppler spread effect is significantly large. Accurate channel estima-tion is crucial in achieving satisfactory performance for MIMO UWA communica-tions. The traditional block-based least squares (LS) or minimum mean-square-error (MMSE) channel estimation techniques often need the periodic training sequence and the inversion of large matrix. In comparison, the iterative channel estimation based on the adaptive algorithms, such as least mean squares (LMS) or recursive least square (RLS) algorithms [3], can better track the time-varying frequency-selective channel. As the required adaptive filter lengths grows, the conventional normalized LMS (NLMS) [3] algorithm suffers a slow convergence rate, thus requiring long train-ing sequence. However, it is desirable to use short traintrain-ing sequence to reduce the overhead and increase the data transmission efficiency. With short training sequence, this slow convergence rate degrades the accuracy of the channel estimation.
This dissertation develops several robust iterative or adaptive signal processing algorithms to solve these sparse nonlinear optimization problems. For NEC, two adaptive solutions are proposed and evaluated under the environment of impulsive interference and colored input. For 3-D SAR image, two iterative reconstruction algorithms are proposed, which utilize the principle of compressed sensing (CS) and radar imaging. For MIMO UWA communications, the proposed iterative improved proportionate NLMS (IPNLMS) MIMO channel estimator is performed jointly with the MMSE turbo equalizer [5] at the receiver, which ensure efficient and effective soft information exchange between the equalizer and the decoder.
1.2 SUMMARY OF CONTRIBUTIONS
This dissertation consists of two journal publications and one conference paper as listed in the publication list. My contributions that are published or accepted are:
1. Proportionate affine projection sign algorithms for sparse system iden-tification in impulsive interference. Two new proportionate affine projection sign algorithms (APSAs) are proposed for NEC applications where the impulse response is often real-valued with sparse coefficients and long filter length. The proposed proportionate-type algorithms can achieve fast convergence and low steady-state mis-alignment. Benefiting from the characteristics of l1-norm optimization, affine projec-tion, and proportionate matrix, the new algorithms are more robust to impulsive inter-ferences and colored input than the proportionate least mean squares (PNLMS) algo-rithm [6] and the robust proportionate affine projection algoalgo-rithm (Robust PAPA) [7]. The computational complexity of the new algorithms is lower than the affine projec-tion algorithm (APA) family due to the eliminaprojec-tion of the matrix inversion.
2. Compressed sensing approaches and comparative study for 3-D synthetic aperture radar image reconstruction. By utilizing the sparse nature of 3-D synthetic aperture radar (SAR) images, the proposed two compressed sensing (CS) approaches can reconstruct satisfactory images with undersampled measurements. Combining CS with the range migration algorithm (RMA), using either Stolt transform or non-uniform fast Fourier transform (NUFFT), yields two different approaches: Stolt-CS and NUFFT-CS. These approaches can decrease the load of data acquisition through
l1-norm optimization. Both the simulation and the experimental reconstruction re-sults demonstrate that the NUFFT-CS achieves a good tradeoff between the recon-struction quality and the computational costs.
3. Robust iterative channel estimation based adaptive turbo equalizer in multiple-input multiple-output underwater acoustic communications. For UWA com-munications, a robust iterative channel estimation based MMSE adaptive turbo equal-izer is proposed and studied for MIMO detection. Rather than the classical MMSE or NLMS estimation algorithms, the IPNLMS [8] is adopted for the iterative MIMO
channel estimator to utilize the sparse nature of UWA channel. The MIMO chan-nel estimation is performed jointly with the MMSE equalizer and the maximum a
posteriori probability (MAP) decoder. With inter-block interference removed, the
MIMO MMSE equalization is performed with overlapped information subblocks with-out guard intervals, thus a high transmission efficiency is guaranteed and performance degradation is prevented. The proposed MIMO detection scheme has been tested by experimental data and proved to be robust against tough MIMO channels.
PAPER
I. PROPORTIONATE AFFINE PROJECTION SIGN ALGORITHMS FOR NETWORK ECHO CANCELLATION
Zengli Yang, Yahong Rosa Zheng, and Steven L. Grant
ABSTRACT—Two proportionate affine projection sign algorithms (APSAs) are
proposed for network echo cancellation applications where the impulse response is of-ten real-valued with sparse coefficients and long filter length. The proposed proportionate-type algorithms can achieve fast convergence and low steady-state misalignment by adopting a proportionate regularization matrix to the APSA. Benefiting from the characteristics of l1-norm optimization, affine projection, and proportionate matrix, the new algorithms are more robust to impulsive interferences and colored input than the proportionate least mean squares (PNLMS) algorithm and the robust proportion-ate affine projection algorithm (Robust PAPA). The new algorithms also achieve much faster convergence rate in sparse impulse responses than the original APSA and the normalized sign algorithm (NSA). The new algorithms are robust to all types of NEC impulse response with different sparseness without the need to change parameters or estimate the sparseness of the impulse response. The computational complexity of the new algorithms is lower than the affine projection algorithm (APA) family due to the elimination of the matrix inversion.
1 INTRODUCTION
A network echo canceller (NEC) is an adaptive filter essential to modern voice communication networks. An NEC first estimates the echo path of the network, generates a replica of the network impulse response (NIR), and then subtracts the replica of the far-end echo from the near-end signal to obtain clean signals. Although NEC is a classic system identification application, modern VoIP (Voice over Internet Protocol) and telephone networks impose several challenges on conventional adaptive filters. The first is that today’s large scale network often experiences long delays and causes long network impulse responses (NIRs) that require adaptive filters with 1000 or more taps; while the traditional network only requires adaptive filters with less than 100 taps. However, the response of the long-distance/local-loop interface is still typically only 6 to 12 milliseconds long, which with a typical sample rate of 8 kHz yields a flat delay of zero to nearly 900 samples followed by a damped ringing of about 50 samples. This means that the NIR is typically rather sparse, in that most of the coefficients are close to zero. The second challenge is that the excitation signals in NECs are speech signals which are often highly colored non-Gaussian processes rather than white Gaussian noises. Many adaptive algorithms suffer reduced convergence rate in this scenario. The third challenge of NEC is due to double-talk where both near-end speech and far-end speech are active simultaneously. This often causes extremely slow convergence or even divergence in adaptive filters.
As the required adaptive filter lengths grow, the conventional normalized least mean squares (NLMS) [1] algorithm exhibits a slower convergence rate. This slow convergence rate becomes noticeable in that echo is often heard, especially in the first few seconds of a connection. The proportionate NLMS (PNLMS) [2] has been designed to ameliorate this situation by exploiting the sparse nature of the NIR. By
selecting a proportionate matrix at each iteration, PNLMS updates each coefficient in the weight vector proportionate to its magnitude. This results in very fast initial convergence for sparse NIRs relatively independent of their length. However, the drawback of PNLMS is that, though it has fast initial convergence for sparse NIRs, it has slower convergence than NLMS for non-sparse NIRs. This problem has been addressed by several modifications to PNLMS. The first is PNLMS++ [3] which has two versions, one where the adaptation algorithm alternates between both PNLMS and NLMS in successive sample periods and another where both updates are com-bined in each sample period. The resulting convergence is generally the better of the two algorithms. That is, PNLMS++’s convergence is like PNLMS’s for sparse NIRs and like NLMS’s for dispersive NIRs. Another modification to PNLMS is the im-proved PNLMS (IPNLMS) [4] which has the feature of being optimal for a given NIR sparseness. This feature has later been exploited in a class of sparseness-controlled (SC) [5] algorithms which measure the sparseness of the developing coefficients on-the-fly. Another approach is to use adaptive combination of proportionate filters [6] which adaptively mix the outputs of two independent adaptive filters together based on IPNLMS. In addition, the µ-law PNLMS (MPNLMS) [7] is an optimal step-size algorithm modified from PNLMS.
A number of proportionate algorithms are also developed for the affine projec-tion algorithm (APA) [1] which is well known for its better convergence than NLMS for colored input. These proportionate algorithms include proportionate APA (PAPA), improved proportionate APA (IPAPA) [8] and “memory”-IPAPA (MIPAPA) [9]. The IPAPA extends the proportionate matrix of IPNLMS [4] directly to APA; while the MIPAPA designs an efficient matrix to reduce computational complexity. Both algo-rithms improve convergence rate over that of PNLMS in practical NEC applications where the inputs are speech and the NIRs are sparse. However, they have higher
complexity than PNLMS algorithms because they generally require a matrix inver-sion where the size of the matrix is the order of the projection. In practice, the projection orders are typically around ten and direct matrix inversion of this size may be too expensive.
In addition to convergence rate and complexity, another challenging problem in NEC is the double-talk problem. Typically, a double-talk detector (DTD) is used to detect this situation, and the adaptation of the coefficients is inhibited by setting the step-size to zero for a periodThold during double-talk. Completely reliable DTDs
are notoriously difficult to design because the NEC has stringent requirements on its detection. Even the first few samples of double-talk can lead to divergence of the adaptive filter. One approach to mitigate the effect of double-talk is to design the adaptive filter to be especially robust to DTD errors. Several algorithms have been developed in this robustness approach, such as the robust PNLMS and robust PAPA [10]. Another approach treats the double-talk as variable background noise and adapts the step-size of the adaptation algorithm accordingly. This is the philosophy behind variable step-size NLMS NLMS) [11] and variable step-size APA (VSS-APA) [12]. Yet a third strategy is to use adaptive algorithms based on l1 rather than l2 error norms because l1 algorithms are especially robust to impulsive noise like speech. A conventional l1 algorithm is the normalized sign algorithm (NSA). Unfortunately, NSA’s robustness comes at the price of slower than NLMS convergence. Recently, a new affine projection sign algorithm (APSA) [13] addresses this problem and provides good robustness and fast convergence. Indeed it has been shown [13] that APSA achieves faster convergence and lower steady-state normalized misalignment than NLMS, APA, and NSA under impulsive interference. This is achieved without the need for a matrix inversion as in APA.
In this paper we combine the proportionate approach with APSA to obtain even faster convergence when the echo path is sparse. The resulting algorithm is called
proportionate APSA. Two types of proportionate matrix, one based on PNLMS [2] and another based on IPNLMS [4], are applied to the APSA for real-coefficient sys-tems and the resulting coefficient proportionate APSA (RP-APSA) and real-coefficient improved proportionate APSA (RIP-APSA) achieve fast convergence in sparse NEC applications with robustness to colored input and double-talk. The com-putational complexity of the two proportionate APSAs is slightly higher than the original APSA but is lower than the APA family. The RIP-APSA also exhibits espe-cially good robustness in all types of NIRs without the need to change parameters or estimate the sparseness of the NIRs.
2 PROPORTIONATE AFFINE PROJECTION SIGN ALGORITHMS
Consider the NEC scheme shown in Fig. 1, where x(k) is the far-end signal,
z(k) andv(k) are the near-end speech and background noise signal, respectively. The NIR of the true echo path is denoted by a length L coefficient vector h. The level of the sparseness in the NIR may vary according to the changing network environment, which is measured by [14], ξ= L L−√L 1− √khk1 Lkhk2 (1)
where 0≤ξ≤1, and the p-norm is defined by
khkp := L−1 X l=0 |hl|p 1/p . (2)
In the extreme case, if h is a pure impulse, then ξ = 1. On the other hand, if all the elements of h have equal value, then ξ = 0. In other words, a larger ξ corresponds to a sparser impulse response, while a smaller ξ corresponds to a more dispersive impulse response. .
The estimated impulse response of the NEC is denoted byw(k) = [w0(k), w1(k), . . . , wL−1(k)]T, where k is the time index and the superscript T denotes transpose.
The signal y(k) contains the echo, the near-end speech, and background noise. That is, y(k) = xT(k)h+z(k) +v(k), where x(k) = [x(k), x(k −1), . . . , x(k−L+ 1)]T is
the far-end signal vector. Generating the replica echo ˆy(k) = xT(k)w(k), the NEC tries to minimize the difference between y(k) and ˆy(k) with an adaptive w(k).
Different from thel2-norm algorithms [1,2,4], the original APSA algorithm [13] is obtained by minimizing thel1-norm of thea posteriori error vector with a constraint on the filter coefficients,
min
w(k+1) ky(k)−X
T(k)w(k+ 1)
k1 (3)
subject to kw(k+ 1)−w(k)k22 ≤µ2 (4) where µ2 is a parameter to ensure the weight coefficient vector does not change too
much in one iteration, X(k) = [x(k),x(k−1), . . . ,x(k−M+ 1)],y(k) = [y(k), y(k−
1), . . . , y(k−M+ 1)]T, andM is the projection order. Using the method of Lagrange
multipliers, we get
w(k+ 1) =w(k) + 1
2λX(k)sgn[e(k)] (5)
where λ is a Lagrange multiplier, the error vector e(k) = y(k)−XT(k)w(k), and sgn[·] is the signum function. For sparse h, we would like to adapt the coefficients of w(k) proportionately by pre-multiplying the update vector with a proportionate matrix. Then, (5) can be rewritten as
w(k+ 1) =w(k) + 1
where G(k) =diag{g0(k), . . . , gL−1(k)}is a diagonal proportionate matrix whose
ele-ments may be selected according to [2, 4]. Using (4) and (6), we obtain 1 2λ = µ q xT gs(k)xgs(k) (7)
where xgs(k) = G(k)X(k)sgn[e(k)]. Substituting (7) into (6) and adding a small
positive parameter δ to avoid possible division by zero, the weight updating equation for the proportionate APSAs is
w(k+ 1) =w(k) + q µxgs(k) δ+xT
gs(k)xgs(k)
(8)
where µis regarded as the step size satisfying µ >0.
In this paper, we choose the proportionate matrixG(k) according to [2] and [4], and for valued systems, we call the resulting proportionate-type algorithms real-coefficient proportionate APSA (RP-APSA) and real-real-coefficient improved proportion-ate (RIP-APSA), respectively. The proposed two new algorithms are summarized in Table 1. For RP-APSA, the parameterρpreventswl(k) from stalling when it is much
smaller than the largest coefficient andqregularizes the updating when all coefficients are zero at initialization. For α = −1, the RIP-APSA and APSA are identical. For
Table 1. Proportionate Affine Projection Sign Algorithms
Algorithms RP-APSA RIP-APSA
Initialization w(0)=0L×1 Parameters ρ=0.01 or 0.1, q=0.01 α=0 or −0.5, ε=0.01 Proportionate matrix γmin=ρmax(q,|w0(k)|, . . . ,|wL−1(k)|) γl(k)= max(γmin,|wl(k)|) gl(k)=12−Lα+(1+2kwαl()k|w)kl1(+k)ε| gl(k)=kγγl(k) l(k)k1/L Adaptation G(k)=diag{g0(k), . . . , gL−1(k)} e(k)=y(k)−XT(k)w(k), xgs(k)=G(k)X(k)sgn[e(k)] w(k+ 1)=w(k)+ µxgs(k) √δ+xT gs(k)xgs(k)
3 COMPUTATIONAL COMPLEXITY
The computational complexity of the proportionate APSAs are compared with that of conventional algorithms in terms of the total number of additions, multipli-cations, divisions, comparisons, square-roots, and direct matrix inversions (DMIs). With filter length L and projection order M, the complexities are shown in Table 2. Although APA behaves better than NLMS, APA has higher complexity because the number of multiplications and the size of the DMI increase proportionately to M2.
In contrast, the APSA does not require matrix inversion thus the projection orderM
does not affect the number of multiplications, and the number of additions is only linearly dependent on M. Note that APSA does not require matrix inversion, thus the APSAs are more efficient than APA. With a modest increase in the proportionate matrix computation, the proportionate APSAs behave much better than the original APSA, especially for sparse NIRs.
Table 2. Computational Complexity of Algorithms’ Coefficients Update (DMI = Direct matrix inversion)
Algorithm ADD MUL DIV CMP SQRT DMI (size)
NLMS L 2L+1 1 0 0 No PNLMS 2L−1 4L+1 2 2L 0 No IPNLMS 3L 4L+1 2 0 0 No APA (M2+M−1)L (M2+M+1)L+M2 0 0 0 M×M IPAPA (M2+M+1)L (M2+M+2)L+M2 0 0 0 M×M APSA M L 2L 1 0 1 No RP-APSA (M+1)L−1 5L 2 2L 1 No RIP-APSA (M+2)L 5L 2 0 1 No
4 SIMULATION RESULTS
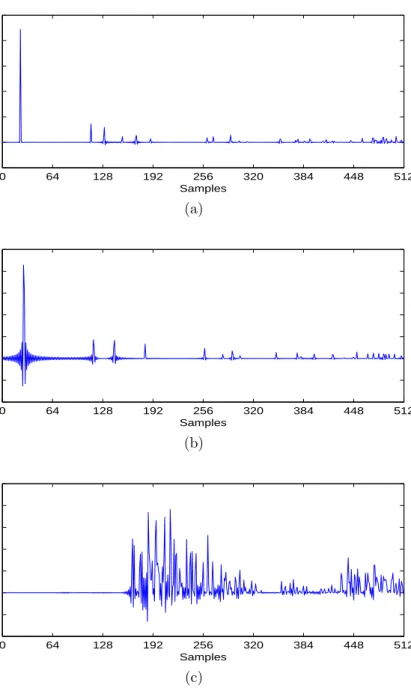
The proposed algorithms were evaluated via computer simulations. The echo path had 512 coefficients with some significant (active) coefficients and many near zero (inactive) coefficients. Fig. 2 shows three typical impulse responses of the echo path with sparseness measures ξ = 0.895, ξ = 0.758 and ξ = 0.556, respectively. Throughout our simulations except the double-talk scenario (Section 4.2), the input signalx(k) was a first order autoregressive signal (AR(1)) with a pole at 0.8; while the white Gaussian noise (WGN) v(k) was added to the near-end to give a signal-to-noise ratio (SNR) of 30 dB. The near-end signal z(k) was a strong impulsive interference with a signal-to-interference ratio (SIR) of−10 dB and it was modeled by a Bernoulli-Gaussian (BG) signal [13, 15]. The BG distribution was generated as the product of a Bernoulli process and a Gaussian process, i.e., z(k) = ω(k)n(k), where n(k) was WGN with zero mean and variance σ2
n, and ω(k) was a Bernoulli process with the
probability mass function given as P(ω) = 1−P r for ω = 0, and P(ω) = P r for
ω = 1. The average power of the BG process was P r·σ2
n. Keeping the average power
constant, the BG process was spikier when P r was smaller. It reduced to a Gaussian process when P r= 1. We chose P r= 0.001 for our simulations.
For the double-talk scenario in Section 4.2, both near-end and far-end signals were speech segments and the background noise was WGN. The SIR and SNR were 6 dB and 30 dB, respectively. The classical Geigel DTD [10, 16] was used to inhibit adaptation by setting µ= 0 for Thold period when both near-end speech and far-end
speech were detected as being active simultaneously. In Geigel DTD, double-talk is declared if
|y(k)| ≥ϑmax|x(k)|,|x(k−1)|, ...,|x(k−L+ 1)| (9) where ϑ is the detection threshold.
The performance of the algorithms was mainly measured by the normalized misalignment and the excess mean-square error (MSE) (in dB). The normalized mis-alignment is defined by η(k) = 10 log10kh−w(k)k 2 2 khk2 2 . (10)
Excess MSE reflects the MSE that is in excess of the minimum MSE, which is based on ensemble averaging of the squared estimation excess error |eex(k)|2. Here,
eex(k) = xT(k)h−xT(k)w(k). (11)
In our simulations, both misalignment and excess MSE behaved similarly in all cases. Therefore, only misalignment curves are shown here for brevity. In addi-tion, the regularization parameter δ = 0.01 for all the following algorithms except the improved proportionate-type algorithms [4], where δIP = 12−Lαδ. The simulation
results shown were obtained by ensemble averaging ten independent trials.
4.1 PERFORMANCE COMPARISON BETWEEN THE
PROPORTIONATE APSAS AND OTHER ALGORITHMS
The normalized misalignment of the l1-norm algorithms were compared with that of the l2-norm ones. The NIR of the echo path was sparse with ξ = 0.758,
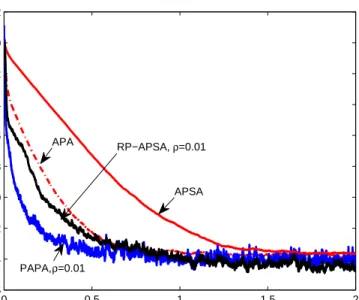
as shown in Fig. 2b. The proportionate parameters ρ and α were selected as in reference papers [2,4], as shown in Fig. 3, Fig. 4 and Fig. 5. Without interference, the step-size µwas adjusted to make the algorithms achieve the steady-state normalized misalignment of −14 dB, as shown in Fig. 3. Considering only the background noise
v(k), RP-APSA converged slower than PAPA but faster than conventional APA, while APSA had slowest convergence.
With strong interference, the step-size µ for the l2-norm algorithms was 0.1 and was adjusted to achieve the same steady-state normalized misalignment for the
0 64 128 192 256 320 384 448 512 Samples (a) 0 64 128 192 256 320 384 448 512 Samples (b) 0 64 128 192 256 320 384 448 512 Samples (c)
Figure 2. Typical impulse responses of the echo path for NEC applications. (a) Sparse impulse response withξ = 0.895. (b) Sparse impulse response withξ = 0.758. (c) Dispersive impulse response with ξ = 0.556.
l1-norm algorithms, as shown in Fig. 4 and Fig. 5. Benefiting from the robustness of l1-norm minimization, the APSA family and the NSA converged at different speeds, while the NLMS family and the APA family diverged under strong impulsive inter-ference.
0 0.5 1 1.5 2 x 10⁴ −16 −14 −12 −10 −8 −6 −4 −2 0 2 Samples Normalized misalignment (dB) APSA PAPA, ρ=0.01 RP−APSA, ρ=0.01 APA
Figure 3. Normalized misalignment comparison of the APA, PAPA, APSA and RP-APSA without interference. M = 2, µAP A = µP AP A = 0.15, µAP SA = 0.0005, µRP−AP SA = 0.001, AR(1) input with SNR=30 dB.
0 0.5 1 1.5 2 x 10⁴ −20 −15 −10 −5 0 5 Samples Normalized misalignment (dB) NLMS IPNLMS, α=0 PNLMS, ρ=0.01 NSA APSA, M=1 RP−APSA, ρ=0.01, M=1 RIP−APSA, α=0, M=1
Figure 4. Normalized misalignment comparison of the NLMS, PNLMS, IPNLMS, NSA, APSA, RP-APSA and RIP-APSA with interference. M = 1, µN LM S = µP N LM S = µIP N LM S = 0.1, µN SA = 0.3, µAP SA = 0.013, µRP−AP SA = 0.024, µRIP−AP SA = 0.022, AR(1) input with SNR=30 dB and SIR=−10 dB. Strong BG
Moreover, the steady-state normalized misalignment of the APSA family with the projection orderM = 1 and M = 2 were adjusted to be −15 dB and−20 dB, re-spectively. WithM = 1 and using only sign arithmetic, APSA performed almost the same as NSA against impulsive interference. Adding the affine projection arithmetic (M = 2), APSA outperformed NSA, as shown in Fig. 5. Combining the decorrelation property of affine projection and exploiting the sparse nature of the NIR, propor-tionate APSAs had faster convergence than APSA and NSA with both values of M. Also, the RIP-APSA converged a little faster than RP-APSA under such conditions. The advantage of proportionate APSAs for a sparse NIR is clearly demonstrated.
0 0.5 1 1.5 2 x 10⁴ −25 −20 −15 −10 −5 0 5 10 15 Samples Normalized misalignment (dB) IPAPA, α=0 APSA NSA RIP−APSA, α=0 RP−APSA, ρ=0.01 PAPA, ρ=0.01 APA
Figure 5. Normalized misalignment comparison of the APA, PAPA, IPAPA, NSA, APSA, RP-APSA and RIP-APSA with interference. M = 2, µAP A = µP AP A = µIP AP A = 0.1, µN SA = 0.15, µAP SA = 0.01, µRP−AP SA = 0.017, µRIP−AP SA = 0.014,
4.2 DOUBLE-TALK SCENARIO
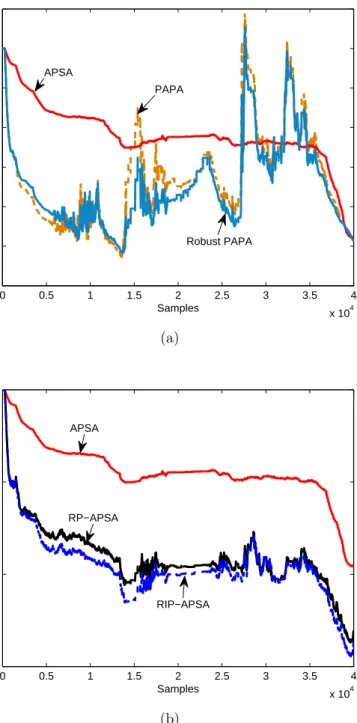
The performance of the APSA family for speech signals during double-talk were compared with the non-robust and robust PAPAs [10] with projection order
M = 5. Parameters for the robust algorithms and double-talk were almost the same as those in [10]. In detail, (ˆλ, k0, β) = (0.997,1.1,0.60665) for the robust PAPA, the average far-end to double-talk ratio was 6 dB (SIR = 6 dB), the Geigel detector assumed 6 dB attenuation (ϑ = 0.5), and the hang-over time, Thold = 240 samples.
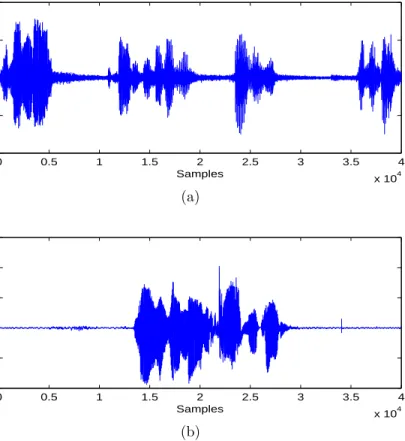
We chose the echo path shown in Fig. 2b to obtain 20 dB hybrid attenuation. The far-end speech and near-end speech used in the double-talk simulation are shown in Fig. 6. Double-talk happened in the period with sample index of [1.4,2.8]× 104.
We chose the step-size µ = 0.0002 for the APSA family and µ = 0.005 for the non-robust and non-robust PAPAs to achieve their best performance. A larger µ will make the robust PAPA diverge faster during double-talk under such parameter settings. As shown in Fig. 7, both PAPAs behaved almost the same most of the time, although robust PAPA outperformed non-robust PAPA against some double-talk disturbance. In comparison, the APSA family were more robust against double-talk than robust PAPA, and the proportionate APSAs achieved lower normalized misalignment and faster convergence rate than all other algorithms. Without the need to change the parameter settings to obtain a robustness feature, the proportionate APSAs exhibited better robustness to double-talk than robust PAPA.
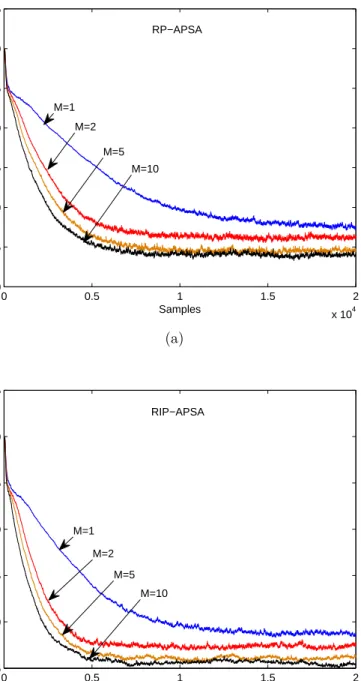
4.3 CHARACTERISTICS OF THE PROPORTIONATE APSAS
The performance of the RP-APSA and RIP-APSA with different projection orderM were studied using AR(1) input and BG interference. The step sizeµ= 0.01, echo path and other parameters were the same as those in Fig. 4. It has been shown that, for the APA family, a larger projection order M leads to faster convergence with higher steady-state misalignment in stationary environments [17]. In contrast,
0 0.5 1 1.5 2 2.5 3 3.5 4 x 10⁴ Samples (a) 0 0.5 1 1.5 2 2.5 3 3.5 4 x 10⁴ Samples (b)
Figure 6. Speech signals used in the double-talk scenario. Average Far-end speech to double-talk ratio is 6 dB (1.4×10⁴th - 2.8×10⁴th samples). (a) Far-end speech. (b)
Near-end speech.
for the RP-APSA and RIP-APSA, a larger M achieved both faster convergence and lower steady-state misalignment in sparse NIR, as shown in Fig. 8. Benefiting from the convergence behavior (see the Appendix), the new algorithms can exploit the advantage of affine projection even in the steady-state.
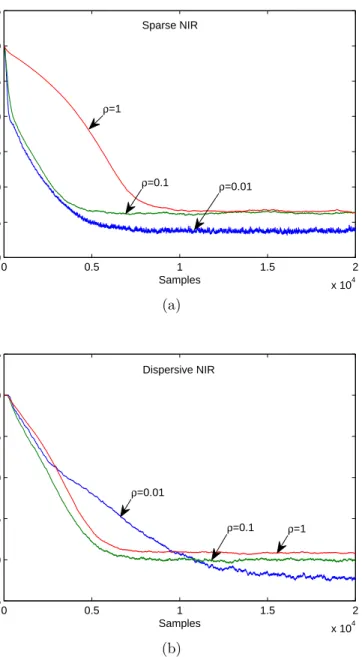
The effects of proportionate matrix were investigated for both sparse and dis-persive NIRs using the AR(1) input and BG interference. Impulse responses shown in Fig. 2a and Fig. 2c were used in the simulation with step size µ = 0.005. The results are shown in Fig. 9 for RP-APSA and in Fig. 10 for RIP-APSA. Similar to the effect ofρ on PNLMS as shown in [2], the RP-APSA with a smaller ρ (ρ= 0.01) lead to a higher convergence rate and lower steady-state misalignment simultaneously
0 0.5 1 1.5 2 2.5 3 3.5 4 x 10⁴ −12 −10 −8 −6 −4 −2 0 2 Samples Normalized misalignment (dB) APSA PAPA Robust PAPA (a) 0 0.5 1 1.5 2 2.5 3 3.5 4 x 10⁴ −15 −10 −5 0 Samples Normalized misalignment (dB) APSA RIP−APSA RP−APSA (b)
Figure 7. Performance of the APSA family, nonrobust and robust PAPA for speech signals during double-talk. M = 5, ρ = 0.01, α = 0. (a) µAP SA = 0.0002, µP AP A = µRobust P AP A = 0.005, (ˆλ, k0, β) = 0.997,1.1,0.60665). (b) µAP SA = µRP−AP SA = µRIP−AP SA = 0.0002.
0 0.5 1 1.5 2 x 10⁴ −30 −25 −20 −15 −10 −5 0 5 Samples Normalized misalignment (dB) M=5 M=10 M=1 M=2 RP−APSA (a) 0 0.5 1 1.5 2 x 10⁴ −25 −20 −15 −10 −5 0 5 Samples Normalized misalignment (dB) M=1 M=2 M=5 M=10 RIP−APSA (b)
Figure 8. Normalized misalignment of the proportionate APSA with varying projec-tion orders M = 1,2,5,10. The input, interference and echo path were the same as those in Fig. 4. The step size µ = 0.01. (a) RP-APSA, ρ = 0.01. (b) RIP-APSA,
for sparse NIR because more proportionality of the NIR was exploited. However, for the dispersive NIR, little proportionality can be utilized and most of the filter coeffi-cients were updated at a similar rate. Therefore, if ρis too small, it deteriorated the performance of RP-APSA with slower convergence but maintained lower steady-state misalignment than that of a large ρ.
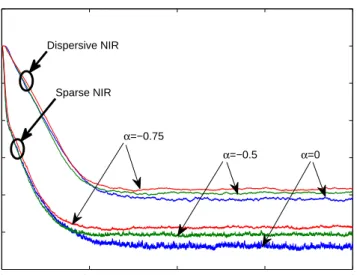
The effect of α on the convergence of the RIP-APSA are shown in Fig. 10 for both sparse and dispersive NIRs. According to [4], α = 0 and α = −0.5 were good choices for the improved proportionate algorithms to achieve robustness to different sparseness of NIRs in practice. The RIP-APSA with α = 0 achieves a little lower steady-state misalignment in both NIRs. In contrast to the effect of ρ on the RP-APSA, the RIP-APSA is less sensitive to the value of α.
4.4 EFFECT OF SPARSENESS OF THE IMPULSE RESPONSES
Ten different NIRs with sparseness measure 0.556 ≤ ξ ≤ 0.938 were used to study the effect of sparseness on the convergence of the proportionate APSAs. All step-sizes were adjusted so that the algorithms achieved almost the same steady-state normalized misalignment between −27 dB to −25 dB. The number of samples taken to achieve −25 dB normalized misalignment were used as a measure for the convergence rate versus the sparseness measure, as shown in Fig. 11. The projection order M = 2 was employed for the APSA family. The RIP-APSA with both α =
−0.5 and α = 0 outperformed the other two algorithms over the entire sparseness region, and the number of samples taken to converge decreased approximately linearly with the increase of spareness. In comparison, APSA performed worst except in dispersive NIRs with ξ < 0.64, where RP-APSA with ρ = 0.01 had particularly slow convergence. With ρ = 0.1, RP-APSA behaved similarly as RIP-APSA in the entire ξ range. For sparse NIRs with ξ > 0.7, both RP-APSA and RIP-APSA had
0 0.5 1 1.5 2 x 10⁴ −30 −25 −20 −15 −10 −5 0 5 Samples Normalized misalignment (dB) ρ=1 ρ=0.1 ρ=0.01 Sparse NIR (a) 0 0.5 1 1.5 2 x 10⁴ −25 −20 −15 −10 −5 0 5 Samples Normalized misalignment (dB) ρ=0.01 ρ=1 ρ=0.1 Dispersive NIR (b)
Figure 9. Convergence of the RP-APSA for different ρ using µ = 0.005. The input and interference were the same as those in Fig. 4. Impulse responses in Fig. 2(a) and (c) were used as the sparse and dispersive impulse responses, respectively. (a) In the sparse NIR with ξ = 0.895. (b) In the dispersive NIR with ξ= 0.556.
similar high convergence rates regardless of the selection of the proportionate matrix parameters ρ and α.
0 0.5 1 1.5 2 x 10⁴ −30 −25 −20 −15 −10 −5 0 5 Samples Normalized misalignment (dB) α=0 α=−0.75 α=−0.5 Dispersive NIR Sparse NIR
Figure 10. Convergence of the RIP-APSA for different values of α using µ= 0.005. The input and the interference were the same as those in Fig. 4.
0.550 0.6 0.65 0.7 0.75 0.8 0.85 0.9 0.95 0.5 1 1.5 2 2.5 3x 10 4 Sparseness measure ξ
Number of samples to reach −25dB
APSA
RIP−APSA (α=−0.5)
RIP−APSA (α=0) RP−APSA (ρ=0.01)
RP−APSA (ρ=0.1)
Figure 11. Number of samples to reach the −25 dB normalized misalignment against different sparseness measure of ten systems for the APSA, RP-APSA and RIP-APSA. The input and the interference were the same as those in Fig. 4. M = 2, ρ= 0.01 or 0.1 for the RP-APSA andα =−0.5 or α= 0 for the RIP-APSA.
4.5 TRACKING PERFORMANCE OF THE PROPORTIONATE APSAS
The tracking performance of the APSA, RP-APSA and RIP-APSA was also studied in the BG interference environment. As in the previously discussed simula-tions, we chose the step-sizes µAP SA= 0.003,µRP−AP SA = 0.006,µRIP−AP SA = 0.005
to make sure they achieved the same steady-state normalized misalignment under sparse NIR. The echo path changed from sparse (Fig. 2a) to dispersive (Fig. 2c) NIR at the 2×10⁴th sample. It can be seen in Fig. 12 that the RIP-APSA tracked the
change faster than the APSA and RP-APSA, but with slightly higher steady-state misalignment in the dispersive NIR. The APSA had similar slow convergence in both sparse and dispersive NIRs. Its steady-state misalignment was slightly lower than those of the RP-APSA and RIP-APSA for dispersive NIR. The tracking performance of RP-APSA was in between APSA and RIP-APSA.
0 0.5 1 1.5 2 2.5 3 3.5 4 x 10⁴ −30 −25 −20 −15 −10 −5 0 5 10 Samples Normalized misalignment (dB) APSA RP−APSA RP−APSA APSA RIP−APSA RIP−APSA
Sparse NIR Dispersive NIR
Figure 12. Tracking performance of the APSA, RP-APSA and RIP-APSA. The input and the interference were the same as those in Fig. 4. The echo path changed from sparse to dispersive at the 2×10⁴th samples. ρ = 0.01, α = −0.5, µ
AP SA = 0.003, µRP−AP SA = 0.006, µRIP−AP SA = 0.005.
4.6 SELECTION OF STEP SIZE
The relationship between step size and convergence behavior of the l2 norm
algorithms has been studied intensively in the literature [18, 19, 1, 20, 17, 21]. It has been shown that the step size of the NLMS and APA has to be bounded to 0 < µ < 2 to ensure stability. However, the stochastic model for the l1 norm algorithms is more difficult than that of the l2 norm family. Limited studies are devoted on the convergence analysis of the sign algorithm and its variations [22, 23, 24, 25, 26, 27, 28]. Attempts to finding a stability bound for the sign algorithm family have been reported in [22, 23, 24] using a second order stochastic model similar to that in the analysis of l2 algorithms. However, this approach is proved to be incorrect for l1 algorithms [25]. Instead, an interesting result for l1 algorithms is that the sign algorithm converges asymptotically for any step size µ > 0 [25]. This result is also proven to be true [27, 28] for the sign algorithm family without the Gaussianity or independence assumptions. This property does not present in the l2 norm algorithms and it proves to be a significant advantage of the sign algorithm family. Upper bounds for the time-averaged mean absolute deviation (weight misalignment) and time-averaged MSE at steady-state are found to be functions of the step sizeµ[25,27], which gives guidelines for choosing step size in practical applications.
As a member of the sign algorithm family, the APSA and proportionate APSAs exhibits similar convergence behavior to that of the pure sign algorithm in that any step size µ > 0 guarantees the asymptotic convergence and the bound is a function of µ. However, rigorous proof of this property for the APSA family is very involved mathematically because the weight adaptation formula (8) has nonlinear functions of the error in both the numerator and denominator. Attempt of theoretical analysis deserves a separate treatment. Here, numerical results for the excess MSE versus the step sizeµare provided in Fig. 13 and Fig. 14 for the RP-APSA and RIP-APSA. The simulation results were obtained by time-averaging 500 instantaneous excess square
errors in the steady-state and then averaging 10 independent trials. The step size µ
varied from 0.0005 to 10. For most simulations, we used the NIR with ξ= 0.631 for large filter length L= 512, while for small filter lengths, we used random dispersive NIRs with ξ = 0.220. Similar to the previous simulation, the input was AR(1) and the interference was a BG with P r = 0.001. The normalized misalignment versus step size performed similarly as the excess MSE and is omitted for brevity.
The steady-state excess MSEs of the RP-APSA, as shown in Fig. 13, increased with the step size µ in a similar manner for different NIR lengths. With the same step size, a larger length L yielded higher excess MSEs, which was consistent with the results in [27]. The results for the RIP-APSA is similar to Fig. 13, thus omitted here for brevity. Other parameters, such as the projection order and proportionate regularization parameters, exhibited small impact on the steady-state excess MSE of the two proportionate APSAs, as shown in Fig. 14. For a given step size µ, both proportionate APSAs with a larger M achieved a slightly lower steady-state excess MSE when µ > µt and a higher excess MSE when µ < µt, where µt =
0.002 for the RP-APSA (Fig. 14a) and µt = 0.001 for the RIP-APSA (Fig. 14b).
The value µt might change slightly depending on the proportionate regularization
parameters. Interestingly, the RP-APSA exhibited almost the same excess MSE for different projection orders at µ = 0.1 and this µ might also shift slightly depending on the proportionate regularization parameters. For a given projection order M, the impact of the proportionate regularization parameters on the excess MSE were small, as shown in Fig. 14c and Fig. 14d, except that the excess MSE of the RP-APSA with
ρ = 0.01 was a little lower than that of the other parameters. This is because the NIR of the echo path was dispersive with ξ = 0.631 and the recommended ρ = 5/L
according to [2].
Although no step sizes can cause asymptotic divergence, the steady-state ex-cess MSE is related with the step size. This convergence behavior of the APSA family
10−3 10−2 10−1 100 101 −50 −40 −30 −20 −10 0 10 20 30 40 Step size (µ) Excess MSE in dB L=512 L=64 L=32 L=16 RP−APSA, AR(1) input SIR=−10dB, BG interference with Pr=0.001
Figure 13. Steady-state excess MSE of the RP-APSA as a function of the step size
µ. The input and the interference were the same as those in Fig. 4. The projection order M = 2 and proportionate regularization parameter ρ= 0.01. The impact of L
for the RIP-APSA was similar to that of the RP-APSA, thus omitted for brevity.
will be illustrated by geometrical interpretation in Appendix. However, in the practi-cal range of excess MSE less than 0 dB, the step size has to be very small for both the RP-APSA and RIP-APSA. The range of 0 < µ < 0.1 is recommended for practical NEC applications.
10−3 10−2 10−1 100 101 −40 −30 −20 −10 0 10 20 30 40 Step size (µ) EMSE in dB M=1 M=2 M=5 M=10 M=20
RP−APSA, AR(1) input SIR=−10dB, BG interference with Pr=0.001 (a) 10−3 10−2 10−1 100 101 −40 −30 −20 −10 0 10 20 30 40 Step size (µ) Excess MSE in dB M=1 M=2 M=5 M=10 M=20
RIP−APSA, AR(1) input SIR=−10dB, BG interference with Pr=0.001
(b)
Figure 14. Steady-state excess MSE vs. the step size µ for the RP-APSA and RIP-APSA with varying projection order and proportionate parameters. The input and the interference were the same as those in Fig. 4. The filter length L= 512. (a) RP-APSA with varying M and ρ= 0.01. (b) RIP-APSA with varying M and α=−0.5.
10−3 10−2 10−1 −40 −35 −30 −25 −20 −15 −10 −5 0 5 Step size (µ) Excess MSE in dB ρ=1 ρ=0.1 ρ=0.01 RP−APSA, AR(1) input SIR=−10dB, BG interference with Pr=0.001 (c) 10−3 10−2 10−1 −40 −35 −30 −25 −20 −15 −10 −5 0 5 Step size (µ) Excess MSE in dB α=−0.75 α=0 α=−0.5 RIP−APSA, AR(1) input SIR=−10dB, BG interference with Pr=0.001
(d)
Figure 14. (c) RP-APSA with M = 2 and varying ρ. (d) RIP-APSA with M = 2 and varying α. (cont.)
5 CONCLUSION
Two proportionate affine projection sign algorithm (APSA) have been pro-posed for the identification of real-coefficient, sparse systems. With a modest increase in computational complexity over that of the original APSA, the proportionate AP-SAs can achieve faster convergence rate and lower in a steady-state misalignment in a sparse network echo path, colored input, and impulsive interference environment. The computational complexity of the two proportionate APSAs is lower than the APA family due to elimination of the matrix inversion. Especially, the RIP-APSA also exhibits good robustness in all types of NIRs without the need to change param-eters or estimate the sparseness of the NIRs. Numerical results also demonstrate that the proportionate APSAs exhibit asymptotic convergence for all step size µ > 0, but practically, a small step size of µ < 0.1 is required to achieve excess MSE less than 0 dB.
6 APPENDIX: GEOMETRICAL ILLUSTRATION OF CONVERGENCE
We now demonstrate the convergence behavior of the proportionate APSA through geometrical illustration. First consider the NLMS algorithm
e(k) =y(k)−xT(k)w(k) (12)
and
w(k+ 1) =w(k) +µx(k)[xT(k)x(k) +δ]−1e(k). (13) When µ = 1 and δ = 0, the NLMS can be shown to be a projection algorithm. Inserting (12) into (13) with µ= 1 and δ= 0 yields
w(k+ 1) = {I−x(k)[xT(k)x(k)]−1xT(k)}w(k)
+x(k)[xT(k)x(k)]−1y(k). (14)
Recall that y(k) =xT(k)h+z(k) +v(k) and define the projection matrix,
P(k) =x(k)[xT(k)x(k)]−1xT(k). (15)
We can write (14) in terms of P(k) as
w(k+ 1) = [I−P(k)]w(k) +P(k)h
+x(k)[xT(k)x(k)]−1[z(k) +v(k)]. (16)
Consider the case where there are no near-end signals, z(k) +v(k) = 0, then
Figure 15. Two dimensional weight vector space observation for NLMS.
Since [I−P(k)] is a projection matrix complementary to P(k), the coefficient update described by (17) is a classical affine projection of w(k) onto the affine subspace
defined by P(k) and h to obtain the new coefficient vector w(k+ 1). This is shown in Fig. 15 where w(k+ 1) is found by projectingw(k) onto the subspace defined by [I−P(k)] and then adding the projection of h onto the subspace defined by P(k). Let us define that particular affine subspace as Wk.
Note that the true echo path vector, h, is always in the affine subspace Wk
since replacing w(k) with h in (17) results in w(k+ 1) = h. We further note from (13) that the direction of the update is determined by the input vector x(k) and the sign of e(k).
The vectors, w(k) through w(k+ 3), in Fig. 16a shows the coefficient update over several time periods. As the adaptive coefficient vector projects onto the sub-spaces Wk, Wk+1, and Wk+2, it keeps getting closer to the true coefficient vector h.
The dotted vectors, w0(k) through w0(k+ 3), indicate the progression of the coeffi-cients when the step size µ is less than 1. These are called relaxed projections and the step size µ is also the relaxation parameter. In relaxed projections, the update
only goes part way to the affine subspace Wk. Clearly relaxed projections converge
more slowly than pure projections.
Now we consider the case when there are near-end signals, that is whenz(k) +
v(k)6= 0. The last two terms of equation (16) are the near-end speech and background noise terms of the update. The direction of the update is determined by x(k) and the sign of [z(k) +v(k)]. This effect is geometrically illustrated in Fig. 16b, where the affine projection subspaces at the various sample periods are offset by the double-talk and background noise terms. The “noisy” affine subspaces, denoted ˆWk, ˆWk+1 and
ˆ
Wk+2, are shown in dashed lines. The NLMS algorithm will project onto the noisy
subspaces rather than the true ones. Unfortunately, the noisy subspaces no longer all meet at the true NIR vector, h. However, they do “almost” intersect in an area whose size is a function of the near-end speech variance,σ2
z, and the noise variance,σ2v.
When the adaptive coefficients w(k)’s get close to the true coefficients h, they enter this zone of “almost intersection”. The smaller the relaxation value µis, the less the
w(k)’s “chase after” the noisy ˆWk, and the closer to the true coefficient vector they
remain. Thus, graphically, we have described the usual trade-off with the relaxation parameter. For large µ(close to one) there is fast convergence, but large steady-state mean squared error, and with smallµ(closer to zero) we have slower convergence but lower steady-state mean squared error.
Now consider the PNLMS algorithm
w(k+ 1) =w(k) +µG(k)x(k)[xT(k)G(k)x(k) +δ]−1e(k). (18)
This can also be shown to be a projection algorithm. To do this we make the change of variables,
(a)
(b)
Figure 16. Geometrical illustration of NLMS weight updating process. (a) z(k) +
v(k) = 0. (b) z(k) +v(k)6= 0. where p G(k) =diag{p g0(k), . . . ,p gL−1(k)}. Then (12) becomes e(k) =y(k)−xT(k)pG(k)b(k) (20) and (18) becomes,
p
G(k)b(k+ 1) = pG(k)b(k)
+µG(k)x(k)[xT(k)G(k)x(k) +δ]−1e(k). (21)
Multiplying both sides from the left by [p
G(k)]−1
b(k+ 1) =b(k) +µpG(k)x(k)[xT(k)G(k)x(k) +δ]−1e(k). (22)
We can define
s(k) =pG(k)x(k), (23)
then (20) and (22) become,
e(k) =y(k)−sT(k)b(k) (24)
and
b(k+ 1) =b(k) +µs(k)[sT(k)s(k) +δ]−1e(k). (25) Note that (24) and (25) have exactly the same form as (12) and (13) thus, under the same conditions as described for NLMS (µ = 1 and δ = 0), PNLMS is an affine projection algorithm with behavior similar to that of NLMS, but with a twist. With NLMS we saw that h was always in the affine subspaces defined in each sample period and that accordingly the convergence of the algorithm was toward the intersections of these affine subspaces, h. With PNLMS, however, it is [pG(k)]−1h
that is in each sample period’s affine subspace. SinceG(k) is time varying, the affine subspaces will not all intersect at a single point until w(k) (or equivalently, b(k)) reaches steady state. In fact, since [p
G(k)]−1h is a moving target, it speeds the
thus searches out a smaller space than otherwise the NLMS would search the entire
L-dimensional space.
Now consider the new proportionate APSA algorithm with the coefficient up-date for projection order M = 1 being
w(k+ 1) =w(k) +µxgs(k)[xgsT (k)xgs(k) +δ]−1/2 (26)
where
xgs(k) =G(k)x(k)sgn[e(k)]. (27)
Unlike the NLMS and PNLMS cases, this coefficient update cannot be manip-ulated into the form of an affine projection operation. However, the update still has some interesting properties. One is that the term in the denominator of (26) does not in general converge to zero asw(k) approachesh because of the sign operator in (27). That is, sgn[e(k)] = ±1 despite convergence. The only time xgsT (k)xgs(k) gets
small is whenG(k)x(k) has a small magnitude. IfG(k)x(k) has a large enough mag-nitude that we may ignore the small positive number δ, then the coefficient updating equation becomes
w(k+ 1) =w(k) +µxgs(k)/kxgs(k)k2. (28) Note that the update vector, µxgs(k)/kxgs(k)k2, always has a magnitude of µ. The
direction of the coefficient update is always given by xgs(k).
Though (26) through (28) do not represent an affine projection, we may con-sider the update as a relaxed affine projection ifµis sufficiently small. The relaxation factor in this case is not equal to the step size µand it changes every sample period. The length of the update remains constant each sample period. In contrast, with NLMS and PNLMS, the relaxation factor was constant, but the length of the update generally change each sample period.
(a)
(b)
Figure 17. Geometrical illustration of APSA weight updating process. (a) Large µ, far from steady state. (b) Small µ, closed to steady state.
Figure 17a shows the update of two sample periods using the new algorithms when thew(k)s are far from their steady-state values. The size of the update vector is always µregardless of how far the coefficient vector is from the affine subspace of the projection. Fig. 17b shows the case where the adaptive coefficients are in the “almost intersection” region. Since the updates are always the same size, the coefficients are
less likely to “chase after” noisy ˆWks than conventional l2-norm algorithms. This
accounts for the algorithm’s good steady-state performance and low minimum mean squared error.
7 ACKNOWLEDGEMENT
The authors wish to thank Dr. Jacob Benesty for suggesting the extension of APSA to proportionate APSA. The authors would also like to thank Ms. Tiange Shao for her help in the initial stage of the algorithm development.
8 REFERENCES
[1] S. Haykin, Adaptive Filter Theory, 4th ed. Upper Saddle River, New Jersey, 07458.: MPrentice Hall, 2002.
[2] D. L. Duttweiler, “Proportionate normalized least-mean-squares adaptation in echo cancelers,” IEEE Trans. Speech, Audio Processing, vol. 8, no. 5, pp. 508 –518, Sep. 2000.
[3] S. L. Gay, “An efficient, fast converging adaptive filter for network echo cancel-lation,” in Signals, Syst. Comput., 1998. 32th Asilomar Conf., vol. 1, 1-4 1998, pp. 394 –398.
[4] J. Benesty and S. L. Gay, “An improved PNLMS algorithm,” inProc. IEEE Int. Conf. Acoust., Speech, Signal Processing, 2002. (ICASSP ’02), vol. 2, 2002, pp. 1881 –1884.
[5] P. Loganathan, A. Khong, and P. Naylor, “A class of sparseness-controlled algo-rithms for echo cancellation,” IEEE Trans. Audio, Speech, Language Processing, vol. 17, no. 8, pp. 1591 –1601, Nov. 2009.
[6] J. Arenas-Garcia and A. Figueiras-Vidal, “Adaptive combination of proportion-ate filters for sparse echo cancellation,” IEEE Trans. Audio, Speech, Language Processing, vol. 17, no. 6, pp. 1087 –1098, Aug. 2009.
[7] H. Deng and M. Doroslovacki, “Improving convergence of the PNLMS algorithm for sparse impulse response identification,”IEEE Signal Processing Lett., vol. 12, no. 3, pp. 181 – 184, Mar. 2005.
[8] K. Sakhnov, “An improved proportionate affine projection algorithm for network echo cancellation,” in Syst., Signals and Image Processing, 2008. IWSSIP 2008. 15th International Conference, 25-28 2008, pp. 125 –128.
[9] C. Paleologu, S. Ciochina, and J. Benesty, “An efficient proportionate affine pro-jection algorithm for echo cancellation,” IEEE Signal Processing Letters, vol. 17, no. 2, pp. 165 –168, Feb. 2010.
[10] T. Gansler, S. Gay, M. Sondhi, and J. Benesty, “Double-talk robust fast con-verging algorithms for network echo cancellation,” IEEE Trans. Speech, Audio Processing, vol. 8, no. 6, pp. 656 –663, Nov. 2000.
[11] J. Benesty, H. Rey, L. Vega, and S. Tressens, “A nonparametric VSS NLMS algorithm,” IEEE Signal Processing Lett., vol. 13, no. 10, pp. 581 –584, Oct. 2006.