THE RELATIONSHIP BETWEEN TEACHER’S
TECHNOLOGY INTEGRATION ABILITY AND USAGE*
SHIHKUAN HSU National Taiwan University
ABSTRACT
Despite a steady supply of equipment and continuous training, teachers’ use of computers for instruction seems to be limited. Whether the problem is due to teachers’ ability or usage of computers for instruction is not well understood. In order to better understand the role of ability and usage in technology integration, teachers’ proficiency of technology integration was evaluated by separate ability and usage scales. Based on performance indi-cators from the International Society for Technology in Education (ISTE), two scales were developed that measured teachers’ self-perceived ability and their frequency of usage of technology integration. The survey was administered to grade 1-9 teachers in Taiwan (n= 3729). The results showed a positive correlation between teachers’ technology integration ability and usage (Pearsonr= .56). Further examination using Structural Equation Modeling (SEM) confirmed the structure of the scales and revealed a higher correlation between the two scales after adjusting for measurement error.
INTRODUCTION
Teachers’ integration of technology has been investigated for a long time. Research has shown, however, there has not been much progress in teachers’ integration of computers in their lessons over the last 20 years (Culp, Honey, & Mandinach, 2003). The reasons for teachers’ limited use of computers have sparked the interest of many researchers (Baylor & Ritchie, 2002; Levin &
*This project was supported by a grant from the Ministry of Education in Taiwan. 309
Ó2010, Baywood Publishing Co., Inc. doi: 10.2190/EC.43.3.c
Wadmany, 2008). Various measures to evaluate teachers’ level of technology integration have been developed and factors that influence teachers’ technology integration have been scrutinized (Hermans, Tondeur, van Braak, & Valcke, 2008; Mueller, Wood, Willoughby, Ross, & Specht, 2008). A fundamental question seldom asked is this: Is it teachers’ usage or teachers’ ability that we are trying to increase in technology integration?
In order to discuss the issue of teachers’ usage and ability in technology integration, three issues need to be clarified. First, technology integration pro-ficiency is different from computer propro-ficiency, with the former including more complicated aspects such as pedagogical considerations. Second, ability and usage are different entities, although they could be influenced by similar factors such as beliefs and attitudes. Third, teachers who have the ability to integrate technology into teaching may not be able to do so in their classes because of barriers such as the lack of functional equipment, appropriate software, students’ ability, and school curriculum. Due to these three issues, it is necessary to measure teachers’ technology integration ability and usage separately and examine the relationship between these two constructs.
Technology Integration Proficiency is Different from Teachers’ Computer Proficiency
Technology integration is not as well understood as computer usage. Recently, researchers have suggested that using technology for instructional integration requires knowledge and skills which are different from simply using computers (Angeli & Valanides, 2009). Teachers need specific knowledge and skills that utilize technology for education. Integrating technology into teaching means considering the needs of the students, the curriculum, and available technology, as well as the lesson planning and media design issues, and somehow combining them into a practice that will enhance student learning (Hennessy, Ruthven, & Brindley, 2005).
Ability and Usage are Different Entities and Should be Examined Separately
Ability and usage are similar constructs. It was not obvious to the researchers in the early days that it was necessary to separate ability and usage when examining teachers’ proficiency of technology integration. Frequency of usage was often employed as the indicator of teachers’ capability to integrate computers. In a large-scale survey by Becker (1999), teachers’ frequency of computer or Internet use was the key indicator for their measure of technology integration proficiency. Teachers were asked to specify frequency in terms of “do not use,” “occasionally,” “weekly,” and “more often” on technology use items such as using information from Internet in lessons, using electronic mail to communicate with teachers in other schools, and posting information to the Word Wide Web. In another
large-scale study, Moersch (1999) proposed a similar framework for teachers’ level of technology integration based on frequency. In their questionnaire, items measuring frequency of usage such as “I use prepackaged curriculum units” were used to assess teachers’ technology integration proficiency. Both studies used teachers’ frequency of usage as indicators of teachers’ level of proficiency. Many later studies also follow the same tradition (e.g., Hermans et al., 2008; Mueller et al., 2008), measuring teachers’ technology integration proficiency with frequency of usage. With this framework, teachers who are not using technology are usually assumed to lack competency or proficiency. Usage, therefore, has been a proxy for teachers’ ability.
Ability and usage, however, are different entities. Ability refers to how capable or competent a person is when doing something. Ability includes, or is related to, knowledge and skills (Compeau & Higgins, 1995), and is influenced by many factors such as attitudes (Shapka & Ferrari, 2003), beliefs (Yang & Huang, 2008), self-efficacy (Anderson & Maninger, 2007), and morale (Baylor & Ritchie, 2002). Usage, on the other hand, is how much or how often a person is doing something. Usage can also be described as behavior or performance. These two constructs need to be studied separately.
Several studies have attempted to assess teachers’ technology integration and the relationship between ability and usage. For example, Smarkola (2008) examined teachers’ intention to use computers for instruction by using the self-efficacy model developed by Bandura (1977), investigating how perceived ability influences one’s intention of behavior. Using path analysis, Smarkola showed that teachers’ intentions to use computers for instruction can be predicted by belief-based measures pertaining to attitudes (e.g., usefulness and com-patibility), subjective norms (e.g., peer influence and superior’s influence), and perceived behavioral control (e.g., self-efficacy, technology and resource constraints/support). In Smarkola’s study, teachers’ perception of their capability predicts their intention to use computers for instruction.
Barriers that Prevent Teachers from Realizing Their Ability in Technology Integration
Previous studies have come close to suggesting that teachers’ usage or intended usage is associated with their ability or perceived capability of technology inte-gration. Analyses of outcomes of training programs and workshops, however, have encouraged researchers to speculate that the barriers can be divided into ability and usage (Bichelmeyer & Molenda, 2006; Cuban, Kirkpatrick, & Peck, 2001). While it is possible that training programs are not effective, and therefore teachers did not get the necessary competencies to enable them to integrate technology, it is equally possible that teachers obtained the knowledge and skills, but did not want to utilize them in class. In studying inhibitors of teachers’ use of computers, Mumtaz (2000) concluded that out of seven barriers there was
only one related to teachers’ ability; the barrier was the lack of teaching experi-ence with ICT. Most of Mumtaz’s factors were outside of the teacher’s control, which created usage problems. Those barriers included the lack of computer availability, ICT specialist teachers, on-site support, supervision of children when using computers, financial support, and time required to successfully integrate technology into the curriculum. Likewise, Shiue (2007) used path analysis to study factors that influenced teachers’ use of technology among 242 secondary Taiwanese teachers. Shiue found that teachers’ use of technology and their inclination toward its use were largely determined by teacher-technology inter-face factors, which included ease-of-use, computer self-efficacy, and perceived usefulness. The teacher-technology interface, furthermore, was influenced by objective technological environment factors, which included technical support, computer access, and professional development opportunities. Given these results, it seems possible that even after teachers obtained necessary competence in technology integration, they may still not be able or willing to integrate technology in their teaching.
Perceived vs. Actual Ability and Usage
Using teacher-reported data has a potential problem of teachers inaccurately estimating of their own ability and usage. In order to overcome such problems, Bunz, Curry, and Voon (2007) developed a perceived Computer-email-web (CEW) fluency scale for subjects’ perceived CEW fluency, and used the subjects’ score on the applied skills in CEW related tasks as their actual fluency. Their study found a significant correlation between subject’s perceived and actual fluency. In a study by Dunning, Johnson, Ehrlinger, and Kruger (2003), subjects with poor performance tended to over-estimate their expected performance. High performers tended to slightly under-estimate their expected performance. The under-estimates of high performers, however, were still higher than the over-estimates of low performers. It is therefore reasonable to use perceived ability and perceived usage when examining their correlations.
PURPOSE
The purpose of this study is to find the relationship between teachers’ tech-nology integration ability and usage. This study used direct translation of ISTE NETS-T performance standards as teachers’ perceived ability scale. Another scale of teachers’ technology integration developed from the ISTE NETS-T (Hsu, 2010) was used to measure teachers’ perceived usage. A group of teachers in grades 1-9 completed both instruments during one administration of the survey. Confirmatory factor analysis (CFA) of the ability scale was performed to confirm the structure in the scale, and the relationship of both ability and usage scales were examined using correlations and structural equation modeling (SEM).
METHOD
The Ability Scale
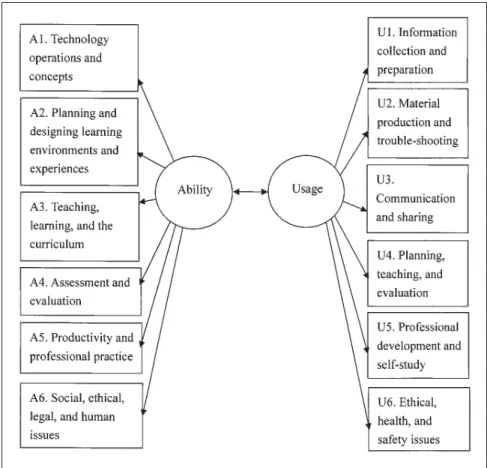
The items in the ability scale were developed by ISTE and translated into Chinese. The items in the National Educational Technology Standards for Teachers (NETS-T) were used as measures of teachers’ proficiency of tech-nology integration.1The six constructs in the ability scale were: (a) technology
operations and concepts; (b) planning and designing learning environments and experiences; (c) teaching, learning, and the curriculum; (d) assessment and evaluation; (e) productivity and professional practice; and (f) social, ethical, legal, and human issues (ISTE, 2000). There were 23 performance indicators in the six areas of NETS-T (see Appendix A for sample items). The 23 per-formance indicators were translated by five English teachers in secondary schools in Taiwan. The translation was evaluated for readability by four secon-dary school teachers in other disciplinary areas. Subjects rated their ability from 1 to 4, corresponding to four competence levels: “no idea at all,” “need a lot of help from others,” “can do it myself most of the time,” and “familiar and proficient.”
The Usage Scale
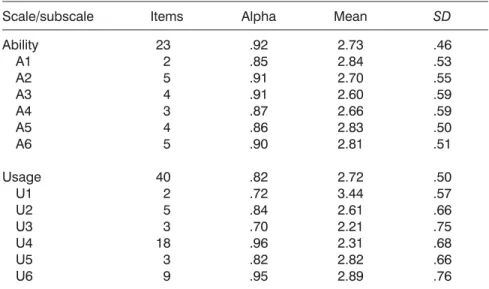
The items in the usage scale were also based on NETS-T standards. The six constructs in the usage scale were: (a) information collection and preparation; (b) material production and trouble-shooting; (c) communication and sharing; (d) planning, teaching and evaluation; (e) professional development and self-study; and (f) ethical, health, and safety issues. There were six constructs and 40 items in the usage scale (see Appendix B for sample items). The details of scale development were reported in Hsu (2010). An expert teacher panel interpreted the NETS-T standards and developed new items based on their teaching experience. Each item may be related to more than one NETS-T indicator, and there is no one-to-one correspondence to NETS-T items. Subjects rated their usage during the last semester from 1 to 4, corresponding to “never use,” “once in a while,” “sometimes,” and “very often.” Table 1 lists the number of items, the internal consistency coefficient (Cronbach’s alpha), sample items, and the means and standard deviations of each subscale in both ability and usage scales.
1This study was conducted at the end of 2006 and the beginning of 2007 before NETS-T
2008 (ISTE, 2008) was released. Both NETS-T 2000 and NETS-T 2008 include similar categories and could function as general guidelines.
Survey Procedure
Grades 1 to 9 teachers from all 23 cities and counties in Taiwan were sampled by using a probability proportional to size (PPS) method. A total of 334 schools were sampled and 15 teachers from each school were asked by the head of academic affairs at their schools to participate in the survey. A total of 4911 teachers were sampled and 3729 (76%) valid surveys were returned. Eighty-four percent of the returned questionnaires were submitted online and 16% were returned by postal mail. The sample was representative of the population based on several measures such as gender and district economic development (Hsu, Kuan, & Yang, 2008).
Data Analysis
Four steps were taken to confirm the ability and usage scales and the relation-ship between them. First, CFA was performed for the ability scale to confirm the structure of the NETS-T performance standards. Second, the correlations between the ability and usage subscales were calculated to examine the similarity between the structures for ability scale and usage scale. Third, the scatter plot of the mean scores from both scales was produced, and the correlation of average scores of both scales was analyzed to explore the relationship between them. Fourth, a SEM
Table 1. Mean andSDfor Ability and Usage Subscale
Scale/subscale Items Alpha Mean SD
Ability A1 A2 A3 A4 A5 A6 Usage U1 U2 U3 U4 U5 U6 23 2 5 4 3 4 5 40 2 5 3 18 3 9 .92 .85 .91 .91 .87 .86 .90 .82 .72 .84 .70 .96 .82 .95 2.73 2.84 2.70 2.60 2.66 2.83 2.81 2.72 3.44 2.61 2.21 2.31 2.82 2.89 .46 .53 .55 .59 .59 .50 .51 .50 .57 .66 .75 .68 .66 .76 Note:n= 3759. Alpha = Cronbach’s alpha. Information of the usage scale is also reported in Hsu (2010).
model of both scales was constructed and the correlation between the two scales without measurement error was further examined (see Figure 1).
RESULTS CFA of Ability Scale
Confirmatory analysis was used to build the ability model based on the NETS-T indicators. Six factors were tested for the ability model. The number of items and subscales was the same as the number of items and subscales in the NETS-T performance indicators. The results showed a large Chi-square, but the goodness of fit indicators showed that the model is acceptable (Chi-square = 600.05, df= 216,p-value < .001, RMSEA = .02, NFI = 1.00, NNFI = 1.00, CFI = 1.00). The large Chi-square could have been influenced by a large sample size. An
RMSEA that is smaller than 0.05 is considered a good fit, and so does a NNFI or CFI that is close or equal to 1. Therefore, the model was accepted.
Correlation between Ability and Usage Subscales
The results of the correlations between the ability and usage subscales found that those two scales were quite different in terms of their structure (see Table 2). Although both scales were based on NETS-T performance indicators, and both of them had six subscales, they were actually two different scales. The six subscales in ability scale did not correspond to the six subscales in the usage scale. Although the last two subscales in both ability and usage scale were similar in terms of their meanings, there were only moderate correlations between those subscales, with Pearson correlation coefficientr(A5B5) = .46 andr(A6B6) = .43. Some subscales had very low correlations (e.g., r(A1B3) = .20). The second usage subscale “material production and trouble-shooting,” however, seemed to have higher correlations with all six ability subscales (r= .41 to .52). It was con-cluded that the ability and the usage scales did not measure the same factors.
Correlation between Total Average Scores for Ability and Usage
The correlation between the overall ability and usage scores was calculated to find the relationship between teachers’ ability and usage of technology inte-gration. The mean scores for both ability (mean = 2.73, SD = .46) and usage (mean = 2.72,SD= .50) were obtained by averaging all the items in the scales, and then the correlation between the mean scores for ability and usage was calculated. The results showed that there was a positive correlation between teachers’ ability and behavior, with a Pearson correlation r of .56 (p < .001).
Table 2. Correlations between Ability and Usage Subscales Usage scale U1 U2 U3 U4 U5 U6 Ability s cale A1 A2 A3 A4 A5 A6 0.28 0.26 0.22 0.23 0.33 0.25 0.43 0.52 0.51 0.46 0.46 0.41 0.20 0.22 0.26 0.24 0.24 0.24 0.32 0.41 0.45 0.42 0.35 0.38 0.38 0.41 0.40 0.39 0.46 0.40 0.27 0.32 0.35 0.34 0.32 0.43
Figure 2 shows the scatter plot of the participants’ mean scores for ability and usage. Visual inspection of the plot in Figure 2 shows definite groups of low ability and high ability teachers, though naturally most teachers were in the middle of the range. Although variables with nonlinear relationships could still produce a positive correlation coefficient, the scatter plot suggested that there is a linear relationship between ability and usage (Anscombe, 1973).
SEM Analysis of a Causal Relationship
A SEM model was developed that hypothesized a mutual correlation relation-ship between teachers’ ability and behavior in technology integration. The SEM of ability and usage showed an acceptable fit (Chi-square = 13305.15,df= 1163, p< .001, NNFI = .97, NFI = .97, CFI = .97, RMSEA = .053) (see Figure 3). This result confirmed the SEM model that ability and usage correlated with each other. In addition, the SEM model, which removed the measurement error, demonstrated a higher correlation between teachers’ ability and teachers’ usage in technology integration (r= .66).
Figure 2. Scatter plot of teachers’ ability and usage in technology integration.
DISCUSSION
This large scale survey of 3729 Taiwanese teachers addresses the relationship between teachers’ ability and usage in technology integration. Two scales were created using the ISTE NETS-T 2000 performance indicators, and models of the relationship were tested. This study verifies the structure of the ability scale, which contains the same six subscales and 23 performance items as in the NETS-T 2000 model. The usage scale was based on the NETS-T model, but it underwent some changes when being translated and interpreted for usage (Hsu, 2010). With these changes, the correlations of the subscales showed that the ability and usage scales were sufficiently different. Two major findings are discussed.
Positive Correlation between Ability and Usage of Technology Integration
The study shows that there is a moderate positive correlation (r= .56) between ability and usage. This Pearson correlation indicates a medium-size correlation between the ability and usage, but other correlations besides a linear relation-ship could still be possible among the variables (Anscombe, 1973). The linear
Figure 3. Standardized estimates of the structural model of ability and usage.
relationship between ability and usage is further confirmed by the inspection of the scatter plot of the two variables (see Figure 2). The results suggest that teachers with high ability in technology integration generally have higher usage of technology integration in the classroom.
While many researchers have studied psychological factors for possible barriers to technology integration, it may be worthwhile to ask a basic question: Have those teachers gained the ability to implement technology integrated lessons? This study found that those teachers who had higher ability do integrate tech-nology more often, and therefore have higher frequency of usage. Unlike Shiue (2007), this study suggests that ability, not self-efficacy or perceived usefulness, determines the amount of use, at least for teachers in Taiwan.
The findings in this study should be comforting for researchers who have utilized usage, not ability, to indicate teachers’ proficiency in technology inte-gration (e.g., Becker, 1999; Cuban, Kirkpatrick, & Peck, 2001; Moersch, 1999). At the time, it may have been used without the consideration of the differences between ability and usage. The finding that ability correlates positively with usage supports those studies in their hidden assumption that teachers who use more are generally better at integrating technology into classroom.
SEM Analysis of Ability and Usage Relationship
There are many potential relationships between teachers’ ability and usage in technology integration. The Pearson correlation of the mean scores of both ability and usage scales show that there is a positive correlation between the two variables. In the SEM model, furthermore, the covariance between ability and usage is equal to the correlation between the two variables (r= .66). This correlation coefficient is higher than the one in the Pearson correlation calculation (r= .56) because the SEM controls for measurement errors that are often included by Pearson correlations (Seber & Lee, 2003). Thus, the correlation between ability and usage is even greater than the Pearson correlation coefficient suggests, after the measurement errors are removed.
One question that may be asked is: Can causal relationships such as ability predicting usage, or usage predicting ability, be assumed? In this study, it is assumed that there is a correlation between these two scales. Statistically, the predictor and independent variable in an SEM model can be placed pointing in either way, and the covariance value would be the same. In other words, teacher’s ability could be assumed to predict usage, or the other way around. To answer the question about the other direction of the causation, another set of assumptions should be made. These assumptions are probably best addressed by longitudinal studies that look at the impact of increased usage on teachers’ ability in technology integration. Further analysis of the causal relationship is needed in order to understand more precise relationships between teacher’s ability and usage in technology integration.
Limitations of the Study
Teacher’s proficiency as measured in the current study does not dif-ferentiate teachers’ and students’ use of technology. In other words, this study does not discriminate between increasing use of technology for instructional preparation from student use of ICT during learning activities. The latter concept, regarding how teachers are actually helping students learn with technology, is the goal of many researchers and educators. A finer differen-tiation between the two concepts, teachers’ use and students’ use of technology, is an important step in fine tuning the search of understanding teacher’s tech-nology integration.
CONCLUSION
The results of this study present a positive correlation between teacher’s ability and usage in technology integration, and suggest that well-trained teachers successfully integrate technology. Using the NETS-T performance indicators for teachers’ technology integration, this study found that teachers who regard themselves as having high ability in technology integration generally do more technology integration than those who report they have lower skill levels. This study surveyed over 3000 teachers and demonstrated that this positive correlation exists for many different grade level and subject area teachers in Taiwan.
One implication from the results of this study is that the quality of training programs matters. Past studies have suggested that training programs help teachers improve, albeit slowly (Bichelmeyer & Molenda, 2006). Teachers do not immediately become technologically savvy, but they can make progress. There is a reason why the importance of professional training has been empha-sized as one of the most important factors that improves teachers’ computer integration (Culp et al., 2003), despite numerous failures. Technology integration is more than just using computers. Teachers need to understand how to use technology properly in their disciplinary content areas. National and international standards, such as NETS-T, seem to be valid and can be used as a guideline for professional development. Future training workshops and programs should be aligned to those standards. When teachers have better understanding and thus higher competence of integrating technology into teaching, their chance of having higher integration will be within reach.
APPENDIX A Constructs and Selected Items in the Ability Scale Subscale Description Sample item A1 A2 A3 A4 A5 A6 Technology operations and concepts Planning and designing learning environments and experiences Teaching, learning, and the curriculum Assessment and evaluation Productivity and professional practice Social, ethical, legal, and human issues Demonstrate introductory knowledge, skills, and understanding of concepts related to technology. Identify and locate technology resources and evaluate them for accuracy and suitability. Facilitate technology-enhanced experiences that address content standards and student technology standards. Apply multiple methods of evaluation to determine students ’ appropriate use of technology resources for learning, communication, and productivity. Continually evaluated and reflected on professional practice to make informed decisions regarding the use of technology in support of student learning. Apply technology resources to enable and empower learners with diverse backgrounds, characteristics, and abilities. Note : For a complete list of items, please see ISTE (2000).
APPENDIX B Constructs and Selected Items in the Usage Scale Subscale Description Sample item U1 U2 U3 U4 U5 U6 Information collection and preparation Material production and trouble-shooting Communication and sharing Planning, teaching, and evaluation Professional development and self-study Ethical, health, and safety issues Used the Internet or other information technology to search for information to provide supplementary course material for students Used the computer to record, edit sound or music in my course material Used e-mail or MSN to communicate with students Tried new strategies to increase student ’s level of concentration during ICT-integration classes Attended conferences or read journals to learn about ICT integration methods Helped students evaluate the authenticity, relatedness, properness, and justness when students referred or quoted information from the Internet Note : For a complete list of items, please see Hsu (2010).
ACKNOWLEDGMENTS
The author wishes to thank all the school administrators and teachers who participated in this project.
REFERENCES
Anderson, S. E., & Maninger, R. M. (2007). Preservice teacher’s abilities, beliefs, and intentions regarding technology integration. Journal of Educational Computing Research, 37(2), 151-172.
Angeli, C., & Valanides, N. (2009). Epistemological and methodological issues for the conceptualization, development, and assessment of ICT–TPCK: Advances in technological pedagogical content knowledge (TPCK), Computers & Education, 52(1), 154-168.
Anscombe, F. J. (1973). Graphs in statistical analysis. American Statistician, 27, 17-21.
Bandura, A. (1977). Self-efficacy: Toward a unifying theory of behavioral change. Psychological Review, 84, 191-215.
Baylor, A. L., & Ritchie, D. (2002). What factors facilitate teacher skill, teacher morale, and perceived student learning in technology-using classroom?Computers & Educa-tion, 39(4), 395-414.
Becker, H. J. (1999). Internet use by teachers: Conditions of professional use and teacher-directed student use—Teaching, learning, and computing: 1998 national survey Report #1. Retrieved September 9, 2010, from http://sandbox.ea.ecu.edu.au/ staffuse/cnewhous/resources/Becker%20Report.pdf
Bichelmeyer, B., & Molenda, M. (2006). Issues and trends in instructional technology: Gradual growth atop tectonic shifts. In M. Orey, V. J. McClendon, & R. M. Branch (Eds.),Educational media and technology yearbook, 31(pp. 3-32). Westport, CT: Libraries Unlimited.
Bunz, U., Curry, C., & Voon, W. (2007). Perceived versus actual computer-email-web fluency.Computers in Human Behavior, 23, 2321-2344.
Compeau, D. R., & Higgins, C. A. (1995). Computer self-efficacy: Development of a measure and initial test.MIS Quarterly, 19(2), 189-211.
Cuban, L., Kirkpatrick, H., & Peck, C. (2001). High access and low use of technologies in high school classrooms: Explaining an apparent paradox.American Educational Research Journal, 38, 813-834.
Culp, K. M., Honey, M., & Mandinach, E. (2003). A retrospective on twenty years of education technology policy. Office of Educational Technology. Retrieved September 9, 2010, from http://www.ed.gov/rschstat/eval/tech/20years.pdf
Dunning, D., Johnson, K., Ehrlinger, J., & Kruger, J. (2003). Why people fail to recog-nize their own incompetence. Current Directions in Psychological Science, 12(3), 83-87.
Hennessy, S., Ruthven, K., & Brindley, S. (2005). Teacher perspectives on integrating ICT into subject teaching: Commitment, constraints, caution, and change.Journal of Curriculum Studies, 37(2), 155-192.
Hermans, R., Tondeur, J., van Braak, J., & Valcke, M. (2008). The impact of primary school teachers’ educational beliefs on the classroom use of computers.Computers & Education, 51, 1499-1509.
Hsu, S., Kuan, P. Y., & Yang, C. H. (2008). Teachers’ perspectives on technology richness—Digital divides in county and different economic development areas. In H. M. Yuan, Y. H. Liao, H. Y. Huang, T. M. Chung, & S. L. Chen (Eds.),Proceeding of National Computer Symposium (NCS 2007) (pp. 656-663). Taichung, Taiwan: Asia University.
Hsu, S. (2010). Developing a scale for teacher integration of information and communi-cation technology in Grades 1-9. Journal of Computer Assisted Learning, 26(3), 175-189.
ISTE. (2000). NETS-T performance indicators. Retrieved September 9, 2010, from http://www.iste.org/Content/NavigationMenu/NETS/ForTeachers/2000Standards/ NETS_for_ Teachers_2000.htm
ISTE. (2008).The ISTE National Educational Technology Standards (NETS·T) and per-formance indicators for teachers. Retrieved September 9, 2010, from http://www. iste.org/Content/NavigationMenu/NETS/ForTeachers/2008Standards/NETS_T_ Standards_ Final.pdf
Levin, T., & Wadmany, R. (2008). Teachers’ views on factors affecting effective inte-gration of information technology in the classroom: Developmental scenery.Journal of Technology and Teacher Education, 16(2), 233-263.
Moersch, C. (1999). Assessing current technology use in the classroom: A key to efficient staff development and technology planning.Learning and Leading with Technology, 26(8), 40-49.
Mueller, J., Wood, E., Willoughby, T., Ross, C., & Specht, J. (2008). Identi-fying discriminating variables between teachers who fully integrate computers and teachers with limited integration. Computers & Education, 51, 1523-1537.
Mumtaz, S. (2000). Factors affecting teachers’ use of information and communications technology: A review of the literature.Journal of Information Technology for Teacher Education, 9(3), 319-341.
Seber, G. A. F., & Lee, A. J. (2003).Linear regression analysis. Hoboken, NJ: Wiley-Interscience.
Shapka, J. D., & Ferrari, M. (2003). Computer-related attitudes and actions of teacher candidates.Computer in Human Behavior, 19, 319-334.
Shiue, Y. M. (2007). Investigating the sources of teachers’ instructional technology use through the decomposed theory of planned behavior. Journal of Educational Computing Research, 36(4), 425-453.
Smarkola, C. (2008). Efficacy of a planned behavior model: Beliefs that contribute to computer usage intentions of student teachers and experienced teachers.Computers in Human Behavior, 24, 1196-1215.
Yang, S. C., & Huang, Y. F. (2008). A study of high school English teachers’ behavior, concerns and beliefs in integrating information technology into English instruction. Computers in Human Behavior, 24, 1085-1103.
Direct reprint requests to: Dr. Shihkuan Hsu
Center for Teacher Education National Taiwan University No. 1, Sec. 4, Roosevelt Road Roosevelt Road
Taipei, Taiwan 10617, R.O.C. e-mail: [email protected]