Price Distortions in the Commodity Futures Markets
by
CHN
Devin B. Helfrich
B.A. Geology
University of St. Thomas, 2001
SUBMITTED TO THE ENGINEERING SYSTEMS DIVISION
IN PARTIAL FULFILLMENT OF THE REQUIREMENTS FOR THE DEGREE OF
MASTER OF SCIENCE IN TECHNOLOGY AND POLICY
AT THE
MASSACHUSETTS INSTITUTE OF TECHNOLOGY
SEPTEMBER 2012
@
2012 Massachusetts Institute of Technology. All rights reserved.
Signature of A uthor
...
...
Engineering
Systems
Division
July 27, 2012
Certified by ...
.
Dr...
John . Parso
..
Senior Lecturer, Sloan School of Management
Thesis Supervisor
Accepted by ...
Joel P. Clark
Pr fessor of Materials Systems and Engineering Systems
Acting Director, Technology & Policy Program
Price Distortions in the Commodity Futures Markets
by
Devin B. Helfrich
Submitted to the Engineering Systems Division
on July 27, 2012 in Partial Fulfillment of the
Requirements for the Degree of Master of Science in
Technology and Policy
ABSTRACT
Speculation is not monolithic; it comes in many forms. A certain level of speculation is required for commodity futures markets to function. On the other hand, certain types of trading activities by speculators may damage a market's price discovery function and in turn its hedging function. However, there is great disagreement as to which types of speculation can distort commodity futures prices and the mechanisms for how a price distortion may occur.
This thesis advances three distinct categories of speculative activities alleged to distort commodity prices and reviews evidence for each. Those three categories are: corner and squeeze manipulations, nonfundamental futures demand, and large speculative demand. Case studies are presented for each of the three categories. In addition, the effectiveness of speculative position limits in decreasing the occurrence of each category is analyzed.
A question that arises, but is left unanswered, is whether the marginal benefits outweigh the possible costs of speculation once speculation rises above certain levels required for price discovery and hedging.
Thesis Supervisor: John E. Parsons
Acknowledgments
I am deeply grateful for the love and support from my family, without whom I would not have made it to this point. I want to thank Laura Chirot who has been with me every step of the way. And finally, I have gained an immense amount from working with my advisor, John Parsons, who has been a patient and practical mentor.
Table of Contents
Chapter 1: Introduction...6
Chapter 2: Corner and Squeeze M anipulations... 8
2.1 Corner and Squeeze...9
2.1.1 Definition O ne...10
2.1.2 Definition Tw o...10
2.1.3 Final Detail: Corner and Squeeze... 11
2.2 Case Studies...12
2.2.1 Case Study: Ferruzzi Soybean M anipulation of 1989... 13
2.2.2 Case Study: Arcadia O il M anipulation of 2008... 26
2.3 Appendix: Tables 5 thru 9...36
Chapter 3: Nonfundam ental Futures Dem and... 41
3.1 Fundam ental versus Nonfundam ental Futures Dem and ... 42
3.1.1 Fundam ental Dem and...43
3.1.2 Nonfundam ental Dem and...43
3.2 Econom ic Theory...45
3.3. Empirical Evidence of Price Distortions from Nonfundamental Futures Demand... 47
3.3.1 Front Running...48
3.3.2 Front Running the Goldm an Roll... 48
3.4 Conclusion...52
Chapter 4: Large Speculative Dem and: Com m odity Indexes... 53
4.1 W hat are Com m odity Indexes? ... 54
4.2 Index Investm ent Vehicle Exam ple: iShares ETF by BlackRock... 57
4.3 Com m odity Index Descriptive Statistics... 58
4.4 Conflicting Em pirical Evidence...65
4.4.1 Singleton (2011) ... 65
4.4.2 Irw in and Sanders (2010) ... 67
4.5 Conclusion...71
Chapter 5: Regulation and Speculative Position Lim its... 72
5.1 History of Position Lim its...73
5.2 The Dodd-Frank Wall Street Reform and Consumer Protection Act of 2010... 75
5.3 The Purpose of Position Lim its ... 78
5.4 Position Lim its Applied to the Cases in this Thesis... 80
5.5 Conclusion...83
Chapter 6: Conclusion...84
Chapter 1
Introduction
"Speculation" has been blamed by many parties for causing price distortions in the futures markets. The recent volatility in commodity prices has returned that debate to the forefront of political conversation. In a research report, Goldman Sachs (2011, p.1) estimates that "each million barrels of net speculative length tends to add 8-10 cents to the price of a barrel of oil." Two economists at the Federal Reserve Bank of St. Louis (2012, p.1) recently concluded "While global demand shocks account for the largest share of oil price fluctuations, speculative shocks are the second most important driver." And U.S. Senator Carl Levin (2012) spoke from the Senate floor claiming, "...excessive speculation in the futures and swaps markets has distorted prices, overwhelmed normal supply and demand factors, and pushed up prices at the expense of consumers and American business."
Conversely, there are also many others who believe speculation has little or no effect on futures prices. In a paper presented by two agricultural economists (Irwin, et al., 2009, p.17), the authors conclude "There is little evidence that the recent boom and bust in commodity prices was driven by a speculative bubble." The Chicago Mercantile Exchange Group (CME, 2009, p.5) asserts that "Most every competent economist who has looked at real data, rather than anecdotes, and who has applied legitimate
economic analysis concludes that neither speculators, swap dealers, nor index funds are distorting commodity prices." And the investment bank BlackRock (2011, p.4) claims that "Rather than link commodity price movements to speculation, reputable studies have uniformly found that fundamental market conditions are the driving force behind such price fluctuations."
To make matters more confounding, not only is there disagreement about whether speculation distorts prices, there is also vast disagreement on what exactly "speculation" is. This thesis begins to answer those questions by putting speculation into a coherent framework and reviewing current evidence.
Some speculation - in the broadest sense of encompassing all those market participants who are not hedging risk - is required for futures markets to function. At a minimum, those wishing to hedge
commercial risk need some speculators to accept that risk by taking opposite futures positions, since the hedgers using the market do not have perfectly balanced long and short position demands.
To that end, this thesis divides speculation into three categories that are alleged to distort prices: corner and squeeze manipulations, nonfundamental futures demand, and large speculative demand (with a focus on indexes). These three categories do not exhaust the forms of speculation that are alleged to distort prices. For example, asset bubbles may be described as a consequence of another particular type of speculative activity that is driven by widely-held irrational beliefs.
In the next three chapters, this thesis reviews the evidence for, and magnitude of, price distortions resulting from the three categories of speculation. Chapter 5 asks how effective a particular regulatory tool - speculative position limits - could be at preventing price distortions. Each of these chapters is written to stand alone as a separate discussion of each topic. The final chapter concludes.
Chapter 2
Corner and Squeeze Manipulations
The first category of speculation alleged to distort prices in the commodity futures markets is the corner and squeeze manipulation. A corner and squeeze manipulation is relatively less controversial and easier to detect than the categories of speculation addressed in chapters three and four, nonfundamental demand and large speculative demand respectively.' Corner and squeeze manipulations - obtaining a dominant position in the physical product and/or futures contracts of a commodity and then using that market power to force prices to supercompetitive levels around contract expiration - were ubiquitous events in the grain markets of the early 2 0th century. Indeed, 121 corner and squeeze manipulations in grains and meats are documented between 1868 and 1921 (Pirrong, 1995). In addition, the futures contracts of Gold, Silver, Copper, Cotton, Potatoes, and Onions -just to name a few - have all been subject to corner and squeeze manipulations. More recently, the dramatic Hunt Brothers' silver
manipulations of 1979 and 1980 contributed to a swing in the price of silver from $9 to $50 per ounce in
5 months, and a reported $1 billion plus in losses for the Hunts. Corner and squeeze manipulations make
and break fortunes and can occur in any commodity futures contract that is linked to physical delivery. Some of the largest corner and squeeze manipulations have forced massive flows of a commodity from across the country or world to a single market location only to be redistributed after the squeezed futures contract expires.
A corner and squeeze manipulation occurs when a manipulator (the entity executing the corner and
squeeze manipulation) exercises her market power at the expiration date of a futures contract. This is when the physical commodity must be delivered by those who still hold futures contracts to sell (short positions) to the players who still hold contracts to buy (long positions). Two distinguishing features of a corner and squeeze manipulation are the manipulator's requirement of a relatively large futures and/or physical position that is used to drive up the futures price and realize a supercompetitive futures profit,2
and secondly, a relative depression of prices after the contract expires and the manipulator
The corner and squeeze manipulation is addressed as a distinct category of speculative price distortion outside of the nonfundamental demand category in chapter two due to its historical and economic importance and its highly
unique features. Otherwise, a corner and squeeze manipulation would be a type of nonfundamental futures demand.
2 For example, the Hunt Brothers and Conti Group together owned more than 50 percent of the silver deliverable
against the COMEX futures contract; the total reported silver owned by the Hunts was 90.3 million ounces on
subsequently sells off her position. The manipulator may use the futures market only, or both the physical and the futures markets in order to execute the corner and the squeeze. In either case, the intent of the manipulator is to profit from noncompetitive futures prices.
In a typical corner and squeeze manipulation, the manipulator uses her dominant long futures position to force other trapped short speculators and hedgers to deliver on the futures contracts they hold. Most
of these market players took futures positions with the intent of squaring-out (or exiting the market by buying a position that offsets their current position) before contract expiration and were not planning to make physical delivery of the commodity. Unfortunately for them, the manipulator's squeeze requires excessive levels of delivery. To meet the demand of the manipulator, speculators are forced to acquire large quantities of the physical commodity at increasing marginal costs, which drives up the futures price. For the corner and squeeze manipulation to be profitable, the manipulator must cash out a portion of her futures position at the inflated prices, and ensure that those futures payouts that are greater than any losses on the large physical commodity stocks that the manipulator now owns. Because the manipulators' profits come directly from the pockets of speculators and hedgers who voluntarily sell futures to the manipulator, it has been aptly said that, "The victims of market power in a commodity futures market sell the executioner the rope by which they are hung" (Pirrong, 1996, p.11).
The remainder of this chapter is organized into three sections. Section I further defines corner and squeeze manipulations. Section 11 analyzes two relatively recent corner and squeeze manipulation events: the Ferruzzi soybean manipulation of 1989 and the alleged Arcadia et al. crude oil manipulation of 2008. These two corner and squeeze manipulation case studies will help us to understand the basic mechanics, results, and implications of a commodity futures corner and squeeze manipulation. Section 11
also reviews the efficacy of speculative position limits in the context of both case studies. Section III contains an appendix with tables that further describe the two case studies.
2.1 Corner and Squeeze
To continue our analysis of corner and squeeze manipulations we must first further define a corner and squeeze. In the literature and media there is much variation in the usage of the two terms. Below I have
synthesized multiple sources, but hew closest to the Chicago Board of Trade's explanation (CBOT, 1990), and Craig Pirrong's definition of what he calls "market power manipulation" (Pirrong, 1996).
2.1.1 Definition One
A most brief and inevitably incomplete explanation is as follows: a corner is controlling enough of a commodity to exert market power, and a squeeze is when a cornerer exercises her market power to force the price of futures beyond the competitive equilibrium.4
2.1.2 Definition Two
A more thorough definition is as follows: a corner is acquiring and controlling a sufficient quantity of physical and/or long futures positions so as to be able to unilaterally increase futures prices. The "sufficient quantity" means a combined physical and futures position that is greater than the number of futures contracts that would be taken to delivery in market equilibrium.' Theoretically, the "market equilibrium deliveries" represents the number of futures contracts which would have been delivered by those shorts who face lower costs of delivery than the cost of squaring-out with the exchange at the equilibrium futures price. In other words, the cornerer has to have a larger combined long physical and futures position than the quantity of commodity that would be efficiently supplied (delivered) against futures contracts in competitive market conditions. This "sufficient quantity" condition must be true at the time of futures contract expiry.
3 Also see CFTC's basic definitions: Corner: (1) Securing such relative control of a commodity that its price can be
manipulated, that is, can be controlled by the creator of the corner; or (2) in the extreme situation, obtaining contracts requiring the delivery of more commodities than are available for delivery. Squeeze: A market situation in which the lack of supplies tends to force shorts to cover their positions by offset at higher prices (CFTC online
glossary: http://www.cftc.gov/consumerProtection/EducationCenter/cFTCGiossary/index.htm).
4 One significant divergence between this thesis' definitions and those of the majority of the existing literature is in explicitly separating the term "corner" from the term "squeeze." The terms corner and squeeze have usually been used interchangeably, and a corner and squeeze have both referred to the entire corner and squeeze manipulation (e.g. see Pirrong, Squeeze Play, 2008). Instead, we will limit corner to mean possessing a market power position, but not necessarily exercising it. This distinction has advantages and disadvantages: giving "corner" this definition separates it from the definition of squeeze and helps to unpack a corner and squeeze manipulation. However, the confusing but interchangeable usage is more common and the Commodity Exchange Act of 1936 explicitly proscribes a "corner," but does not mention the term "squeeze." For these practical reasons, it is helpful to note that the common usage of the terms "corner" or "squeeze" is equivalent to the combination of a corner and squeeze as used in this thesis.
s The "sufficient quantity" for a corner can also be covered by the combined position of the manipulator and other long traders who, for whatever reason, will also not liquidate and hold their positions until expiry.
A squeeze subsequently occurs if the cornerer then exercises her market power inherent in a corner. At this point the activity becomes a true corner and squeeze manipulation. During the squeeze, the manipulator (the entity executing the corner and squeeze) demands physical delivery on more futures contracts than the counterfactual competitive market would have supplied (i.e. the "market equilibrium deliveries"), driving prices above market equilibrium. The futures price rises since the marginal cost of supplying the commodity to market increases as the commodity is acquired from more distant locations and from higher value uses. In other words, the manipulator is pushing the shorts up the upward-sloping marginal cost of delivery curve, since the shorts are contractually required to fulfill the manipulator's artificial long futures demand.
Taking delivery of large amounts of the physical commodity is not the (potentially) profitable part of the corner and squeeze manipulation. Indeed, after futures contract expires, the manipulator usually takes a loss on the physical commodity deliveries, since she has demanded more than she can use, and there is now a glut of the physical commodity at the delivery location, and prices will drop if she sells promptly (the socalled "burying the corpse" effect). Instead, the reason for taking the unprofitable deliveries -and the key to the squeeze -and indeed the entire corner -and squeeze manipulation - is for the manipulator to also liquidate a large portion of her remaining futures position at the inflated futures prices she has created. The futures price increases as the squeezed shorts are willing to pay prices to the manipulator, equal to the increasing marginal cost of delivery, in order to get out of their futures contracts. Finally, for the corner and squeeze manipulation to be profitable, the manipulator's revenue from liquidating futures contracts (or otherwise financially settling with shorts) must exceed the losses incurred from later selling off the excessive physical commodity stocks that the manipulator has accumulated.
2.1.3 Final detail: Corner and Squeeze
A final explanation consisting of 15 key characteristics of a corner and squeeze is as follows:
1) A corner and a squeeze are different6 and together they form a corner and squeeze manipulation 2) A corner may or may not lead to a squeeze, but a corner is a prerequisite for a squeeze
3) A corner is a long supply position large enough to exercise market power
4) A corner can be acquired in the physical, futures, or combined physical and futures markets 5) A corner can be built up (ideally secretively) over time
6) A squeeze is the use of a corner to push futures to supercompetitive prices 7) A squeeze occurs near the expiration of a futures contract
8) There must be an increasing marginal cost of supplying the commodity to market to enable a corner and squeeze manipulation
9) The profit making tool of the squeeze is not limited to futures contracts; a squeeze can use any financial derivative linked to the futures settlement price
10) A typical squeeze requires the manipulator to demand delivery on many, but not all of her futures positions in order to drive up futures contracts to supercompetitive prices
11) A manipulator tries to maximize the revenue from:
a) Selling a portion of her futures contracts at supercompetitive prices, and
b) Selling the excess physical delivery she has received from the corner and squeeze
12) The manipulator usually acquires more physical commodity than she can commercially use in the short term. Her physical stockpile accrues from taking excessive delivery on her futures contracts plus any original physical supply that supported the corner
13) A corner and squeeze manipulation can be a "long manipulation" or a "short manipulation"7
a) A "long manipulation" is much more common, and occurs when the manipulator is long and the shorts are forced to deliver excessive amounts of a commodity ("short squeeze")
b) A "short manipulation" is less common, and occurs when the manipulator is short and the longs are forced to receive excessive amounts of a commodity ("long squeeze")
14) A corner and squeeze produce geographic and temporal price distortions a) Before the squeezed futures contract expires:
i) Higher prices in the squeezed, near-month futures contract, relative to the counterfactual ii) Higher prices in the local spot market, relative to the counterfactual
b) After the squeezed futures contract expires:
i) Lower prices in the new near-month futures contract (relative to the counterfactual) ii) Lower prices in the local spot market (relative to the counterfactual)
iii) These effects are called "burying the corpse"
15) In certain corner and squeeze manipulations, a corner can continue for longer than the expiration of a particular squeezed futures contract, i.e. multiple futures contracts can be squeezed from the same corner
2.2 Case Studies
This section will dissect two alleged corner and squeeze manipulations: the Ferruzzi soybean
manipulation of 1989 and the Arcadia et al. oil manipulation of 2008. Both cases represent a form of corner and a squeeze as defined above.
2.2.1 Case Study: Ferruzzi Soybean Manipulation of 1989
In the summer of 1989, a large Italian multinational firm attempted to manipulate the price of soybeans on the Chicago Board of Trade (CBOT). The Milan-based Ferruzzi Finanziaria sent soybean prices on fear-of-squeeze induced leaps and threatened CBOT soybean delivery defaults, provoking the Commodity Futures Trading Commission (CFTC) and the CBOT to intervene and force Ferruzzi out of the futures market. Ferruzzi's actions closely followed this thesis' definition of a typical corner with intent to squeeze. Ferruzzi cornered the market through acquisition of over 80 percent of the supply of
deliverable soybeans and over 50 percent of the long open interest in the futures market. As a result of Ferruzzi's attempted squeeze, the conglomerate's futures position gained more than $10 million, but then lost $15 million when the squeeze was thwarted through a forced liquidation of positions and prices dropped. This case study will first describe the Ferruzzi corner and squeeze manipulation and align it with our generic definition of a corner and squeeze; second, present a detailed recreation of Ferruzzi's soybean positions, profits, and the futures price over time; and finally draw conclusions.
Ferruzzi Finanziaria was a large Italian Conglomerate that was a major player in soybeans trading, buying, processing, and exporting in the United States. Ferruzzi had been granted repeated hedging exemptions from speculative position limits by the CFTC to protect its commercial needs against adverse soybean price movements, including for the two soybean futures contracts of interest - May and July of 1989. A hedge exemption allowed the recipient to take futures positions larger than the 3 million bushel speculative position limit.8 Ferruzzi claimed the need for an "anticipatory hedge" for its anticipated future purchases of soybeans for domestic processing and foreign export. This type of hedge functions like so: future upward soybean price movement would mean that Ferruzzi would have to pay more in the future to buy its bean requirements than today's price. To hedge this buying price risk, Ferruzzi went long soybeans futures so that any upward soybean price move would also mean an increasing futures payout that would offset its increased spot soybean purchase costs. In this way, the soybeans price that
Ferruzzi would have to pay in the future spot market was locked in once it put on its long futures position. The understanding between the CFTC and entities with anticipatory hedge exemptions was that when the soybeans were purchased in the cash market, and the hedge was no longer needed, the futures position would be lifted (Senate Ag, 1989, p.56).
8 Spot month soybean speculative position limits remain 3 million bushels in 2012 (CBOT rulebook:
The hedge exemption that CFTC granted Ferruzzi allowed the firm to acquire long soybeans futures
positions that were much larger than the available supply of soybeans deliverable against the CBOT May
and July futures contracts. As the contract expiration date grew close, Ferruzzi was not substantially lifting its hedge. In addition, Ferruzzi owned the majority of the bushels of soybeans available for delivery against the CBOT soybeans contract in the summer of 1989. These factors eventually led the
CFTC and the CBOT to twice force the liquidation of the vast majority of Ferruzzi's long futures positions
because, as CFTC's Director of Market Surveillance testified before Congress, "there was a threat of a default, a squeeze, manipulation, price distortion [in the July futures contract] (Senate Ag, p.57)." A timeline of events during the summer of 1989 follows.
July
1989 Soybean Futures ContractEarly June Ferruzzi futures position: 32 million bushels long
7/5 ~
~
BuiesCndceomttemeswihFruz
~
~
~
~
CBOTs
~
~
~
u
7/27 Ferruzzi futures position: 22 million bushels long (49% of open interest)
7/10 Ferruzzi futursia position: 21 million bushels lng (53%erbl o to ns nterest) ttal
7/10 July sbens Conract falls $0.23 (3) te wpsibly onFeakof711COTEmrenyOre
7/7~~ht euie Ferruzzi t futures position:2milobuhllng(9ofpeitrs)iudt t
Ferruzzi physical position: 7 million bushels in deliverable locations (60-85% of total)
7/11 July soybeans contract falls $0.18 (2%), possibly on leak of 7/11 CBOT Emergency Order that requires Ferruzzi to liquidate its futures position
7/12 July soybeans contract falls $0.40 (5%)
7/18-19 July futures price spike possibly due to uncertainty in legal ability of CBOT to enforce Emergency Order
7/20 July soybean futures contract expires
Figure 1: Timeline of July Soybean Futures Contract Corner an of Man ipulation Sources: Senate Ag (1989) and CBOT (1990)
Let us now review how the Ferruzzi episode aligns with this chapter's definition of a corner and squeeze manipulation. Ferruzzi accumulated a dominant corner of the soybean market and was it CBe Jn thes to squeeze the price of the May and then July soybean futures contract. For simplicity, we will focus on the July soybean futures contract.
Ferruzzi acquired its July soybean market corner through a combination of physical and futures positions. By July 11, the firm held a physical position of 7 million bushels which represented between
60 and 85 percent of total soybeans available for delivery against the CBOT July soybean futures
contract (leaving between 1 and 3 million bushels not owned by Ferruzzi and available for delivery). In addition, Ferruzzi was 21 million bushels long futures contracts allegedly for hedging, but showing no
signs of liquidation. Indeed, Ferruzzi wrote to the CBOT on July 10 indicating that it was not going to remove its hedge before July contract expiration if it did not find other beans at an "economic price." This was an exemplar corner. Ferruzzi could demand delivery on some 20 million bushels more than were readily available to the CBOT soybean delivery points of Chicago and Toledo. As CFTC
Commissioner Hineman put it to Congress, "...and definitely one thing we both knew, there was nowhere close to enough beans in the delivery area to satisfy those [Ferruzzi's] long positions if they decided to take all those beans, to stand for delivery on all those beans (Senate Ag, 1989, p.40)."
Ferruzzi Long July Soybean Futures Position:
Percent of Open Interest on CBOT
70% 65% 0% 55% 20% 20% p.. ~ -V + -ip + + + .~ ,~,Figure 2: Ferruzzi's Soybean Futures Position as a Percent of July Contract Open Interest
With a dominant corner in place, Ferruzzi had created the ability to squeeze the July soybeans contract.
If Ferruzzi opted to begin taking delivery on any significant portion of its long futures position, the price of the futures contract would dramatically increase. The traders who remained short against Ferruzzi's
longs would be forced to acquire increasingly expensive beans from further and further away and from entities with an increasingly lower willingness to sell. In other words, shorts would be pushed up the marginal cost curve. To avoid delivery and settle their contracts with Ferruzzi, these shorts would be willing to pay an equally high price. Commissioner Hineman explained his concern of a squeeze to Congress this way: "There is another fear. I am not alleging that these things happened or did not happen, and I have no absolute knowledge that they would have happened. But these are the things that have to be foremost in your mind at that time. The other possibility is called a squeeze or a corner wherein, by the longs hanging tough, and the shorts are in the market and
cannot get out, the price just spikes up which, in my opinion, does no one any good (Senate Ag, p.41)."
The Chicago Board of Trade also explained its strong worry that Ferruzzi would manipulate the soybean contract: "...there was a concern that a market corner and price squeeze could occur...Given the dominant positions held by a single firm, there can be little question as to what might have happened. Had the firm continued to maintain its positions throughout the seven remaining trading days, it could have caused the price of the expiring soybean futures contract to rise far above the cash market value of soybeans. Participants on the other side of the market would have been precluded from settling their contracts by the alternative mechanism of delivery because the samefirm that held most of the outstanding long soybean futures positions also controlled more than 85% of the deliverable supply. Logistics of transportation would have made it difficult or impossible for others to quickly enough move sufficient additional soybeans into delivery position. By any name, the result of such a scenario would have been a market corner and ensuing price squeeze (CBOT, 1990, p.12)" (emphasis is original).
But a price squeeze at the delivery date did not occur. The CBOT and CFTC both issued emergency orders on July 11 that forced the liquidation of almost all of Ferruzzi's futures position before contract expiry (see Figure 1). However, because it was clear that traders were aware of the strong possibility of a squeeze at least a month before, it is highly likely that the market incorporated that risk into the price of the July contract as early as May (Pirrong, 2004; Senate Ag, 1989; CBOT, 1990, and others). In fact
most soybean purchasers stopped quoting the July futures price as a basis for buying beans because they believed it to be artificial (Pirrong, 2004; Senate Ag, 1989; CBOT, 1990, and others). The next
section will review in detail what occurred in the soybeans market in the summer of 1989.
Futures Prices, Profits, and Resources Required
The next logical questions one may ask is: By how much were futures prices alleged to have been inflated? How long were prices inflated? Did Ferruzzi profit? And what resources did Ferruzzi need to execute the corner and squeeze manipulation? We will answer these questions one by one. Table 1 provides a summary of the answers. Detailed tables recreating the Ferruzzi corner and squeeze manipulation can be found in the appendix at the end of this chapter.
Ferruzzi Soybean Manipulation; Summary of July 1989 Episode
July Soybean Futures Contract
[A]
[1] Maximum artificial price inflation ($/bushel) 0.45
[2] Duration of artificial prices 2 months
[3] Maximum futures position held by Ferruzzi (bushels) 32,000,000
[4] Maximum notional value of Ferruzzi futures position
($)
230,000,000[5] Capital required for Ferruzzi futures position ($) 7,000,000
[6] Maximum percent of futures open interest held by Ferrruzi 59%
[7] Profits from Ferruzzi futures position ($) -9,000,000
Physical Soybeans available for July Delivery
[8] Physical soybean stocks held by Ferruzzi (bushels) 7,000,000
[9] Value of Ferruzzi physical stocks
($)
45,500,000[10] Percent of July deliverable physical soybean stocks held by Ferruzzi 60-85%
Notes:
[1] = $7.44 * 6%; = July 10 price nultiplied by artificial price estimate.
This estimate relies on Plrrong's (2004) econometric w ork and an artificial price estimate of 6% on July 10. [2] Approximate time that traders incorporated the cost of the potential squeeze into the price of the futures contract.
Based on new s reports and Pirrong's (2004) econometric w ork.
[3] Source: CBOT (1990)
[4] = [3A] * [June 1 price]
[5] = [4A] * [3%]
[6] From Table 5 (on July 11; does not include positions after CBOT emergency order) [7] From Table 2 (from June 27 to July 20 only)
[8] Physical deliverable against the July futures contract. Source: CBOT (1990)
[9] = [8A] * $6.50 (conservative estimate of bushel value)
[10] Range based on CFTC to CBOT estimate. Sources: Senate Ag (1989) and CBOT (1990)
Table 1: Ferruzzi Soybean Manipulation; Summary of July 1989 Episode
Futures Prices
Was a squeeze avoided? Even though July soybeans were not ultimately squeezed at the date of
delivery, and the Chicago Board of Trade and the Commodity Futures Trading Commission tout that they avoided a price squeeze, the July soybean contract was most likely artificially elevated prior to the
emergency orders. It was elevated because the market knew there was a chance of a delivery price
outlets, concerns registered with the CFTC, the unwillingness of grain sellers to quote July futures basis prices, and the foreshadowing of the July event by Ferruzzi's activities around the May soybeans
contract. Market players thus incorporated the risk of a squeeze into the price of the July soybean
futures contract (Pirrong, 2004). This risk became apparent as early as May.
7.85
7.65
..7.45
7.25
I05o
Figure 3: Futures Price of July 1989 Soybean Contract
A thorough econometric analysis of the Ferruzzi soybean manipulation was undertaken by Pirrong (2004). Pirrong regresses July futures returns on September futures returns, November futures returns,
central Illinois spot returns, and a portfolio of soy meal and soy oil (crush returns). The regression uses a data set of prices for each variable from May 1 thru the expiration of the July soybeans contract for the years 1982-1995. Pirrong then determines what the econometric model predicts July 1989 soybeans futures returns "should be," based on the observed returns from the other variables in 1989 (the September, November futures, central Illinois spot, and crush returns). The difference between the model's fitted values and the observed July futures prices in 1989 represent the "residuals" that can
then be tested for their statistical significance.9 Pirrong finds that "From these residuals, one can infer that the July price was at least 5% above the competitive price [immediately before Ferruzzi's forced liquidation on July 12]... and as much as 10% (Pirrong, 2004, pp. 57, 67)." These inferences assume normality and independence.
Pirrong's econometric estimates imply mean artificial prices of at least 4 percent starting May 30, and mean artificial prices of 5 percent from June 26 thru July 11. The level of artificial price decreased after July 11, but remained inflated until July 20, the last day of trading the July contract. This is equivalent to a mean artificial price inflation of $0.29 per bushel from May 30 thru June 23, and a mean artificial price inflation of $0.36 per bushel from June 26 to July 11. Finally, the implied one-day maximum artificial price inflation was $0.45 per bushel on July 10, which represented 6 percent of the July futures closing price on July 10.
Clearly, July futures absolute prices trend upward between mid-May and immediately before the CBOT's emergency order on July 11, with large gains as the contract advanced toward expiration (see Figure 3). Interestingly though, Pirrong's largest residuals (i.e. the largest deviation from historical price
relationships) occur earlier, during the time period between about May 19 and 31. During this time period we observe less absolute price increase in the July contract, than during the later periods of June 12 to 19 and June 29 to July 5. But during these two later periods, Pirrong's model predicts no increase artificial price (residuals).
Profits
Total profits over the entire time period that Ferruzzi had positions in the July soybeans futures contract are difficult to determine due to incomplete data available on Ferruzzi's July futures positions prior to June 27. Nevertheless, by employing a few assumptions, we can make estimates of the returns to Ferruzzi during the month of June as well as July. Unfortunately, even less data is available on Ferruzzi's physical positions, and so for this reason, no returns will be calculated for Ferruzzi's physical soybean positions during this period.
From June 1 to June 27, when the artificial price and absolute price began to rise, we can infer a partial answer to Ferruzzi's returns. The Chicago Board of Trade (1990) indicates that Ferruzzi had a long
position of 32 million bushels in July futures "by early June." It is thus a reasonable assumption that Ferruzzi was already at least 20 million bushels long by June 1. And a month later, on June 27, Ferruzzi still maintained a position over 20 million bushels long. Consequently, Ferruzzi's returns for holding this position of 20 million bushels from June 1 until June 27 resulted in a profit of $6 million. Note that these calculations do not account for profits or losses from futures positions put on beyond the 22 million bushels (of which there were 10 million) or from any positions put on before June 1.
CFTC documents provide Ferruzzi's daily positions from June 27 to July 11, and the CBOT's liquidation emergency order provides the outline of Ferruzzi's position after July 11. This data allows for a fairly accurate recreation of Ferruzzi's gains and losses from its July soybean futures positions from June 27 to the close of the contract on July 20 (see Table 2). During this period Ferruzzi's mark-to-market gain was approximately $6 million from June 27 thru July 7, but from the next trading day of July 10 thru July 20 (when the absolute price began to drop likely due to leaks of CBOT's impending emergency action) Ferruzzi lost approximately $16 million.
In sum, given the above assumptions, Ferruzzi lost $4 million on its July 1989 soybeans positions between June 1 and July 20 1989.
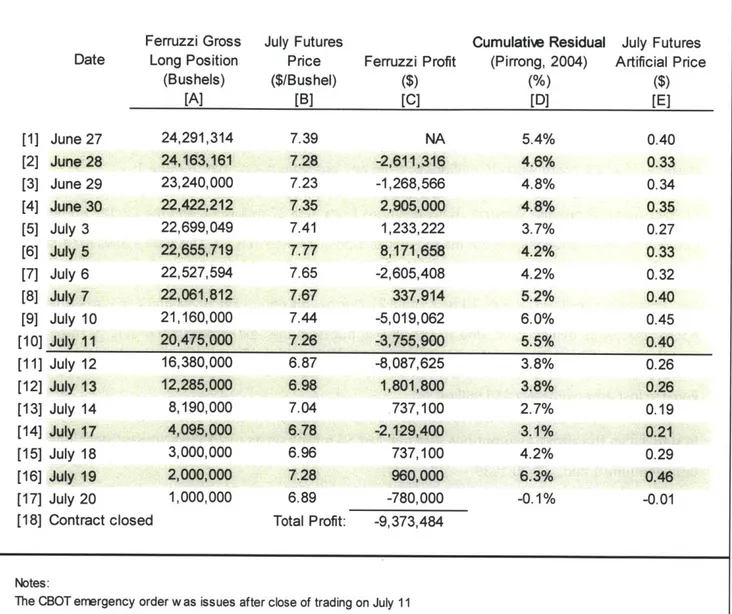
Ferruzzi Soybean Manipulation; July 1989 Futures Contract (Prices and Profits)
Ferruzzi Gross Long Position (Bushels) [A] 24,291,314 24,163,161 23,240,000 22,422,212 22,699,049 22,655,719 22,527,594 22,061,812 21,160,000 20,475,000 [1] [2] [3] [4] [5] [6] [7] [8] [9] [10] [11] [12] [13] [14] [15] [16] [17] July Futures Price ($/Bushel) [B] 7.39 7.28 7.23 7.35 7.41 7.77 7.65 7.67 7.44 7.26 6.87 6.98 7.04 6.78 6.96 7.28 6.89 Ferruzzi Profit ($) [C] NA -2,611,316 -1,268,566 2,905,000 1,233,222 8,171,658 -2,605,408 337,914 -5,019,062 -3,755,900 -8,087,625 1,801,800 737,100 -2,129,400 737,100 960,000 -780,000 Cumulatiw Residual (Pirrong, 2004) (%) [D] 5.4% 4.6% 4.8% 4.8% 3.7% 4.2% 4.2% 5.2% 6.0% 5.5% 3.8% 3.8% 2.7% 3.1% 4.2% 6.3% -0.1% July Futures Artificial Price ($) [E] 0.40 0.33 0.34 0.35 0.27 0.33 0.32 0.40 0.45 0.40 0.26 0.26 0.19 0.21 0.29 0.46 -0.01[181 Contract closed Total Profit: -9,373,484
Notes:
The CBOT emergency order w as issues after close of trading on July 11
[A] June 27 - July 11 position data based on CFTC testimony (Senate Ag, 1989);
July 12 - 20 position data based on CBOT emergency action (CBOT, 1990). [B] CBOT July 1989 futures prices (Bloomberg Terminal, 2012)
[C] = [previous day's A] * ([B] - [previous day's B]. For example: [2C] = ([2B] - [1B]);
Ferruzzi's mark-to-market profit.
[D] The difference betw een Rrrong's (2004) econometric model predicted values and
observed values in the July 1989 soybean futures contract.
[E] = [B] * [D];
The estimated artificial futures price based on Prrong's (2004) cumulative residuals.
[C1 8] = Sum of column [C]
Table 2: Ferruzzi Soybean Manipulation; July 1989 Futures Contract (Prices and Profits) Date June 27 June 28 June 29 June 30 July 3 July 5 July 6 July 7 July 10 July 11 16,380,000 12,285,000 8,190,000 4,095,000 3,000,000 2,000,000 1,000,000 July July July July July July July 12 13 14 17 18 19 20
Resources Required
To amass Ferruzzi's corner in the soybeans physical and futures markets, Ferruzzi required the
commitment of large resources. Acquiring massive soybean physical stocks was a less risky proposal for a firm that had a large processing and export business. Ferruzzi could eventually use the beans it amassed during the corner - the firm processed "10 percent of all soybeans crushed within the United States...with processing plants capable of crushing 150 million bushels of soybeans annually (Senate Ag,
1989, p.34)."
At its maximum, Ferruzzi's soybean futures position in the July contract required approximately $7 million in margin to be posted with the clearing house (see Table 2). During July as the contract neared expiration, Ferruzzi's futures positions still required approximately $5 million to be posted as margin (See Table 5).
Ferruzzi's physical stocks of soybeans in Chicago and Toledo warehouses were valued at approximately $46 million. These positions in the futures and physical markets provided Ferruzzi with a peak of 59% and 85% respectively of the futures open interest and the physical soybeans deliverable against the July contract (see Table 1).
Conclusion
The corner and attempted squeeze manipulation of soybeans in the summer of 1989, and the
emergency order response by the Chicago Board of Trade, provoked a firestorm of criticism by farmers, traders, and other soybean merchants. One result of the attention was a Congressional hearing by the Senate Committee on Agriculture, Nutrition, and Forestry on September 8, 1989. Because of this hearing, and the extensive submissions and testimony by CFTC representatives, we are given a rare inside-look at proprietary market position data, exchange documents, and the operations and thinking of the CFTC and CBOT during a corner and attempted squeeze.
A few key conclusions are evident from these documents:
1. The discretion in action that an exchange and the CFTC may take when facing a potential corner and squeeze manipulation is broad, due to the ambiguity of applicable law and regulation. This allows for inaction or a proactive approach.
2. The difficulty in determining ex ante when a corner and squeeze manipulation will occur is significant; if the corner and squeeze manipulation is averted by emergency action, the counterfactual remains difficult to prove.
3. A hedging exemption was repeatedly granted to a would-be manipulator, helping to enable the corner and squeeze manipulation; the CFTC may never know for certain if trading activity is for actual hedging. (A hedging exemption allows a firm to be exempt from speculative position limits if it is using the futures market to reduce its commercial risk).
1. Regarding the first point, an exchange has broad, independent, discretionary, "self-regulatory" power to change its rules in the event of an "emergency." "[CFTC] Commission regulations define 'emergency' as 'any occurrence or circumstance which, in the opinion of the governing board of the contract market, requires immediate action and threatens ... the fair and orderly trading in, or the liquidation of or delivery pursuant to, any contract ... on such contract market (Senate Ag, p.36) ."' This definition of "emergency" is very broad, and open to the discretion of the board of the exchange.'0
The CFTC also has the authority under the Commodity Exchange Act (CEA) to take emergency action based on broad circumstances subject to its interpretation. "The [CFTC] Commission, consistent with the provisions of Section 8a(9) of the [CEA] Act, can take emergency action when it has reason to believe that there is a threatened or actual manipulation or corner or 'other major market disturbance which prevents the market from accurately reflecting the forces of supply and demand (Senate Ag, p.190)."
Historically the CFTC has played the role of ensuring that the exchange follows its own rules as a self-regulated entity. In the case of Ferruzzi both acted; the CBOT took emergency action forcing the liquidation of all positions over 1 million bushels by contract close, and the CFTC revoked Ferruzzi's hedging exemption for the last three days of trading.
1 The process to take emergency action is defined in CBOT's rules, which had been approved by the CFTC. The CBOT does not need (immediate) CFTC approval for its emergency action. Finally, "The [CFTC] Commission is charged with reviewing the end product of that [exchange] judgment as well as the procedures followed in
2. Regarding the second point, as with any counterfactual, what "would have happened" is impossible to prove. The actions of Ferruzzi in the summer of 1989 follow closely this chapter's typical corner and (attempted) squeeze manipulation. The CBOT and CFTC were convinced that Ferruzzi's actions "likely would have led to severely distorted July soybean futures prices, and could have resulted in contract defaults (Senate Ag, 1989, p.25)," Nevertheless, without the final smoking gun of Ferruzzi demanding deliveries beyond the available supply, we are left inferring its intentions. Ferruzzi claimed innocence, while paying fines to the CBOT and settling for $21.5 million in a class action lawsuit.
3. Regarding the third point, a hedging exemption to the speculative position limit of 3 million bushels of soybeans had been granted to Ferruzzi for the futures contract months of May and July by the CFTC. Indeed, Ferruzzi, as a major processor and exporter of soybeans, had been regularly granted hedging exemptions. The CFTC grants hedging exemptions according to the Commodity Exchange Act, and moreover, hedging is a primary reason for the existence of futures markets. Nevertheless, although hedging exemptions are necessary features of futures markets, this particular hedging exemption allowed Ferruzzi to create its dominant corner by using the futures market as well as the physical
market. It is thus evident that acquiring a corner can be achieved with much greater ease when the perpetrator has been granted a hedging exemption.
A corner using the futures market with a hedging exemption was made possible because of the difficulty in determining if trading activity is in fact bonafide hedging. Even with extensive communication and investigation, the CFTC had no ultimate way to determine whether a firm's futures positions are truly for "anticipatory hedging." This difficulty was apparent during the summer of 1989. Ferruzzi was able to make extensive claims as to its imminent physical soybean purchases and thus its qualification for an "anticipatory hedge." When a firm does not lift its hedge near the very end of a contract, it may become increasingly apparent that the position is not intended as a hedge, but by then it may be too late to avoid a market disruption.
A major check on commercial firms that have a genuine interest in laying-off risk in the futures market from abusing their hedging exemptions is self-regulatory in nature. Commercial firms who wish to hedge need the system to work. If they abuse the system, the hedging function of the market will break down and they may be banned from the market, irrespective of the ex post financial penalties they will face. Former CFTC Commissioner Hineman explained this phenomenon to Congress: "I think we have to talk
just a little bit about the fundamentals and the theory of a futures market. Futures markets basically work, in my opinion, because the large commercials want it to work. And they do not want to mess up those markets. And it is to everyone's best interest, regardless of their physical needs for product, to make sure that there is an orderly delivery or an orderly liquidation at the end of that market (Senate Ag, 1989, p.41)."
In spite of the incentive for commercial market players to have the hedging system to work, as we saw in the Ferruzzi case, that system can go wrong. However, those same self-regulatory incentives would apply much less to pure speculators without hedging interests, who instead make their business from favorable moves in the futures price. For these speculators, a one-time windfall of illicit profit from a corner and squeeze manipulation may be worth the cost of not being welcome back in that particular market and the fines imposed by the CFTC and risk of a difficult civil court prosecution. While hedging exemptions to position limits must always exist, position limits for speculators would be appropriate for the purpose of limiting corner and squeeze manipulations, given the prerequisite futures/physical position required for a price squeeze.
2.2.2 Case Study: Arcadia Oil Manipulation of 2008
In 2008 a group of traders allegedly manipulated oil futures prices and reaped unlawful profits of $50 million. The CFTC filed a civil action against Arcadia et al. (Arcadia) in May, 2011, alleging that Arcadia used its physical crude oil position to repeatedly force futures prices up and then back down. The allegation generally follows this thesis' definition of a corner and squeeze manipulation, however the Arcadia corner and squeeze manipulation is not typical. This case study will first describe the allegations and compare them to our definition of a corner and squeeze manipulation; second, present a detailed recreation of Arcadia's crude oil positions, profits, and futures price over time; and finally, draw conclusions.
The best starting point for understanding the alleged manipulation is to review the CFTC's summary of its civil case against Arcadia (CFTC, 2011a, p.1):
The U.S. Commodity Futures Trading Commission (CFTC) today filed a civil enforcement action in the United States District Court for the Southern District of New York against Parnon Energy Inc. (Parnon) of
California, Arcadia Petroleum Ltd. (Arcadia Petroleum) of the United Kingdom, Arcadia Energy (Suisse) SA (Arcadia Suisse) of Switzerland, James T. Dyer of Australia and Nicholas J. Wildgoose of California,
charging them with unlawfully manipulating and attempting to manipulate New York Mercantile Exchange (NYMEX) crude oilfutures prices from January 2008 to April 2008.
As alleged in the CFTC complaint, during the relevant period defendants traded futures and other contracts that were priced off of the price of West Texas Intermediate light sweet crude oil (WTI). WTI is delivered to commercial users at Cushing, Okla., a major crude oil delivery point. The price of WTI is a benchmarkfor crude oil prices around the world, and the supply of WTI at Cushing is an important driver of WTI price.
According to the allegations, defendants conducted a manipulative cycle, driving the price of WTI to artificial highs and then back down, to make unlawful profits. First, they purchased large quantities of physical WTI crude oil during the relevant period, even though they did not have a commercial need for crude oil. They purchased the oil pursuant to their scheme to dominate and control the already tight supply at Cushing to manipulate the price of WTI upward and to profit from the
corresponding increase in value of their WTlfutures and options contracts (WTI Derivatives) on NYMEX and Intercontinental Exchange
(ICE). Next, once WTI reached artificially high prices and they had taken
profits from their long WTI Derivative position, defendants allegedly engaged in additional trading activity - selling more WTI Derivatives
short at the artificially high prices. Finally, defendants allegedly
strategically sold off their physical holdings of WTI, mostly all on one day, to drive the WTI price back down and to profit from their short WTI
Derivatives position. Pursuant to this manipulative cycle, driving the WTI price up and then back down, which they conducted in January and
March 2008, and attempted in April 2008, defendants realized profits from their WTI Derivatives trading that exceeded $50 million, according
In addition, a helpful timeline of the alleged Arcadia manipulation can be found in the CFTC's court filing, reproduced here (CFTC, 2011b, p.10):
Thereafter, as alleged more particularly below, the Defendants' manipulative scheme comprised taking the following steps:
First, amassing a large physical WTI position, to be delivered the next month at Cushing, to dominate and control WTI supply even though they had no commercial need for crude oil;
Second, contemporaneously establishing a long near month/next
month WTI Derivatives calendar spread position on the NYMEX and
ICE with the intent to artificially inflate the value of that position by
driving WTI prices higher;
Third, refraining from selling their physical WTI before the cash
window opened, to lull the market into believing that they had committed their oil to storage or commercial use, and thus cause or contribute to causing the near month calendar spread to rise to an artificial level, to maximize the value of the their long WTI Derivatives position;
Fourth, establishing a substantial short position in the subsequent series
of WTI Derivatives calendar spreads at artificially high prices, knowing they were about to surprise the market with a surplus of physical WTI; Finally, suddenly selling/dumping their physical position during the cash window, thus creating the surprise surplus they had planned all along, to drive prices back down and maximize the value of their short WTI Derivatives calendar spread position.
The above timeline of events was repeated twice by Arcadia and attempted once more before the CFTC informed Arcadia that it was under investigation in April 2008. Figure 4 displays the physical crude oil and derivatives positions of Arcadia during January 2008. Figure 4 was created using data provided by CFTC (2011b), and graphically corroborates the storyline presented above.
Timeline of Arcadia's Crude Oil Derivatives and Physical Position, 2008
14 12 10 8 6Physical Crude Oil -Long Feb Futures Spread -Short March Futures Spread
/
Figure 4: Arcadia's Alleged January 2008 Manipulation Timeline
Let us now compare the January 2008 events of the alleged Arcadia manipulation with the definition of a corner and squeeze manipulation proposed by this thesis. The Arcadia manipulation stretches our definition of both of these terms.
Our basic definition of a corner requires "controlling enough of a commodity to exert market power." In
January, Arcadia acquires its corner position in the physical market by controlling 4.6 of an estimated 5 million barrels of crude oil available for delivery against the February WTI futures contract (CFTC,
2011b). In turn, our basic definition of a squeeze is "when a cornerer exercises her market power to
force the price of futures beyond the competitive equilibrium." Arcadia executes its "squeeze" by keeping all of its approximately 90 percent of the available crude oil off of the market and effectively shifting up the oil supply curve to make it more expensive to acquire and deliver oil against a February WTI futures contract. This can be considered artificially driving up the price of the February futures contract since Arcadia did not have a commercial need for the amount of physical crude oil it acquired,
and instead was withholding the crude oil from the market with the sole intent of pushing the futures
price upward (CFTC, 2011b).
To make the corner and squeeze manipulation profitable, Arcadia took long and then short positions in the futures market." Before the squeeze, Arcadia acquired a long February futures position to benefit from the subsequent price increase near contract expiration due to the artificially restricted physical
supply (see Figure 5). Arcadia then acquired a short March futures position to benefit from the price decrease that would occur when Arcadia sold off all of its physical position and depressed the March futures price (the "burying the corpse" effect).
If you have read the detailed definition of a corner and a squeeze in the section above, you will
recognize that we have deviated significantly from our typical corner and squeeze manipulation description. Key differences are found in Table 3.
A corner is frequently acquired thru a Arcadia's market power was due to its physical combination of physical and futures positions position only
During the squeeze, the cornerer demands Arcadia demands no delivery against its futures
excessive deliveries against its futures contracts contracts at expiry
Excessive futures deliveries drive up futures Arcadia's excessive physical position drives up prices; i.e. excessive demand drives up prices prices; i.e. restricted supply drives up futures price
Table 3: Key Differences between a Typical Corner and Squeeze Manipulation and the Alleged Arcadia
Corner and Squeeze Manipulation
Futures Prices, Profits, and Resources Required
The next logical questions one may ask is: By how much were futures prices alleged to have been inflated? How long were prices inflated? How much money did Arcadia make from the different phases of the manipulation? And what resources did Arcadia need to execute the corner and squeeze
1 The long and short positions acquired by Arcadia were actually long and short "spread" positions. A long spread
position means long the near-month contract and short the next-month contract. Conversely, a short spread position means short the near-month contract and long the next-month contract. Thus, when Arcadia was "long February futures," Arcadia was actually long February contracts and short the same number of March contracts. And when Arcadia was "short March futures," Arcadia was actually short March contracts and short the same number of April contracts. This means that Arcadia profits on a long February spread (long Feb and short March) futures position when the price of Feb increases relative to the price of March futures.
manipulation? We will answer these questions one by one. Table 4 provides a summary of those answers. Detailed tables recreating the Arcadia corner and squeeze manipulation can be found in the appendix at the end of this chapter.
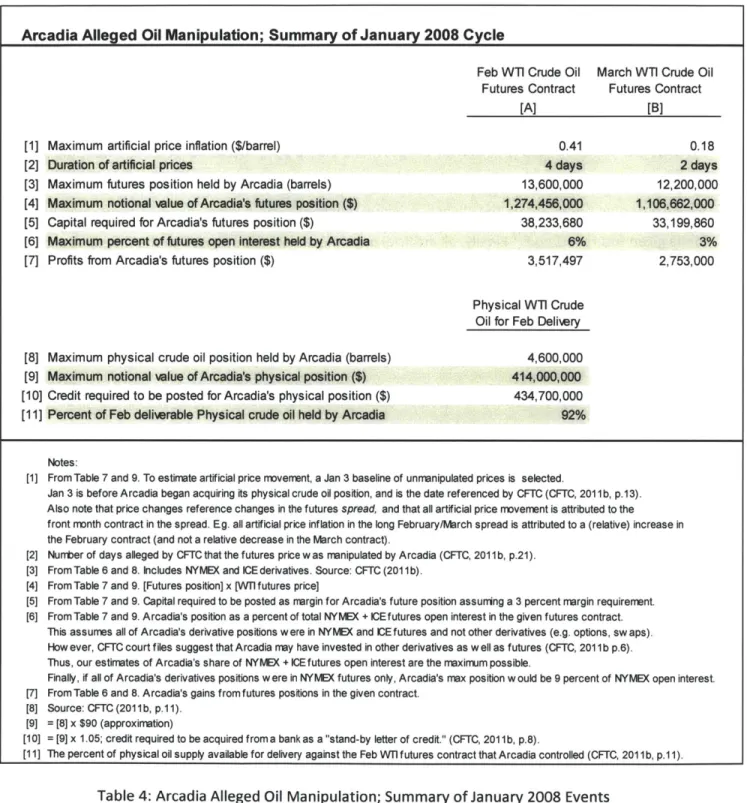
Arcadia Alleged Oil Manipulation; Summary of January 2008 Cycle
Feb Wi Crude Oil March WTI Crude Oil Futures Contract Futures Contract
[A] [B]
[1] Maximum artificial price inflation ($/barrel) 0.41 0.18
[2] Duration of artificial prices 4 days 2 days
[3] Maximum futures position held by Arcadia (barrels) 13,600,000 12,200,000 [4] Maximum notional value of Arcadia's futures position ($) 1,274,456,000 1,106,662,000
[5] Capital required for Arcadia's futures position ($) 38,233,680 33,199,860
[6] Maximum percent of futures open interest held by Arcadia 6% 3%
[7] Profits from Arcadia's futures position ($) 3,517,497 2,753,000
Physical Wi Crude Oil for Feb Deliwry [8] Maximum physical crude oil position held by Arcadia (barrels) 4,600,000 [9] Maximum notional
value
of Arcadia's physical position ($) 414,000,000 [10] Credit required to be posted for Arcadia's physical position ($) 434,700,000 [11] Percent of Feb deliverable Physical crude oil held by Arcadia 92%Notes:
[1] From Table 7 and 9. To estimate artificial price movement, a Jan 3 baseline of unmranipulated prices is selected.
Jan 3 is before Arcadia began acquiring its physical crude oil position, and is the date referenced by CFTC (CFTC, 2011b, p.13). Also note that price changes reference changes in the futures spread, and that all artificial price movement is attributed to the
front month contract in the spread. Eg. all artificial price inflation in the long February/March spread is attributed to a (relative) increase in the February contract (and not a relative decrease in the March contract).
[2] Nurrber of days alleged by CFTC that the futures price w as manipulated by Arcadia (CFTC, 2011b, p.21).
[3] From Table 6 and 8. Includes NYMEX and ICE derivatives. Source: CFTC (2011 b).
[4] From Table 7 and 9. [Futures position] x [WT1 futures price]
[5] From Table 7 and 9. Capital required to be posted as rnargin for Arcadia's future position assuning a 3 percent margin requirement.
[6] From Table 7 and 9. Arcadia's position as a percent of total NYNEX + ICEfutures open interest in the given futures contract.
This assumes all of Arcadia's derivative positions w ere in NYNEX and ICE futures and not other derivatives (e.g. options, sw aps). How ever, CFTC court files suggest that Arcadia may have invested in other derivatives as w ell as futures (CFTC, 2011 b p.6). Thus, our estimates of Arcadia's share of NYNEX + ICE futures open interest are the maximum possible.
Finally, if all of Arcadia's derivatives positions were in NYNEX futures only, Arcadia's max position would be 9 percent of NYMEX open interest.
[7] From Table 6 and 8. Arcadia's gains from futures positions in the given contract. [8] Source: CFTC (2011b, p.11).
[9] = [8] x $90 (approximation)
[10] = [9] x 1.05; credit required to be acquired from a bank as a "stand-by letter of credit." (CFTC, 2011 b, p.8).
[11] The percent of physical oil supply available for delivery against the Feb Wilfutures contract that Arcadia controlled (CFTC, 2011b, p.11).
Futures Prices
During the alleged January 2008 manipulation, the estimated maximum artificial crude oil futures price inflation was $0.41 per barrel for the February 2008 WTI futures contract, and the maximum futures price inflation of the March 2008 WTI futures contract was $0.18 (see Table 4). Artificial prices are alleged to have occurred for a total of six days; four days for the February contract and two days for the March 2008 contract. Complete calculations can be found in Table 6 thru 9.
These figures rely on a few key assumptions. First, the days with artificial prices inferred are based on the days that the CFTC (2011b) explicitly alleges manipulated prices occurred. Second, a baseline of
unmanipulated prices is assumed in order to calculate the artificial prices. The baseline dates were picked based on prices before the alleged manipulation began. Third, artificial prices represent changes in the given futures spread.12
Finally, all artificial price movement is attributed to the first contract month of the given spread. For instance, the $0.41 of artificial increase in the long February/March spread is all attributed to an artificial increase in the long February contract relative to the March contract (see Table 7).
0.70
10.60
0.50
40.40
Figure 5: February/March WTI Crude Oil Futures Spread Price in January 2008
Profits
According to the CFTC, Arcadia realized profits of $50 million from derivatives, but losses of $15 million from physical trades in the cash market (CFTC, 2011b). This CFTC figure includes the sum of both the January and March 2008 manipulation cycles. Using the CFTC's position data on Arcadia and concurrent
futures prices, we calculate a $6 million profit from Arcadia's derivatives positions from the January manipulation only (see Table 6 and Table 8). Insufficient information on physical prices does not allow the calculation of losses from physical trades during the January manipulation. The later alleged March


![Table 5: Ferruzzi Soybean Manipulation; July 1989 Futures Contract (Resources)[1][2][3][4][5][6][7][8][9][10][11][12][13][14][15][16][17]](https://thumb-us.123doks.com/thumbv2/123dok_us/1598804.2715973/36.918.123.852.189.870/table-ferruzzi-soybean-manipulation-july-futures-contract-resources.webp)
