ECOSYSTEMS SERVICES MARKETS
Economic Instruments for Water
Management in Canada:
Case Studies and Barriers to Implementation
1Key Messages
• Although Canada has abundant freshwater resources, there are regions of the country that are subject to periodic water scarcity. Poor water quality can also exist, particularly in basins where there is significant agricultural, industrial and/or municipal development.
• Market-based instruments2 – such as efficient pricing (i.e. pricing that accounts for all associated costs), permits or trading – can be used to regulate water demand, increase the efficiency of water use, improve water quality and defray the cost of water infrastructure. These tools are currently under-utilized in Canada for water management.
• Theory, and international policy experience, suggests that using market-based instruments together with traditional regulation can achieve desirable water-policy outcomes at a lower economic cost than regulation alone.
1 This Policy Brief is based on a paper on the same topic authored by Amy Mannix, with direction from Dr. Vic Adamowicz, while she was a research assistant at the University of Alberta. Sustainable Prosperity would like to thank Dr. Steven Renzetti of Brock University and David McGee of Alberta Environment for their thoughtful comments and contributions to this Brief. Responsibility for the final product and its conclusions is Sustainable Prosperity’s alone, and should not be assigned to any reviewer or other external party.
2 The terms “market-based” and “economic” are used interchangeably with regards to instruments in this Policy Brief. Sustainable Prosperity is a national
research and policy network, based at the University of Ottawa. SP focuses on market-based approaches to build a stronger, greener, more competitive economy. It brings together business, policy and academic leaders to help inno-vative ideas inform policy development.
Sustainable Prosperity
c/o University of Ottawa 555 King Edward Avenue Ottawa, ON K1N 6N5 613-562-5800 x3342 www.sustainableprosperity.ca SP-PB-26 40 -SEPT-20 11
The Issue
Water is cheap in Canada. Canada has some of the lowest water tariffs among Organisation for Economic Co-operation and Development (OECD) countries, both in terms of the share of disposable income for the lowest-income population percentile (an average of 1.2 per cent), and as a share of average net disposable income (0.3 per cent).3 These low prices lead
to inefficient water use and often create a funding gap for municipal governments, because the amount paid by users does not typically cover the full costs of supplying water. This means that governments are either forced to divert revenues from other sources, or reduce budgets for water infrastructure. Price signals that reflect the full cost of treating and delivering municipal water services are required to encourage more efficient consumption patterns, increase technological innovation and renew investments. In some cases, competitive markets for water, which can also encourage efficient water use, may be appropriate. Even though efficient water pricing and competitive water markets are being used in many jurisdictions internationally, they are underused in Canada. This is regrettable, as the use of market-based instruments alongside traditional regulation can achieve environmentally beneficial outcomes such as increased water use efficiency.
This Brief provides a discussion of some lessons and policy barriers for the future use of market-based instruments in Canadian water policy. It then presents two case studies of Canadian jurisdictions that have implemented economic instruments for water management.
3 OECD, Pricing Water Resources and Water and Sanitation Services. (Paris, France: 2010)
Price signals that reflect the full cost
of treating and delivering municipal
water services are required to
encou-rage more efficient consumption
patterns, increase technological
innovation and renew investments.
The Knowledge Base
The Canadian Water Context: Brief Overview
Canada is a water abundant country. Consider the following facts:
• Canada has the greatest volume of water resources, both in total and renewable terms, among OECD countries.4
• On an annual basis, Canada’s rivers discharge seven per cent (105,000 m3/s) of the world’s renewable water supply.5
• Canada has 25 per cent of the world’s wetlands – the largest wetland endowment in the world.6
• Freshwater withdrawals are approximately 1.5 per cent of the available resource.7
Despite Canada’s relative wealth of fresh water, there are two persistent issues facing Canada’s water supply in particular regions: water scarcity and water quality.
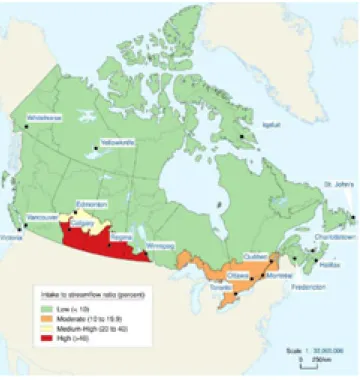
There are regions in Canada – particularly in the Prairies – that experience water scarcity (Figure 1). Water scarcity occurs because the seasonal pattern of water demand does not synchronise with natural weather and groundwater renewal patterns. Hydroelectricity generation produced by storing water (as opposed to run-of-river operations) may cause similar issues.
4 OECD, OECD Environmental Data. Compendium 2006–2008. Inland Waters. (Paris, France:2008)
5 Environment Canada, Quickfacts, accessed March 13, 2010, http://www.ec.gc.ca/eau-water/default.asp?lang=En&n=11A8CA33-1. 6 Ibid.
7 OECD, OECD Environmental Performance Reviews: Canada. (Paris, France, 2004)
Canada has the greatest volume
of water resources, both in total
and renewable terms, among
OECD countries.
Figure 1: Water use and availability by drainage region (2009)
Source: Statistics Canada. 2009. Human Activity and the Environment. Annual Statistics 2009. Catalogue no. 16-201-X. Environmental Accounts and Statistics Division.
Water scarcity in certain areas of Canada is exacerbated by low water prices, which provide little incentive to use water efficiently. Most Canadians pay less than $0.02/litre (including both fixed and variable costs) for water and wastewater services.8 This only covers about
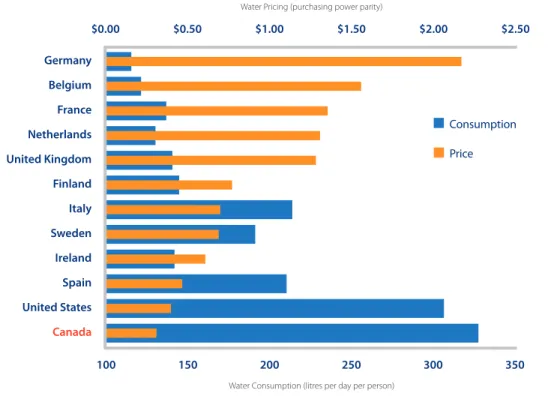
70 per cent of the total costs of supplying that water.9 Figure 2, which contrasts usage to
price, shows that Canadians are among the highest water consumers in the world with water-usage rates that are almost 70 per cent higher than the OECD average.10,11
8 Coad, L. CanCompete: Improving Infrastructure Management – Municipal Investments in Water and Wastewater Infrastructure. The Conference Board of Canada, 2009.
9 Renzetti, S. Wave of the Future: The Case for Smarter Water Policy. Commentary no. 281. C.D. Howe Institute (Toronto, 2009).
10 Statistics Canada, Environmental Accounts and Statistics Division. Human Activity and the Environment. Annual Statistics 2003, Catalogue no. 16-201-XIE (Ottawa, 2003).
11 OECD. OECD Environmental Data. Compendium 2006–2008. Inland Waters. (Paris, France, 2008).
Canadians are among the highest
water consumers in the world with
water-usage rates that are almost
70 per cent higher than the OECD
average.
Figure 2: Canadian municipal water prices and consumption, compared to selected countries (2010) Germany Belgium France Netherlands United Kingdom Finland Italy Sweden Ireland Spain United States Canada 100 150 $0.00 $0.50 $1.00 $1.50 $2.00 $2.50 200 250 300 350 Consumption Price
Water Pricing (purchasing power parity)
Water Consumption (litres per day per person)
Source: Innovolve Group, “Water and the Future of the Canadian Economy.” http://www.watersummit.ca/, 2010.
Yet, water quality is perhaps of greater concern. One example of a water quality issue is human-induced eutrophication of rivers and lakes. Eutrophication is the excessive growth of plant and algae species associated with excess nutrients from agriculture and urban wastewater; a prominent example is the algal growth in Lake Winnipeg.12 Other examples
include periodic incidents of drinking water alerts.
Economic instruments that improve either water availability or quality are underutilized in Canada. A common explanation for this is that Canadians are not comfortable viewing water as an economic good. The OECD points out:
“… the public often regards water as a limitless resource and a gift of nature, [hence] the notion that water is also an economic good with social and ecological functions is not yet readily accepted. Therefore, water management often lacks an econo mic information and analytic base. Many price signals are inappropriate and
subsidisation is pervasive…
12 Bourne, A., N. Armstrong and G. Jones. “A preliminary estimate of total nitrogen and total phosphorus loading to streams in Manitoba, Canada.” Water Quality Management Section, Manitoba Conservation Report (No. 2002-04), accessed April 16, 2010: http://www.gov.mb.ca/ waterstewardship/reports/quality/nutrient_loading_report_2002-04_november_2002.pdf (2002).
Little progress has been made to date in implementing the user pays principle, although it features in various provincial policies and is the “headline” strategy in the 1987 Federal Water Policy.”13
The Use of Economic Instruments for Water Management: Theoretical
Challenges and Opportunities
This section discusses the theory and design of economic instruments for water management in several contexts.
Economic instruments for water management can be designed to fit particular policy goals and market characteristics. One advantage of economic instruments is that they provide an incentive for water users (or polluters, where applied to water quality) to make trade-offs by determining the net value of water-using activities. For example, water pricing may provide an incentive to invest (up to an efficient level) in technology improvements that ultimately lead to reduced water usage.
When designing economic instruments, it is important to determine the different types of economic costs involved, and which costs will be faced by each water user. These will likely include the operation costs incurred in providing water supply and treatment services, but may also include the costs associated with the forgone opportunity of using water for alternative uses (for example, preserving in-stream ecology). In the case of water supply and wastewater treatment services that require significant infrastructure investment, the economic costs also include the forgone opportunity of using infrastructure funds to finance other public projects. Naturally, the choice of using economic instruments should consider whether the total benefits outweigh the total costs, taking into account initial and ongoing costs (for example, monitoring and administration) relative to alternative policy instruments.
Urban Water Pricing
Urban water supply is defined as the delivery of treated or potable water and removal of waste water within municipal boundaries and includes residential, commercial and industrial uses. In Canada, water is funded from a range of sources: municipal taxes, provincial or federal grants, developer fees (for new expansions), user fees and service charges.14 A common pricing structure for urban water supply is a two-part tariff, consisting
of a single volumetric price that ideally reflects the marginal cost of water use, and a fixed service charge to recover the fixed costs of supply. The challenges in this system are twofold. 13 OECD, OECD Environmental Performance Reviews: Canada. (Paris, France, 2004), 70–71. Bold is Sustainable Prosperity’s emphasis.
14 Coad, L. CanCompete: Improving Infrastructure Management – Municipal Investments in Water and Wastewater Infrastructure. The Conference Board of Canada, 2009.
Naturally, the choice of using
economic instruments should
consider whether the total benefits
outweigh the total costs, taking into
account initial and ongoing costs
(for example, monitoring and
administration) relative to
alternative policy instruments.
First, complete information is required to determine the cost basis for each tariff component. Second, many jurisdictions want to ensure the fixed service charge is not regressive – that is, it does not disproportionately impact low-income groups.
Prices should reflect the direct and indirect costs of water supply as well as the opportunity costs. The direct costs of water supply include treatment and pumping, as well as costs related to replacing assets in the pipeline distribution network once their useful life has expired. There are also marginal costs related to selecting the size of those assets. The indirect costs include the impacts on water quality from wastewater disposal (estimated in dollar values). Opportunity costs encompass the value of all productive resources (purchased or not) used in the supply of water, including the value of preserving in-stream flows. Opportunity costs in particular are difficult to measure, as they may vary with the timing of diversions and return flows. If water is scarce due to competing uses (for example, agriculture and industry) then the marginal benefits of the next most-profitable activity would also form part of the opportunity costs of urban water supply.
The institutional design of water supply and wastewater treatment is important for creating the conditions that promote efficient operation, acceptable service provision (for example, minimisation of supply interruptions or sewerage blockages), environmental regulation (for example, demand management during drought, sewage overflow events, wastewater quality), and technological innovation (for example, development of alternative supply sources or optimisation of infrastructure networks). The implementation of water-pricing strategies should include the independent oversight of urban water supply backed by well-designed regulations to ensure operations are handled efficiently, prices are set to cover costs, and services are adequately maintained.
Basin Water Allocation
Economic instruments for basin water allocation are usually adopted in areas where water is sufficiently scarce. This typically coincides with regions where the total water demand is dominated by agriculture.
Similar to urban water supply, the design of an economic instrument for basin water allocation should ensure that water users are aware of the opportunity costs of their water use. The types of economic instruments that can be developed include prices and a market for transferring water licences and/or seasonal allocations. The design choices for a market include the method of accounting for environmental demands along different river reaches,15 and the treatment of different water-use sectors including municipal uses.
15 Bjornlund, H. The Competition for Water: Striking a Balance among Social, Environmental and Economic Needs. C.D. Howe Institute, Commentary no. 302. Accessed April 5, 2010: http://www.cdhowe.org/pdf/commentary_302.pdf, (Toronto, 2010).
Prices should reflect the direct and
indirect costs of water supply as
well as the opportunity costs.
It must be noted that the existence of a market does not guarantee that water use will be efficient. Risk management is required to mitigate the range of potential sources of market failure (for example, imperfect information, inefficient subsidies); if these cannot be adequately addressed, then markets may not be suitable and other forms of policy instruments may perform better. For example, if there are only a small number of players, or licences are complex and dissimilar, then there is the risk that a water market will be illiquid and/or unbalanced. Underlying subsidies may also be an important factor. Similar to urban water supply systems, the use of full cost accounting for irrigation districts requires the inclusion of long-run replacement costs of supply assets. This includes headworks (dams located in the upper catchments operated for irrigation supply purposes), whose costs may comprise a sizeable portion of the full costs of supplying an irrigation district. Water Quality Control
Where the total discharge of water contaminants has been restricted, a water quality market may be designed based on the concept of “offsets.” In this scenario, those who plan to undertake new activities that result in the discharge of contaminants must seek to ensure there is no net change in environmental outcomes. This is done by arranging for conservation measures that indirectly offset their impacts; this approach is explored in more detail in a case study described later in this Brief. To ensure economic efficiency and to avoid perverse incentives, acceptable offset activities should only be those that would not otherwise be carried out if there were no scheme in place. Offsets activities are considered to be above and beyond the actions required under existing regulations. Monitoring is an issue with many offset schemes, particularly for non-point sources of pollutants (for example, run-off from agricultural land). Physical relationships may not be sufficiently known to accurately determine cause and effect, which in turn creates difficulties for estimating the potential benefits of mitigation measures.
Risk management is required to
mitigate the range of potential
sources of market failure (for
example, imperfect information,
inefficient subsidies); if these cannot
be adequately addressed, then
markets may not be suitable and
other forms of policy instruments
may perform better.
Case Studies
Two Canadian case studies are presented below. The first, the South Nation basin, highlights how a market has been used to improve water quality. The next examines water quantity issues in Alberta, through the example of the South Saskatchewan River basin. These studies illustrate how markets are being used to deal with issues of scarcity and efficient allocation within water basins.
South Nation River basin: Use of Offsets to Improve Water Quality
16Concentrations of phosphorus in the South Nation River basin of eastern Ontario are well in excess of provincial guidelines.17 Non-point sources – that is, pollution
from diverse sources (for example, agricultural lands) – are estimated to contribute 90 per cent of the phosphorus load. The Ontario Ministry of Environment (MOE) ceased issuing new permits for point source phosphorus discharge in the basin in 1998. MOE also designed an offset scheme, which enables new developments to discharge phosphorus provided that it is offset by mitigation activities elsewhere in the basin. This offset scheme is an attempt to reduce the costs that arose due to the permit cap.
Under the offset scheme, new developments are able to purchase offsets from the South Nation Conservation Authority (SNCA), an organization whose mandate is to manage the South Nation watershed. Following the purchase of offsets, the SNCA issues grants to rural landowners so that they can voluntarily undertake phosphorus mitigation activities. For example, farmers can build manure storage facilities, establish buffer strips along streams, reduce tillage of crops or use cover crops, and use vegetation to filter agricultural runoff. The average cost of offset activities is estimated by the South Nation Conservation Authority
to be $400 per kg of phosphorus removed. This estimate includes management and monitoring costs.18 Since 1993, SNCA has issued more than $2 million in grants and helped
develop over 631 projects.19
16 This case study draws on the work of O’Grady, D. “Point to non-point phosphorus trading in the South Nation River watershed.” WIT Transactions on Ecology and the Environment Vol. 108: Environmental Economics and Investment Assessment II. (UK: Wessex Institute of Technology Press, 2008). 17 The annual mean concentration of phosphorus in the lower reach of the watershed is 0.129 mg/L, which is more than four times the
concentration of the provincial guidelines of 0.03 mg/L (O’Grady, 2008).
18 O’Grady, D. “Point to non-point phosphorus trading in the South Nation River watershed.” WIT Transactions on Ecology and the Environment Vol. 108: Environmental Economics and Investment Assessment II. (UK: Wessex Institute of Technology Press, 2008).
19 South Nation Conservation. “Clean Water Program Grants.” http://www.nation.on.ca/en/your-water/clean-water-program-grants/ (2011).
These studies illustrate how markets
are being used to deal with issues
of scarcity and efficient allocation
within water basins.
An important feature of the phosphorus offset scheme is that each kilogram of point-source phosphorus discharge requires that four kilograms of non-point source phosphorus be mitigated. This deliberately high ratio is due to:
“… the unique nature of the Total Phosphorus Management program (the first of its kind in Ontario), lack of knowledge on how much P [phosphorus] is first transported, then delivered, to watercourses, and the debate on how much of the P in the water is soluble vs. particulate. The high offset ratio also allows a buffer in the event that a [offset activity] is not 100% effective.” (O’Grady, 2008:190)
The offset scheme’s design demonstrates that political constraints influenced both efficiency and equity outcomes of the project. Strong initial opposition came from the agricultural community, which believed that point-source dischargers had been given “a licence to pollute, and that the public would perceive that farmers were the cause of the problem if they were doing all the work and getting all the grants.”20 Moreover, the scheme has an
unorthodox risk distribution, in that those who purchase offsets are still legally responsible if phosphorus targets are not met – that is, neither the South Nation Conservation Authority as the broker, nor landowners who receive grants, are liable for achieving phosphorus mitigation outcomes. To ensure its participation, the farming community required that field inspectors be farmer representatives, and that the offset ratio be increased from the planned 2:1 ratio to the current 4:1 ratio.21 Municipalities have paid upwards of $500,000
for phosphorus offsets, and, in addition to reduced costs for new dischargers, the scheme has been financially beneficial for local farmers.22
South Saskatchewan River basin
23: Water Transfers
Alberta’s Water Act allows for the creation of a water market, where water licences may be transferred (that is, exchanged between a willing buyer and a willing seller) on a permanent or temporary basis, under an approved water management plan. The South Saskatchewan Water Management Plan was approved in 2006, and enables water transfers in the South Saskatchewan River basin.24
Alberta’s water resources are governed based on a system of prior allocation, where water licences are tied to land or specified facilities.25 This means that the
20 Ibid. 21 Ibid. 22 Ibid.
23 Unreferenced facts are based on a conversation with David McGee of Alberta Environment on July 20, 2011.
24 Alberta Environment. Approved Water Management Plan for the South Saskatchewan River Basin (Alberta). Accessed March 22, 2010 http://environment.alberta.ca/1725.html (2006).
25 University of British Columbia Program on Water Governance. “Fact sheet: Water rights across Canada.” http://www.watergovernance.ca/factsheets/ pdf/FS_Water_Rights.pdf.
Alberta’s
Water Act
allows for the
creation of a water market, where
water licences may be transferred
(that is, exchanged between a willing
buyer and a willing seller) on a
permanent or temporary basis,
under an approved water
management plan.
first one to apply for the right to use the available water (under a licence application), has the right to claim first use of the water during a shortage. The objective of this allocation is to protect existing capital investments from water shortages that are the result of newer entrants.26 Technically, those holding water licences with an earlier date are able to obtain
their full licensed volume (subject to licence terms and conditions) before the next in order is granted access. In practice however, unless there is a water shortage, licence holders of various levels of seniority will be simultaneously drawing from the same source.
In the South Saskatchewan River basin, the majority (84 per cent) of the licensed allocations are owned by irrigation districts, a significant portion of which are senior licences.27, 28 The transfer of a water licence requires the support of 50 per
cent of irrigation district members via a plebiscite.29 Members have little incentive
to vote for a water transfer, as each member does not directly receive the proceeds from the transfer, but may perceive a loss in the security of their water supply.30
The water trading system has other large licensees (for example, the City of Calgary), which similarly appear to be reluctant to transfer licences (or unable to due to restrictions). Still, despite the disinclination to trade water licences, some senior licence holders, such as the City of Calgary, have achieved large reductions in per capita water use through water conservation programs.
Since 2006, less than 25 permanent transfers (excluding administrative transfers to the same licensee or user group) have taken place. Transfers are administratively complex, given that, for a transfer to occur, an evaluation must be made to ensure that the transfer would have no adverse effects on the environment or other users. The
complexity of transfers, along with factors such as the sophistication of the buyers and sellers, affect the amount of time it takes to complete a transfer. Temporary transfers are possible, but are risky for buyers who need a long-term water supply to match their investment time period. The Water Act (s.55(1)(f)) has several other important features. First, it allows for the
cancellation of unused licences and the reduction of unused portions of licences. While many licences have been cancelled over the years, the reduction clause has not been applied. Further, water-use rights are not clearly defined, particularly with respect to the discharge of the non-consumptive (that is, water that returns to the local basin) portion of licensed allocations (for example, waste water).31
26 It was assumed that the risk of water shortage would deter new entrants.
27 Alberta Environment. Current and Future Water Use in Alberta. Consultant report prepared by AMEC Earth & Environmental Services for Alberta Environment. Accessed December 7, 2007 http://www.waterforlife.gov.ab.ca/watershed/current-future_water_use.html (Edmonton, 2007). 28 Senior licensees are those who applied at an earlier point in time than junior licensees.
29 Within a district, water access is linked to land ownership, and water transfers within a district may only occur via the transfer of “assessed acres” between one farm and another.
30 Nicol et al. (2008) report that concern for water availability during times of drought is stated by irrigators as a key reason for adopting improved irrigation technologies and management practices.
31 Alberta Water Council. What we’ve learned about Water Conservation, Efficiency and Productivity Sector Planning. Draft Version 3, March 10. Accessed April 21, 2010 http://www.albertawatercouncil.ca/Projects/WaterConservationEfficiencyandProductivity/tabid/115/Default.aspx (2010).
Technically, those holding water
licences with an earlier date are
able to obtain their full licensed
volume (subject to licence terms
and conditions) before the next in
order is granted access. In practice
however, unless there is a water
shortage, licence holders of
various levels of seniority will
be simultaneously drawing from
the same source.
Policy Barriers
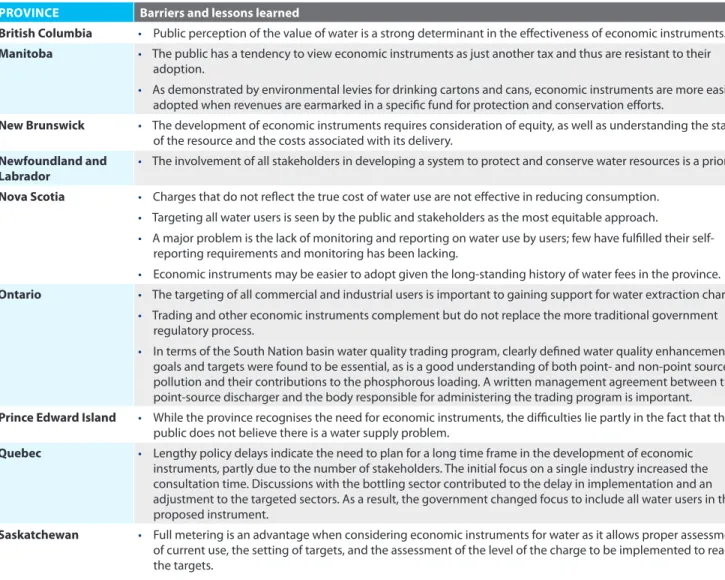
Economic instruments to manage water quantity and quality have been implemented to a limited degree in Canada. A study carried out by consultants analysed the status of economic instruments at the provincial level, including a description of barriers and lessons learned (Table 1). Key challenges include public perception, administrative capacity and transparency.
Table 1 Select barriers and lessons learned for economic instruments applied to water management (2005)
PROVINCE Barriers and lessons learned
British Columbia • Public perception of the value of water is a strong determinant in the effectiveness of economic instruments.
Manitoba • The public has a tendency to view economic instruments as just another tax and thus are resistant to their adoption.
• As demonstrated by environmental levies for drinking cartons and cans, economic instruments are more easily
adopted when revenues are earmarked in a specific fund for protection and conservation efforts.
New Brunswick • The development of economic instruments requires consideration of equity, as well as understanding the state of the resource and the costs associated with its delivery.
Newfoundland and
Labrador • The involvement of all stakeholders in developing a system to protect and conserve water resources is a priority. Nova Scotia • Charges that do not reflect the true cost of water use are not effective in reducing consumption.
• Targeting all water users is seen by the public and stakeholders as the most equitable approach.
• A major problem is the lack of monitoring and reporting on water use by users; few have fulfilled their
self-reporting requirements and monitoring has been lacking.
• Economic instruments may be easier to adopt given the long-standing history of water fees in the province.
Ontario • The targeting of all commercial and industrial users is important to gaining support for water extraction charges.
• Trading and other economic instruments complement but do not replace the more traditional government
regulatory process.
• In terms of the South Nation basin water quality trading program, clearly defined water quality enhancement
goals and targets were found to be essential, as is a good understanding of both point- and non-point sources of pollution and their contributions to the phosphorous loading. A written management agreement between the point-source discharger and the body responsible for administering the trading program is important.
Prince Edward Island • While the province recognises the need for economic instruments, the difficulties lie partly in the fact that the public does not believe there is a water supply problem.
Quebec • Lengthy policy delays indicate the need to plan for a long time frame in the development of economic instruments, partly due to the number of stakeholders. The initial focus on a single industry increased the consultation time. Discussions with the bottling sector contributed to the delay in implementation and an adjustment to the targeted sectors. As a result, the government changed focus to include all water users in the proposed instrument.
Saskatchewan • Full metering is an advantage when considering economic instruments for water as it allows proper assessment of current use, the setting of targets, and the assessment of the level of the charge to be implemented to reach the targets.
Source: Adapted from Marbek Resource Consultants and Renzetti32
32 Alberta was not included in the case studies. See: Marbek Resource Consultants and Renzetti, S. Analysis of Economic Instruments for Water Conservation. Submitted to Canadian Council of Ministers of the Environment, Water Conservation and Economics Task Group. http://www.ccme. ca/assets/pdf/ei_marbek_final_rpt_e.pdf (2005).
It is important to note that there are fewer resources at the municipal level to engage in time-intensive water management activities such as conservation planning, suggesting a role for the provincial and territorial governments in designing pricing templates, supporting data collection and conducting research.
Implications for Policy-Makers
This Brief is an overview of the limited Canadian experience using economic instruments to manage water. It reviews the theory of water pricing as well as permits and trading schemes in the contexts of water basins and urban supply management. Sustainable Prosperity believes that the following conclusions are of direct relevance to policy-makers engaged in the development of water policy in Canada:
1. Canada has ample water supplies when compared to most other countries, yet is not
without water scarcity in some regions. Water pollution is also an issue in areas with heavy industrial, agricultural or other human activities. There are opportunities for greater water conservation and water-quality protection coupled with economic gains from using economic instruments for water management. Pollution and increasing water demand mean that efficient water management will become increasingly important.
2. Two key challenges to implementing economic instruments for water management in
Canada are: i) gaining political and stakeholder support to decide how to best share scarce water resources, and determine water quality thresholds, and, ii) the lack of experience with, and lack of political will to implement, economic instruments and complimentary regulations for water management.
3. Different economic instruments are appropriate in different contexts. Pricing instruments
are practical for urban water management, whereas water basin management tends to favour a coupled approach of trading and pricing. Careful design is also necessary to ensure that any pricing or trading schemes meets both environmental and economic objectives.
4. There is a wide scope in urban areas for using water meters, and full-cost and peak
summer pricing to better manage demand and cover municipal infrastructure expenses.
5. Given lack of resources and capacity at the municipal level to engage in water
management activities such as conservation planning, there may be a role for the provincial and territorial governments in designing pricing templates, supporting data collection and conducting research.