© 2009. Scientific Certification Systems, Inc.
Life Cycle Impact Assessment (LCIA)
of Renewable Electrical Generation Technologies
Compared to the WECC Baseline
Conducted in accordance with ISO 14044 LCIA Framework
and the Draft SCS-002/ANSI Life Cycle Metrics Standard,
“Type III Life-Cycle Impact Profile Declarations
for Materials, Products, Services and Systems”
Prepared for the Western Area Power Administration and
Tri-State Generation and Transmission Association, Inc.
March 2009
2200 Powell Street, Suite 725 Emeryville, CA 94608
510-452-8000
PROJECT AUTHORS/CONTRIBUTORS
Stanley Rhodes, Ph.D. — Project Manager, Senior LCSEA Practitioner Fjalar Kommonen — Senior LCSEA Practitioner and Modeler
Chet Chaffee, Ph.D. — Senior LCA Practitioner Linda Brown — Senior Editor and Project Support
Neil Thomas — GIS Specialist
S. Clayton Palmer – Environmental Economist Bill Karsell -- Biologist
Renewable Electrical Generation Technologies Compared to WECC Baseline —
Final LCIA Report
T-1
Main Report
Life Cycle Impact Assessment of
Renewable Elcctrical Generation
Technologies Compared to the
WECC Baseline
TABLE OF CONTENTS
Executive Summary ...i
Terms and Definitions ... vi
Section 1. Study Overview 1.1. Study Background...1-1 . 1.2. Study Goals...1-1
. 1.3. Scope of Work ...1-1 . 1.4. Limitations ...1-2
Section 2. Overview of LCSEA
Framework 2.1. Historical Perspective...2-1 2.2. LCSEA Methodology and Metrics ...2-2
2.2.1. Classification Protocols ...2-3 2.2.2. Characterization Protocols...2-3 2.3. Steps for Conducting Assessments ...2-4
2.3.1. Determination of Scope/Boundary Conditions...2-4 2.3.2. Life Cycle Inventory Analysis...2-5 2.3.3. Life Cycle Impact Assessment ...2-5 2.4. Impact Groups, Impact Categories & Category
Indicators ...2-6
Section 3. Study
Conventions, Assumptions
and Considerations
3.1. LCI Conventions and Assumptions ...3-1 3.1.1. Raw Materials...3-1 3.1.2. By-Products ...3-1 3.1.3. Fuel Inputs and Outputs...3-1 3.1.4. Emissions to Air ...3-2 3.1.5. Emissions to Water ...3-2 3.1.6. Solid Wastes ...3-2 3.1.7. Line Losses ...3-2 3.2. Site-Dependent Factors Used to Calculate RegionalEmissions...3-2 3.2.1. Regional Acidification Loading Assumptions...3-2 3.2.2. Ground Level Ozone...3-6 3.2.3. Particulate Loading ...3-11 3.2.4. Chronic Hazardous Chemical Loadings ...3-15
Renewable Electrical Generation Technologies Compared to WECC Baseline —
Final LCIA Report
T-2
Section 4. 4.1. Project Description and Background ...4-1
The WECC (US) 4.1.1. Project Description ...4-1
LCIA Baseline 4.1.2. Project Background ...4-1 4.2. WECC Regional Power Baseline...4-1 4.2.1. General Description ...4-1 4.2.2. Sub-NERC Regional Baselines ...4-2 4.2.3. Scope of WECC Baseline Assessment ...4-3 4.3. WECC Baseline Power Mix ...4-4 4.4. Data Sources ...4-4 4.4.1. Primary Data Sources ...4-4 4.4.2. Additional Data Sources ...4-6 4.4.3. Upstream Unit Processes ...4-6 4.5. Key Project Assumptions and Considerations...4-6
4.5.1. Characterization of Receiving Environments
for Emissions Category Indicators ...4-7 4.5.2. Water Resource Depletion...4-7 4.5.3. Key Species Indicator ...4-8 4.5.5. Characterization of Wastes ...4-8 4.5.5. Characterization of Coal Assay to Determine Material Use...4-8 4.5.6. LCIA Data for Nuclear Power Systems...4-8 4.6. Summary LCI Results...4-9 4.7. Landscape Disruption Group — Habitats Disrupted ...4-10 4.8. LCSEA Results ...4-11 4.9. Summary of Results and Discussion...4-12 4.9.1. WECC Baseline ...4-12
Section 5. 5.1. Project Description and Background ...5-1
Stateline 300MW Wind 5.1.1. Project Description ...5-1
Generation System 5.1.2. Project Background ...5-1 5.1.3. Specific Issues Surrounding Functional
Equivalency and System Boundaries...5-2 5.2. Stateline Power Generation System Description ...5-3
5.2.1. System Boundaries, Scoping and Specific
Unit Processes...5-3 5.2.2. Functional Unit ...5-4 5.3. Baseline Case ...5-4 5.4. Integrating Wind into Regional Power Pool System ...5-4 5.5. Data Sources ...5-5
5.5.1. Materials and Energy Used in Wind Farm
Construction, Operations and Maintenance...5-5 5.5.2. Direct Physical Disruption Associated with
the Wind Farm ...5-6 5.5.3. Direct Physical Disruption Associated with
Back-Up Power (Scenario 2) ...5-7 5.6. Key Assumptions ...5-8 5.6.1. Windforce Analysis ...5-8 5.6.2. Back-Up Units in Scenario 2 ...5-8 5.6.3. Amount of Back-Up Power Required for
Scenario 2 ...5-8 5.6.4. Assumptions Related to Wind Farm Material
and Energy Inputs ...5-10 5.6.5. Habitat Disruption Assumptions...5-12
Final LCIA Report
T-3
5.6.6. Natural Gas Back-Up Power Assumptions...5-13 5.7. Summary LCI Results...5-13 5.8. LCSEA Results ...5-14 5.9. Discussion of Results...5-19 5.9.1. Proper Scoping...5-19 5.9.2. Wind System with No Added Back-Up
Power (Scenario 1) ...5-20 5.9.3. 85% Wind Power / 15% Natural Gas Back-Up Power (Scenario 2) ...5-21
5.10. Differences in Scenarios’ Performance ...5-21
Section 6. 6.1. Project Description and Background ...6-1
Glen Canyon Hydropower 6.1.1. Project Description ...6-1
Generation System 6.1.2. Project Background ...6-1 6.2. Power Generation System Description ...6-3
6.2.1. System Boundaries, Scoping and Specific
Unit Processes...6-3 6.2.2. Plant Location...6-5 6.2.3. Construction...6-6 6.2.4. Operations and Maintenance ...6-6 6.2.5. Power Transmission...6-8 6.2.6. Function and Functional Unit ...6-9 6.3. Baseline Case ...6-9 6.4. Data Sources and Data Quality ...6-10
6.4.1. Data Sources ...6-10 6.4.2. Data Quality...6-10 6.5. Key Assumptions and Scoping Considerations ...6-10 6.5.1. Allocation of Impacts ...6-10 6.5.2. LCI Model Assumptions...6-12 6.5.3. Biophysical Impact Focus...6-12 6.5.4. Drought Related Impacts ...6-13 6.5.5. Water Resource Depletion...6-14 6.5.6. Uncertainty Surrounding Causes of Observed
Adverse Impacts ...6-16 6.5.7. Creation of Habitat ...6-16 6.5.8. Auxiliary Power to Augment Post-ROD
Power Generation...6-17 6.6. Habitat Disruption and Effects on Species – Gross
Impacts Allocation Case ...6-17 6.6.1. Habitat Disruption to Areas Occupied by
Facilities...6-17 6.6.2. Habitat Disruption Due to Glen Canyon
Project Operations ...6-18 6.6.3. Glen Canyon – Effects on Key Species...6-30 6.7. Habitat Disruption and Effects on Species –
Hydropower Function Case ...6-33 6.7.1. Riparian/Wetland Habitat Disruption ...6-33 6.7.2. Loss of Key Species: Humpback Chub ...6-33 6.8. Summary LCI Results...6-34 6.9. LCSEA Results ...6-35 6.10. Discussion of Results...6-39 6.10.1. Energy Resource Depletion ...6-40 6.10.2. Water Resource Depletion...6-40
Final LCIA Report
T-4
6.10.3. Terrestrial Habitat Disruption...6-40 6.10.4. Riverine Habitat Disruption...6-40 6.10.5. Riparian/Wetland Habitat Disruption. ...6-41 6.10.6. Key Species Loss...6-41 6.10.7. Accumulated GHG Radiative Forcing and
Oceanic Acidification Loadings ...6-42 6.10.8. Regional Air Emission Impact Categories ...6-42 6.10.9. Eco-toxic Chemical Loading and Radioactive Wastes...6-42 6.11. Next Steps ...6-43 6.11.1. Impact Allocation ...6-43 6.11.2. Riparian and Aquatic (Lake) Habitat...6-43 6.11.3. System Assessment...6-43
Supplemental Report
Life Cycle Impact Assessment
Methodology Applied To
Thermal Generation Technologies
Compared to the WECC
Baseline: A Conceptual
Demonstration
Description of Supplemental Report………. S-i
Section 7. 7.1. Project Description and Background ...7-1
Project #2: Colstrip Coal 7.1.1. Project Description ...7-1
Power Generation System 7.1.2. Project Background ...7-1 7.2. Colstrip Power Generation System Description ...7-2 7.2.1. Colstrip Station Power Plant...7-2 7.2.2. Coal Assay, Mining and Transport...7-3 7.2.3. Transmission...7-4 7.3. Baseline Case: The WECC Regional Power Pool ...7-4 7.4. Data Sources ...7-4 7.4.1. Colstrip Station ...7-4 7.4.2. Rosebud Mine...7-4 7.4.3. Additional Emissions Data for Coal Plant
Operations from SCS LCSEA Database...7-4 7.4.4. Ancillary Upstream Unit Processes ...7-5 7.4.5. Dispersion Modeling of Emissions...7-5 7.4.6. Physical Disturbance ...7-5 7.5. Key Assumptions and Considerations ...7-6
7.5.1. Issues Related to Impact Categories with
Human Health Endpoints...7-6 7.5.2. Physical Disruption Issues...7-7 7.5.3. Transmission...7-7 7.6. LCI Results ...7-8 7.7. Habitat and Species Disruption...7-9 7.8. LCSEA Results ...7-9 7.9. Summary of Results and Discussion...7-11
Final LCIA Report
T-5
7.10. Preliminary Environmental Performance Index of
Colstrip ...7-13
Section 8. 8.1. Project Description and Background ...8-1
Project #4:Natural Gas 8.1.1. Project Description ...8-1
Power GenerationSystem 8.1.2. Project Background ...8-1 8.2. Power Generation System Description ...8-1 8.2.1. Unit Processes...8-1 8.2.2. Plant Location...8-2 8.2.3. Differences between NGSC and NGCC
Systems ...8-3 8.3. Baseline Case ...8-3 8.4. Data Sources ...8-3 8.5. Key Assumptions ...8-3 8.5.1. Assumptions Related to Power Plant Modeling ....8-3 8.5.2. Habitat Disruption Assumptions...8-3 8.6. Summary LCI Results...8-4 8.7. LCSEA Results ...8-5 8.8. Discussion of Results...8-8 8.9. Environmental Performance Index ...8-10
Appendices
1. Practitioner Qualifications 2. General Bibliography3. KCL ECO Model: Brief Description
4. Power Plants in the US WECC Power Pool, by State 5. WECC Biomass Electricity Generation Plants in Year 2000 (EGRID02)
6. SCS-002, Annex A 1C (Excerpt from SCS-002)
7. LCIA Climate Metrics: Introduction and Annexes 1A-1C (Excerpt from SCS-002-1)
© 2009. Scientific Certification Systems i
EXECUTIVE SUMMARY
For this report, SCS conducted a life-cycle impact assessments (LCIA) of two renewable electrical technologies: the Glen Canyon Hydropower Station in Arizona and the Stateline Wind Power Generation System on the border of Washington and Oregon. SCS then compared these results to impact levels calculated for the WECC NERC Region. As prescribed in the ISO 14044 Standard and Draft Standard (SCS-002), the study assessed and compared the LCIA results of these renewable electrical generating plants to those of the WECC across the full range of environmental and human health that have been shown to be environmentally relevant to electricity production within the Western region of the United States.
The report contains the following information:
• a description of the Glen Canyon Hydropower System;
• a description of the Stateline Wind Power Generation System; • a description of the WECC regional power pool;
• a description of the data utilized for the assessment; • a discussion of key assumptions;
• a summary of life cycle inventory results;
• a summary of life cycle impact assessment results; and • a discussion of results.
Upon request of WAPA, this report underwent peer review by individuals from Argonne National Laboratory.
The LCIA results from this study are reported in the format specified in the SCS-002 Committee Draft in order to facilitate use of the findings by policy makers and other stakeholders. Two different Life Cycle Impact Declarations are presented for the Glen Canyon Project based on different sets of assumptions that reflect different operating scenarios for the dam. One scenario assumes that the dam is used for multiple functions, from recreation through water storage, flood control and power generation. In this case, the environmental impacts are allocated across functions in compliance with allocation procedures set forth in ISO 14044. In the second case, all environmental impacts resulting from the Glen Canyon project are assigned to a single function, power generation. For the Stateline Wind Power Project a Life Cycle Impact Declaration of the Wind System with No Added Backup power is presented.
Supplemental Report on Thermal Technologies
Included under this document’s cover is a supplemental report. As part of the commission of this study by Western Area Power Administration, SCS gathered data on two thermal electrical generating units; the Colstrip Generating Powerplant in Montana and two generic types of natural gas-fired electrical generators. The detailed data that would be required to perform a Life Cycle Impact Assessment and prepare a Life Cycle Impact Declaration were not available for these two case studies. Instead, publicly
© 2009. Scientific Certification Systems ii available data were used. Where no data existed, SCS substituted data from other sources in order to provide a complete – albeit conceptual data set.
The goals of this supplemental report are (1) to demonstrate how an LCIA method might be used in the case of a thermal generator and (2) to identify problems that might arise in a complete LCIA analysis of power plants similar to those chosen for this demonstration project.
Significant insights have been gained in studying an LCIA method approach to examining the environmental footprint of these two thermal technologies. With these new insights, a complete and cogent LCIA analysis and Life Cycle Impact Declaration could be completed if a complete data set were used.
Significant Findings
1. The WECC has the lowest greenhouse gas loading per 1,000 GWh of any NERC region in the US solely because of the large fraction of hydropower constituting the overall power mix (28 percent).
2. If sited properly, the environmental performance of wind generation facilities is excellent when wind is a small fraction of the total energy available in a power pool. However, performance can degrade significantly with increasing levels of wind energy production. Because wind energy is not dispatchable, at higher levels of wind energy production its environmental performance approaches that of the power used to back it up.
3. Hydropower capacity offers the best backup source to preserve wind power’s environmental performance while allowing higher system penetration levels for wind. 4. The environmental performance of coal-fired power plants vary quite widely, but can
exceed that of even the WECC, depending upon: 1) the assay of coal inputs; 2) the method of mining; 3) the type and efficiency of energy generation; 4) the type of pollution control technologies employed; and 5) the location of the mine and power plant relative to areas of high population density and areas susceptible to exceedance of environmental thresholds.
5. On balance, natural gas-fired combined cycle power plants can perform better than the WECC average, though their performance is sensitive to location. Their energy resource-depletion ratings are worse than the WECC due to the relatively small reserves of natural gas.
6. The LCIA methodology can provide accurate, credible and relevant environmental performance results for all energy production systems studied. The ability to compare environmental performance among energy production alternatives and to a power-pool baseline can be especially useful for decision-makers.
© 2009. Scientific Certification Systems iii 7. Unavailability of detailed proprietary data for power plant operations can be a
significant obstacle to using the LCIA methodology to study those power plants.
Environmental Impact Profiles
Figure 1. Environmental Impact Profile of Glen Canyon Hydropower Generation System, Hydropower Function case, relative to the WECC baseline per 1,000 GWh.
© 2009. Scientific Certification Systems iv Figure 2. Environmental Impact Profile of Glen Canyon Hydropower Generation System, Water
© 2009. Scientific Certification Systems v Figure 3. Environmental Impact Profile of Stateline Wind System, Scenario 1.
© 2009. Scientific Certification Systems vi
TERMS AND DEFINITIONS
I.
Terms and Definitions
Used in This Report
• Baseline —The reference case against which a material, product, service, or
system is compared, where the indicator results represent the typical or predominant material, product, service or system for the sector, a prior version of the same product, service or system, or another identified product, service or system. All environmentally relevant impact categories for the sector must be included in the baseline comparison.
• Biobased Resource — commercial or industrial product (other than food or feed)
that is composed, in whole or in significant part, of biological products or renewable domestic agricultural materials (including plant, animal, and marine materials) or forestry materials.1
• Category Indicator — The selected node for use in reporting the lifecycle impact
assessment (LCIA) result. The indicator is often a quantifiable midpoint node within a given stressor-effect network that is selected to represent the impact category because it can be linked both to the initial stressor value and to the endpoint impact.
• Effect — A measurable, adverse change to human health or the environment. Also
referred to as an “impact” (as in “impact category”)
• Emission Loading – The amount of emissions released into an environment that
deposits into or resides in areas that exceed identified thresholds. This emission loading incorporates relative potency, fate and transport of the emission(s), as well as spatial and temporal characteristics of the identified endpoints.
• Environmental Characterization Factor (ECF) —A mathematical expression
derived from the quantitative characterization of the relative degree to which a particular stressor affects the environment or human health within a specific impact category.
• Environmental Data — Data used to characterize the condition of providing and
receiving environments.
• Environmental Impact Profile (abbreviated as “Impact Profile”) — The
cumulative summary of life-cycle impact assessment (LCIA) category indicator results representing the environmental performance of a material, product, service or systems, adjusted to a specific functional unit.
• Environmental Mechanism — A distinct and measurable physical, chemical,
radiological or biological process(es) that links stressor(s) to effects of human health or the environment.
• Environmentally Preferable — A material, product, service or system that has
lower environmental impacts than the current reference baseline across the life-cycle, without environmental trade-offs in any category indicators.
© 2009. Scientific Certification Systems vii
• Habitat Baseline — The condition of the habitat in a given area prior to the
establishment of the production infrastructure associated with the material, product, service or system.
• Impact — A measurable, adverse change to the human health or the environment.
Also referred to as an effect (as in “stressor-effect network”).
• Impact Category — An issue of environmental or human health concern (e.g.,
climate change, acid rain) that represents a distinct or linked environmental mechanism(s).
• Impact Endpoint — An identifiable impact on the natural environment, human
health or natural resource reserves that can be linked back to a stressor(s) through a defined environmental mechanism. Also referred to simply as “endpoint.”
• Impact Group — Impact categories with common or similar midpoints/endpoints. • Impact Profile – See Environmental Impact Profile.
• Life Cycle Assessment (LCA) — Assessment that in includes determination of
appropriate scope and boundary conditions, a complete life-cycle inventory, and a complete life-cycle impact assessment.
• Life Cycle Impact Profile Declaration (or simply, Life Cycle Impact Declaration)
– A report summarizing the environmental impact profile derived from the use of the LCSEA as referenced in this Standard. There are three types of declarations: 1) basic declaration of impacts; 2) reduced impact declaration; and 3) declarations of environmental preferability.
• LCIA Functional Unit (or simply, functional unit)— A common unit of output
(e.g., 1000 GWh for electricity) to which category indicator results are normalized.
• Life Cycle Impact Assessment (LCIA) — The phase of life cycle assessment that
converts life cycle inventory results (both inputs and outputs) into life cycle category indicator results by calculating the magnitude and environmental relevance of the resultant environmental/human health impacts.
• Life Cycle Inventory (LCI) — The phase of life cycle assessment involving the
identification, compilation and quantification of inputs and outputs associated with a given material, product, service or system throughout its life cycle.
• Midpoint Node —Any distinct, measurable intermediate chemical or biological or
physical process along the stressor-effect network between the stressor point (e.g., emission, extraction) and the endpoint.
• Node — Any chemical or biological or physical process along a stressor-effect
network model of an environmental mechanism.
• Providing environment — The natural resource reserves from which resources are
extracted.
• Receiving environment — The air, water, soil, and habitats into which emissions
are deposited or in which they reside.
• Reserve base — The quantification of the natural repositories of a given natural
resource that is economically or technically recoverable.
• Resource depletion factor (RDF) — The characterization factor that reflects the
rate of resource depletion against its reserve base.
• Stressor — Any input, output, and direct physical disruption activity associated
© 2009. Scientific Certification Systems viii
• Stressor Characterization Factor (SCF) — A mathematical expression used to
aggregate related stressors based on their relative potency with respect to a specific impact category.
• Stressor-Effect Network — A model used to represent an environmental
mechanism, in which a chain of events are shown to link the inputs, outputs, and direct physical disruption activities associated with a material, product, service or system to impact endpoints. Also referred to as “impact chains” or “impact-effects networks.”
• Threshold — An environmental condition that, when exceeded, is linked to
adverse environmental or human health effects
• Unit operations – Distinct processes associated with industrial process associated
a material, product, service or system across the scope of the assessment.
II. Abbreviations Used in This Report
Ac acre
Asl Above sea level
BPA Bonneville Power Administration
Bq Becquerel (a measure of radioactivity, where 1 Bq equals 1 disintegration per second (compared to 1 curie = 3.7 x 10¹⁰ disintegrations per second). CANDU Canada Deuterium Uranium (heavy water reactor technology)
CEA Canadian Electricity Association CRSP Colorado River Storage Project
ECF Environmental Characterization Factor
EGRID Emissions & Generation Resource Integrated Database EIA Energy Information Administration
EPI Environmental Performance Index
Eq. Equivalent
GCMRC Grand Canyon Monitoring and Research Center GWh Gigawatt Hour (=1,000,000 kilowatt hours)
GWP Global Warming Potential
GLO Ground Level Ozone
Ha. Hectare
HEC Human Exposure Coefficient
HEF Human Exposure Factor
HF Hydrofluoric Acid
HRC Human Reference Concentration
HWR Heavy Water Reactor
IGCC Integrated Gasification Combined Cycle
ISO International Organization for Standardization; also, Independent System Operator
Kg Kilogram
LCA Life Cycle Assessment
LCI Life Cycle Inventory Analysis LCIA Life Cycle Impact Assessment
© 2009. Scientific Certification Systems ix
LWR Light water reactor
LBWR Light boiler water reactor
MAF Million acre-feet
MWh Megawatt hour
NAAQS National Ambient Air Quality Standards NAAIB North American Association of Issuing Bodies NERC North American Electric Reliability Council NOAEL No Observed Adverse Effects Limit
NOx Nitrogen Oxides
NRC Nuclear Regulatory Commission
NPRI National Pollutant Release Inventory (Canada)
ODP Ozone Depletion Potential
ODS Stratospheric Ozone Depleting Substances
PM Particulate Matter
RAINS Regional Air Pollution Information and Simulation model RCRA Resource Conservation and Recovery Act
RDF Resource Depletion Factor
RfC Human Reference Concentration
RfD Human Reference Dose
RIVM Rijksinstituut Voor Volksgezondheid en Milieu (National Institute of Public Health and the Environment), Coordination Center for Effects2
ROW Right of Way
RNP Renewable Northwest Power
RPP Regional Power Pool
RTO Regional Transmission Organization
SARA Superfund Amendments and Reauthorization Act
SCF Stressor Characterization Factor SCS Scientific Certification Systems, Inc.
SOx Sulfur Oxides
Sv Sieverts
t Tonne (metric)
TBq Tera Becquerel (1 Bq x 1012)
TCDD Tetrachlorodibenzodioxin
TCLP Toxicity Characteristic Leachate Procedure TRI Toxic Release Inventory (USA)
WECC Western Electricity Coordinating Council
2 The CCE is the Data Center of theInternational Cooperative Programme on Modeling and Mapping of Critical Levels and Loads and Air Pollution Effects, Risks and Trends (ICP Modeling and Mapping, ICP M&M) and supports the work of the Convention on Long-range Transboundary Air Pollution (LRTAP) of the United Nations Economic Commission for Europe (UNECE).
© 2009. Scientific Certification Systems, Inc. Page 1-1
Section 1.
STUDY OVERVIEW
1.1. Study Background
In 2002, the Western Area Power Administration (Western) contracted Scientific Certification Systems (SCS) to demonstrate the use of Life-Cycle Stressor Effects Assessment (LCSEA), a site-dependent life-cycle impact assessment (LCIA) approach,as a tool for establishing the environmental impact profiles of electric power generation systems in the western U.S. The study now consists of two reports. The first is an LCIA case study of two renewable electrical productions facilities: the Glen Canyon Hydropower System and the Stateline Wind Power Station. In a supplemental report, the concept of an LCIA approach, using publicly identifiable data and surrogate data, is applied to two thermal power plants: Colstrip Coal Power System and two natural gas-fired technologies. The latter analyses were completed as a demonstration of what the opportunities and difficulties of applying this approach to thermal units.
During the course of the project, Tri-State joined Western as an additional interested party and study sponsor.
1.2. Study Goals
The goals of this renewable energy study were as follows:
• to demonstrate the use of the LCSEA methodology in establishing the
environmental impact profile of selected electric power generation systems;
• to establish the impact profile of the WECC regional power pool to be used as a
baseline against which the impact profiles of specific power generation systems can be measured and scaled (environmental efficiency analysis);
• to establish the Life-Cycle Impact Profile of the Glen Canyon Hydropower
System as compared to the WECC regional power pool;
• to establish the Life-Cycle Impact Profile of the Stateline Wind Power System
as compared to the WECC regional power pool;
• to demonstrate the degree to which the results of such a study can be used to
support informed science-based energy policy discussions, to guide energy company decision-making and investments, and to support energy purchasing.
1.3. Scope of Work
© 2009. Scientific Certification Systems, Inc. Page 1-2 • Establish the WECC (US) Impact Profile Baseline
The WECC regional power pool consists of a wide diversity of power types, and extends over a vast section of the western US and Canada. In this study, the assessment was confined to power generation in the eleven US states included in the WECC.
• Determine the Impact Profile of a sample of renewable electrical energy generations systems: a Hydroelectric Generation System and a Wind Power Generation System
This project involved the establishment of the Life-Cycle Impact – LCIA study and a Life Cycle Declaration of the Glen Canyon Dam hydroelectric power generation system in the state of Arizona. Additionally, a Life-Cycle Impact study – LCIA was completed for the Stateline Wind Power generation system on the boarder of Washington and Oregon. No Life-cycle Declaration was made for this generation system.
The scope of assessment under LCSEA is cradle-to-grave, consistent with internationally recognized life-cycle assessment principles. For electric power generation systems, this scope typically includes: energy resource (and ancillary resource) extraction, raw material transport, fuel processing, fuel transport, power plant construction and operations, power transmission and distribution, waste disposal and treatment, and power plant decommissioning (Figure 1.1).
Figure 1.1. Simplified schematic of the life cycle of an electric power generation system
1.4. Limitations
The following limitations in scope should be noted:
• The study did not address end-of-life issues (e.g., decommissioning of plants)
associated with the electric power generation systems examined, even though this is within the normal scope of LCSEA, except as otherwise noted.
© 2009. Scientific Certification Systems, Inc. Page 1-3
• The study did not address one-time or non-recurring accidental releases from
any of the electric power generation systems.
• The study addressed power quality or reliability concerns only to a limited
degree, and did not address the security of the electric power generation systems examined.
• The study did not address possible worker safety concerns associated with
electric power generation systems examined.
• The study did not calculate environmental category indicators associated with
noise, visual impact, or aesthetics.
In terms of the assessments conducted, the study was limited in two additional respects: 1) certain inventory data and environmental characterization data were unavailable or unattainable by SCS within the agreed-upon budgets and timelines; and 2) while the study sought to demonstrate the methodology using certain baseline cases for comparison, other baseline cases might have been selected and thereby provided additional insights into the study findings.
© 2009. Scientific Certification Systems, Inc. Page 2-1
Section 2.
OVERVIEW OF LCSEA FRAMEWORK
2.1. Historical Perspective
The field of life-cycle assessment first began development in the 1960s in response to fuel and energy shortages. By the 1970s, analytical methods were proposed to conduct an analysis of fuel and raw material uses in the energy sector and in various industrial systems. These analyses were first referred to as Resource and Environmental Profile Analyses (REPA). In the late 1970s, the seminal text on conducting REPAs was published by Boustead and Hancock (1979) entitled Handbook of Industrial Energy Analysis. Between 1979 and 1990, additional environmental factors were added to REPAs, such as air emissions, water effluents, and solid wastes. REPA studies were considered to be useful inventories of the environmental inputs and outputs of industrial systems, and as such, were described as “Life Cycle Inventories” (LCI). Starting in the late 1980s and early 1990s, a number of software tools were developed to help interested companies conduct LCIs for their own industrial systems.
In 1990, the Society of Environmental Toxicology and Chemistry (SETAC) sponsored a conference in Vermont (USA), at which the term “Life Cycle Assessment” was used to describe studies in which factors associated with each life-cycle phase, including raw material use, energy use, emissions to air and water, and solid wastes were reviewed for an entire industrial system. In the Vermont conference, participants described Life Cycle Assessment (LCA) as having three parts: a) the Life Cycle Inventory (LCI), b) Life Cycle Interpretation, and c) Life Cycle Improvement. During this time, discussions among LCA practitioners focused on identifying better ways to use LCA for environmental decision-making purposes. The need for a methodology capable of linking system inputs and outputs to environmental effects thus became apparent, leading to the development of life-cycle impact assessment (LCIA) from what was originally called life cycle interpretation, and ultimately, to the publication of an international standard (ISO-14044) in 2000.3
ISO-14044 was the product of six years of negotiation among delegates representing more than 100 countries. This standard established a common framework whereby the LCI results could be further classified and characterized in order to determine their relative impacts on the environment, then aggregated into a set of environmentally relevant impact category indicators. The main objective was to convert the LCI data into environmentally relevant category indicator results. The ISO 14044 standard is a
3 ISO-14042 was drafted under the auspices of the ISO Technical Committee on Environmental Management (TC-207). A number of collaborative publications contributed toward the development of the LCIA standard. Among the most prominent of these were the Nordic Guidelines on Life-Cycle Assessment (1995), including the LCA-Nordic Technical Reports 1-10, and the Society for Environmental Toxicology and Chemistry (SETAC) publications A Conceptual Framework for Life-Cycle Impact Assessment (1993) and Towards a Methodology for Life-Cycle Impact Assessment (1996).
© 2009. Scientific Certification Systems, Inc. Page 2-2 guidance standard that provides the basic methodological requirements to conduct scoping, the LCI and LCIA phases. At the center of the LCIA guidance is the establishment of the LCIA framework, which requires that impact categories be established in accordance with their identified environmental mechanisms. Such environmental mechanisms are the biophysical impact pathways (stressors, potentials, midpoints, and endpoints) related to the inputs and outputs inventoried during the LCI phase, as well as any biophysical impacts that have identified midpoints/endpoints. In 1995, the LCSEA methodology was among the first LCIA approaches to formally integrate LCI results with environmental impact assessment (EIA), environmental impact statements (EIS) and other standard environmental impact data sets. The outcome of this development was to transition LCIA modeling from a site-generic approach to a more site-dependent methodology.
Site-dependent LCIA methods for calculating category indicators, especially those associated with regional and local emissions, have continued to be refined, particularly by governments in Europe. The Danish Guideline for LCA, the Nordic Guideline for LCA and others have contributed by integrating dispersion modeling data into an LCIA framework. The United Nations Environment Programme (UNEP) has established a working group to codify LCA practice based on the existing advanced models, including the Danish and Nordic guidelines, and the SCS LCSEA methodology. The European Union (EU) is planning to adopt the UNEP model once it has been codified.
2.2. LCSEA Methodology and Metrics
In LCSEA, the physical, chemical or biological environmental mechanisms that link an industrial input, output or activity (i.e., the “stressor”) to an observable impact (i.e., the “effect”) are modeled as “stressor-effect networks” (Figure 2.1). The environmental mechanisms used in this model include effects on ecosystems, effects on human health, and the net depletion or accretion of natural resources. LCSEA calculations involve the collection, analysis and integration of two types of data: 1) inventory data (i.e., the energy system’s land use, resource and energy inputs, environmental releases and wastes that act as potential stressors), and 2) characterization data that put these inventory data into the perspective with respect to various environmental impacts.4
Consistent with standard LCIA practice, the LCSEA methodology contains formal protocols for classification of inventory results and characterization of these results with regard to their respective impacts.
4 Like all LCIA models, LCSEA is a data integration methodology focused on collecting and analyzing a variety of existing data resources rather than on conducting traditional EIA research.
© 2009. Scientific Certification Systems, Inc. Page 2-3 Figure 2.1. Example of a Stressor-Effect Network
2.2.1. Classification Protocols
To start, impact categories are identified that represent distinct stressor-effects networks with defined nodes (Figure 2.1). For each impact category, a category indicator is selected that is representative of a distinct node along the stressor-effect network. “Core” impact categories are then distinguished from categories that are not relevant to a specific region, as described in SCS-002 (Appendix 6). Aggregation of stressor-effect networks with unrelated nodes is not permitted.
Inventory data are then assigned to one or more relevant category indicators. Any inventory data that cannot be assigned to a category indicator must be identified in the inventory, but may be excluded from the final indicator results if sufficient justification is provided.
2.2.2. Characterization Protocols
All category indicators must be characterized using spatial and temporal parameters. Stressor characterization factors (SCFs) and environmental characterization factors (ECFs) or their equivalent must be established before an indicator calculation can be conducted. SCFs characterize the relative potency of various stressors contributing to the same environmental effect. The relative scale used for the SCF is based upon known chemical, biological or physical parameters that are both reproducible and
© 2009. Scientific Certification Systems, Inc. Page 2-4 peer reviewed. ECFs characterize the fate and transport of the stressors, including threshold analysis and integration of the relative severity, duration, and reversibility of the measured effect. Threshold analysis involves determining whether a given effect has crossed a defined threshold. To establish an effects threshold, a scientific consensus must exist regarding the threshold level. The relative scale used for the ECF is 0-1. Further discussions of SCFs and ECFs by indicator are found in Section 3 and in Appendix 6.
Meeting the Requirements of Comparative Assertion
LCSEA metrics meet the requirements of the ISO 14044 LCIA framework and the SCS-002 Committee Draft for making “comparative assertions”. In this case, Glen Canyon Hydropower Station impact levels (i.e., environmental performance) are compared to the averaged impact levels of the combined power mix that makes up power production of the WECC NERC region. The environmental relevance of the selected impact group, impact categories and related category indicators must be demonstrated in order to be included as a measure of environmental performance.
In this study, the two renewable electrical power systems were compared to the WECC baseline. Consistent with the comparative assertion requirements of ISO 14044 and the SCS-002 Committee Draft, all environmentally relevant impact categories were identified and corresponding category indicator results calculated for both Glen Canyon and Stateline as well for power systems making up the WECC. Whereas standard LCA models do not address the key habitat and species issues that have long been the center of environmental attention of multiple stakeholders concerned about hydropower and wind power projects, LCSEA metrics have been specifically designed to address the complexity and degree of ecological disturbance (impacts on riverine, wetlands, terrestrial, lake and riparian habitats, and loss of key species) associated with power generation systems. LCA studies that have not addressed these key issues have been considered misleading or of little use in making comparisons between fossil generation systems and hydropower and wind generation systems. By addressing the key habitat and species issues in a standard way for all power generation systems, LCSEA metrics provide a more robust comparison between power systems to allow the inherent strengths of each generation technology to be reviewed with greater credibility.
2.3. Steps for Conducting Assessments
The steps for conducting assessments of electric power generation systems consistent with the SCS-002 Committee Draft are summarized below.
2.3.1. Determination of Scope and Boundary Conditions
All projects begin by setting boundary conditions and establishing the scope of a project.
© 2009. Scientific Certification Systems, Inc. Page 2-5
• All relevant unit processes are identified for the electric power generation
system, and for the baseline against which the system is to be compared.
• Study boundaries are delineated, incorporating relevant spatial (i.e.,
geographic) and temporal conditions.
• The functional unit is determined for the electric power generation system and
for the baseline against which the system is to be compared. Typically, this functional unit is 1,000 gigawatt-hours. Additionally, any line losses due to transmission distance are factored into the LCIA calculations.
• Scoping must account for spinning or other reserves that are necessary due to
intermittency of a particular generation source (e.g., wind, solar) or FERC-mandated minimum flow requirements (i.e., hydro), or any other changes to specific power generation systems that could alter the power mix in the regional power pool.
2.3.2. Life Cycle Inventory Analysis
After setting the boundary conditions and scope of the study, a life cycle inventory is conducted.
• Data related to system inputs and outputs for each unit process are collected.
(Only those data that are relevant to the calculation of category indicator results related to active impact categories are required.)
• Inputs and outputs are calculated by unit process. For this study, SCS used the
KCL-ECO LCI model (see Appendix 3).
• Appropriate spatial and temporal characterization is conducted to ensure that
unit process data are not improperly aggregated.
2.3.3. Life Cycle Impact Assessment
Once the LCI is completed, the LCIA or impact assessment phase of a project is begun.
• Defining Stressor-Effects Networks — Stressor-effects networks are
identified and properly described before use in calculating category indicator results related to the electric power generation system and the regional baseline under study. Measurable nodes (usually a midpoint node along the stressor-effect network) are identified based on the strength of their linkages to the stressor and the impact endpoint. The node with the strongest link to both the stressor and the impact endpoint is identified as the category indicator for the stressor-effect network. The name of the category indicator reflects the midpoint node or impact endpoint selected.
• Classification — Inventory data are assigned to impact categories in
© 2009. Scientific Certification Systems, Inc. Page 2-6
• Characterization — Environmental data are collected for use in
characterizing the classified inventory data.5 These data are integrated into the calculation of characterization factors on a site-specific or site-dependent basis where regional and local effects are an issue, taking into account the following considerations:
- the current state (i.e., degree of stress) of the receiving or providing environment at the midpoint node or impact endpoint;
- the spatial attributes, such as geographic area and scale of the respective receiving/providing environments.
- the temporal aspects, such as duration, residence time, persistence, timing, and the reversibility of the environmental mechanism.
• Inventory data are characterized.
• Data are also collected to account for any impacts to habitats or key species
resulting from direct physical disruption of terrestrial, aquatic, or riparian habitats.
• Aggregation — Once the classified inventory data are characterized by unit
process, these data are aggregated to calculate the category indicator results.6
• Environmental Impact Profile — Together, these indicator results form the
Environmental Impact Profile. Sensitivity analyses are conducted as needed to confirm results.
• Life Cycle Impact Declaration — The impact profile of a given power
generation system is compared to the impact profile of a baseline case on an indicator-by-indicator basis to generate the Life Cycle Impact Declaration.
2.4. Impact Groups, Impact Categories and Category Indicators
As noted above, according to ISO 14044 and the SCS-002 Committee Draft, all impact categories must first be reviewed for their environmental relevance to the sector represented by the material, product, service or system. Table 2.1 provides the list of all impact categories that must be reviewed. To exclude any of these impact categories, a justification must be provided that illustrates why the category is not relevant to the study. Similarly, additional impact categories may be considered if justification can be provided that they are required based on characterization of active midpoints. SCS-002 Annex A, included here as Appendix 6, provides the required algorithms, specific assumptions, data requirements, characterization models and background information related to each group, impact category and category indicators.
Within the scope of this study, those impact categories and category indicators in the final column of Table 2.1 were found to be environmentally relevant. The process for
5 Environmental data may come from a variety of sources, including governmental, academic, industry and stakeholder publications, as well as privately held databases. Examples of data sources related to energy resource depletion include environmental impact assessments (EIA), the US Geological Survey, National Energy Board (NEB) of Canada, World Energy Institute, and British Petroleum. Examples of data sources related to the direct physical disruption indicators include Federal Energy Relicensing Commission (FERC) reports and LANDSAT data. Examples of data sources related to emission loadings include US Environmental Protection Agency Toxic Release Inventory (TRI) data, monitoring records, and sampling records.
6 Data aggregation under an impact indicator takes place only if such aggregation does not reduce the overall accuracy of the indicator result.
© 2009. Scientific Certification Systems, Inc. Page 2-7 determining environmental relevance followed protocols is described in Appendix 6. Justification for the exclusion of impact categories is provided in Appendix 7.
Table 2.1. LCSEA Impact Groups, Categories and Category Indicators
LCSEA Impact Groups and Category Indicators Required Node for
Category Indicator Core Impact Categories for this study, based on environmental relevance Abiotic/Biotic Resource Depletion Group
Non-renewable Energy Resource Depletion Midpoint Node 2 Core
Water Resources Depletion Midpoint Node 2 Core
Biobased Resource Depletion Midpoint Node 2 Strategic Metals Resource Depletion Midpoint Node 2
Landscape Disruption Group
Terrestrial Habitat Disruption Midpoint Node 2 Core Aquatic (Lake) Habitat Disruption Midpoint Node 2
Aquatic (River) Habitat Disruption Midpoint Node 2 Core Riparian/Wetland Habitat Disruption Midpoint Node 2 Core
Loss of Key Species Midpoint Node 3 Core
Climate Change Emissions Group
Accumulated GHG Radiative Force Loading7 Midpoint Node 4 Core Radiative Force Loading
- - Well-Mixed Greenhouse Gases
- - Tropospheric Ozone8
- - Soot (Carbon Black)9
Midpoint Node 3
Aerosol Force Cooling10 Midpoint Node 3
Environmental Effects Emissions Group11
Acidification Loading (Oceanic) Midpoint Node 3 Core Acidification Loading (Regional) Midpoint Node 3 Core Stratospheric Ozone Depleting Chemical Loading Midpoint Node 2
Ecotoxic Chemical Loading Midpoint Node 2 Core
Eutrophication Loading (Regional) Midpoint Node 2
Human Health Effects Emissions Group
Ground Level Ozone Exposures Midpoint Node 3 Core Particulate (PM 2.5 equivalent) Exposures Midpoint Node 3 Core Pulmonary Toxic Chemical Exposures Midpoint Node 3 Core Systemic Toxic Chemical Loading Midpoint Node 2 Core
Neurotoxic Chemical Loading Midpoint Node 2 Core
Indoor Inhalation Hazard Loading Midpoint Node 2
Noise Exposures12 Midpoint Node 2
Untreated Hazardous Wastes Group
Specific Untreated Hazardous Waste Risks Potential Node 1 Core13 Eq. is equivalent, t is metric tons, kg is kilograms, ha is hectare
7 Normalized to GMT
2040 EOT 8 By justified regional midpoints 9 By justified regional midpoints
10 By regional cooling zone, where appropriate
11 Materials and products are not required to calculate cumulative loadings; rather, environmental loadings are calculated based on the functional unit.
12 Accounts for noise in exceedance of a 60 Decibel threshold.
© 2009. Scientific Certification Systems, Inc. Page 3-1
Section 3.
STUDY CONVENTIONS, ASSUMPTIONS AND CONSIDERATIONS
This Section addresses key conventions, as well as assumptions made in calculating LCI and LCIA results for regional and local emissions addressed in this study. Additional assumptions and considerations related to the LCSEA framework are described in Appendix 6, while further assumptions specific to the assessment of the WECC and Glen Canyon Hydropower Station and Stateline Wind Power Station are described in Sections 4 and 5 and 6.
3.1. LCI Conventions and Assumptions
The following conventions and assumptions were applied during the LCI phase of data collection and processing.
3.1.1. Raw Materials
Raw materials and fuels extracted from the earth were burdened with their inherent feedstock value and, in addition, were burdened with the resources, energy, direct physical disruption, emissions, and wastes associated with extraction, refining and transportation.
3.1.2. By-Products
By-products, such as fly ash and gypsum associated with power production from coal, were recorded as output amounts, but subsequent processing or use of such byproducts were outside the study boundaries.
3.1.3. Fuel Inputs and Outputs
Fuel inputs included the total amount of fuel inputs from all sources in the defined electric power generation system, including fuels used for transportation and processing, as well as in power generation and delivery. The calculations for electricity used in different processes, such as oil refining, were performed according to the relevant KCL ECO Model unit operations for grid electricity, based upon statistical values for grid electricity. The KCL ECO Model was also the source of data for production of fuels for truck and ship transport, based on unit operations for oil refining.
Transportation data were recorded in terms of the type of vehicle and the distance involved, including whether a trip was one-way or round-trip. These data were then converted into units of vehicle-kilometers, and according to the corresponding unit operations in the KCL ECO Model converted into quantities of resources and fuel consumed and emissions and wastes generated.
© 2009. Scientific Certification Systems, Inc. Page 3-2 3.1.4. Emissions to Air
Air emissions speciated by chemical and recorded in mass flow (mass per volume per unit of time) represent discharges into the atmosphere after passing through emission control devices. Air emissions were calculated for all system processes, including operations associated with the generation of electricity, process emissions, and emissions resulting from the production and combustion of fuels for process or transportation energy. All such emissions were left unaggregated and unallocated.
3.1.5. Emissions to Water
In this study, there were no reported emissions to water. It was not within the scope of this demonstration study for SCS to perform due diligence on the data provided.
3.1.6. Solid Wastes
Solid wastes, recorded in units of mass, represent all emissions to ground from unit operations within the systems studied. While solid waste inventory values are provided for the completeness of the study, solid waste is, in fact, an input to a final unit operation, solid waste management (i.e., landfill, incineration, etc.).
Within the LCSEA methodology, the accounting of resource wastes occurs under the net resource use calculations. Air emissions generated by incineration are accounted for under their respective category indicators (e.g., particulate loading).
3.1.7. Line Losses
For this study, it was assumed that there is a 2% loss of delivered power due to line losses in transmission, based on the statistical average for the transmission distances involved.14
3.2. Site-Dependent Factors Used to Calculate Regional Emissions
The following discussion describes the key assumptions, data and considerations used to calculate the category indicators associated with regional and local emission loadings in this study. Specific assumptions related to Glen Canyon, Stateline and the WECC baseline is described greater detail in their specific sections.
3.2.1. Regional Acidification Loading Assumptions
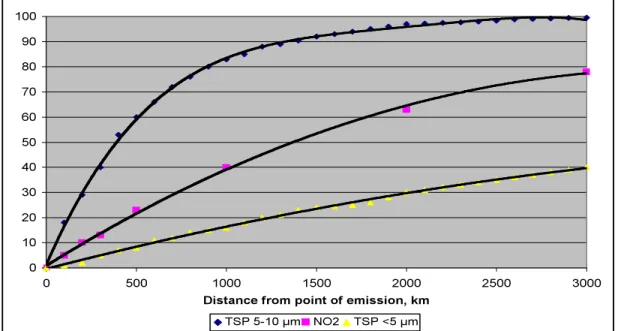
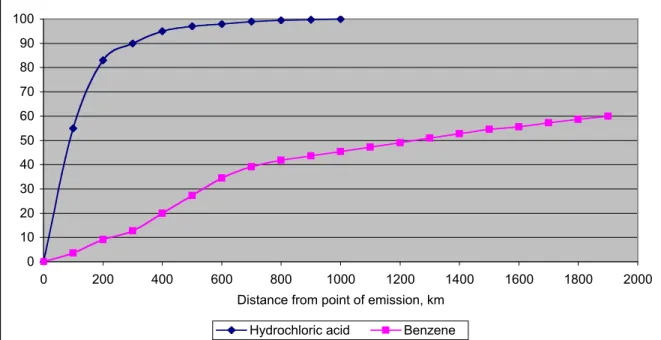
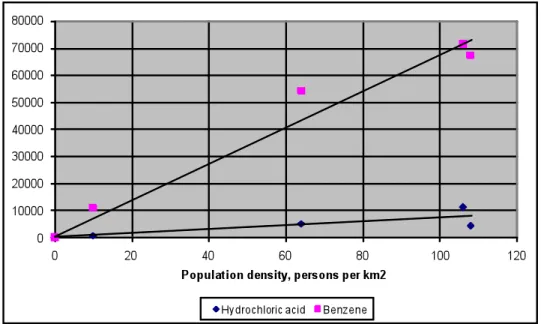
In this study, SCS assumed that the emissions dispersed within concentric plumes around the plants over long averaging periods. This assumption is supported by a number of modeling exercises using the RAINS model under varied meteorological and stack conditions (Figure 3.1).
14 The 2% line loss value is corroborated in a number of sources, including Vattenfall Generation’s Certified Environmental Product Declaration of Electricity from Forsmarks Kraftgrupp AB (FKA), S-P-00021; 2001.
© 2009. Scientific Certification Systems, Inc. Page 3-3 Figure 3.1. Acidification Dispersion Modeling in Europe
Source: Institute of Energy Research (IER), Stuttgart University. CORINAIR is the database for emissions in Europe.
The calculation shown in this figure was performed to determine acidification deposition, but is also representative of NOx dispersion. Scale: Size of total affected region equals about 2000 km from edge to edge.
The geographical distribution of critical acidification load exceedance is based upon the UNEP/RIVM (1999) global acidification report, where exceedance maps for 1992 are given together with estimates for 2015. An overview map from the UNEP report is shown below (Figure 3.2). The UNEP report also provides an exceedance map forecast for 2015, essentially showing the same exceedances.
© 2009. Scientific Certification Systems, Inc. Page 3-4 Figure 3.2. Exceedance areas for acidification in North America in 1992
The map grid is 1o by 1o. All areas with a deposition/critical ratio over 1 (yellow to red) are exceedance areas. The ovals indicate areas of 800-km radius.
Source: UNEP (1997).
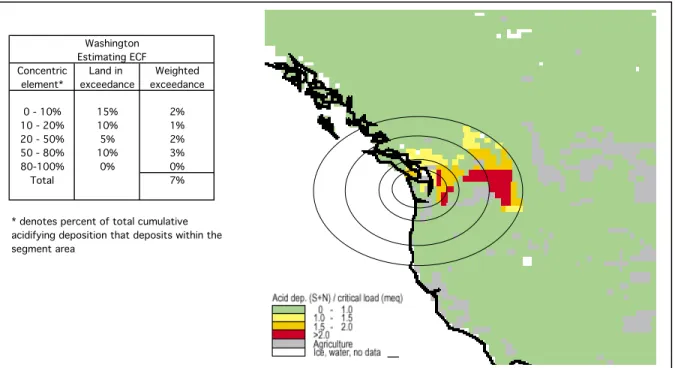
To obtain the acidification ECF for North American locations, the following method has been used. Acidifying substances were assumed to be dispersed according to the EcoSense function, shown in the figure as concentric segments around the point of emissions. These segments were placed on the map showing the exceedance grid according to UNEP/RIVM (1999), and then the exceedance percentage of every segment area was estimated. (See example for Washington State, Figure 3.3).
Acid dep. (S+N) / critical load (meq)
0 – 1.0 1.0 – 1.5 1.5 – 2.0 > 2.0 Agriculture Ice, water, not data
© 2009. Scientific Certification Systems, Inc. Page 3-5 Figure 3.3. Example of Acidification Exceedance Mapping from a Point Source in Washington State
Source: RIVM/UNEP - Global assessment of acidification and eutrophication of natural ecosystems (1999)
The ECF value calculation results are presented in Table 3.1 for the geographical regions relevant for the study.
Table 3.1. Composite Acidification ECF values calculated by State Emission region Acidification ECF
Washington 0.07 Montana 0.07 Oregon 0.06 Idaho 0.06 Wyoming 0.02 California 0 Nevada 0 Utah 0 Colorado 0 Arizona 0 New Mexico 0
The above results would be possible to verify using long-range Lagrangian dispersion/deposition modeling for the actual geographical locations in question, and by superimposing the deposition results on the exceedance map.15 This kind of ECF
15 The Lagrangian derivative is the change over time of an air parcel’s velocity or concentration as measured from the perspective of the parcel itself. It is the sum of the instantaneous change at a fixed location and the convective change (or change due to the movement of the parcel through a field of velocity or background concentrations). Integration of
Concentric Land in Weighted element* exceedance exceedance
0 - 10% 15% 2% 10 - 20% 10% 1% 20 - 50% 5% 2% 50 - 80% 10% 3% 80-100% 0% 0% Total 7%
* denotes percent of total cumulative acidifying deposition that deposits within the segment area
Washington Estimating ECF
© 2009. Scientific Certification Systems, Inc. Page 3-6 assessment, however, was not possible within the resources allocated to this project. Earlier work performed in Europe has shown that results from the simplified approach used here is in good agreement with results from more elaborate dispersion/deposition modeling methods.
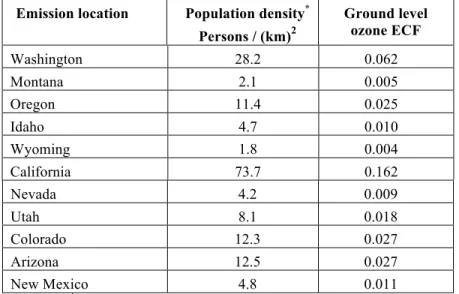
3.2.2. Ground Level Ozone
3.2.2.1. Human Health and Vegetative Impacts
In the LCSEA methodology, two indicator values can be calculated for ground level ozone: a human health indicator and a vegetation category indicator. Each indicator has its own threshold of critical exceedance. The World Health Organization (WHO) established the threshold for the onset of human health effects to be an exposure to 60 parts per billion (ppb) of ground level ozone over a period of 8 hours, while the threshold for the onset of damage to sensitive crops is 40 ppb based on a cumulative exposure of 3000 ppb-hours. The 60-ppb/8-hour limit has been used as the basis for establishing regulations to protect human health. However, in the case of vegetative damage, the data are more complex, and the linkage between the 40 ppb exposure level and the duration of exposure to specific vegetative damage is less clear. As a result, no regulatory limits have been set based on this threshold. For this study, only the human health indicator was calculated.
The indicator results are calculated using the following equation, and reported in cumulative exposure units of measure (persons * ppm O3 * hours).
Ground Level Ozone Exposures = ∑i [ ∑n (NOx emissions x SCFregion x ECEC)]
Where:
• The loading represents the cumulative exposure over threshold (AOT 60), delineated by isopleth, of NOx-equivalent emissions.
• i represents the total number of unit processes.
• n represents the total number of ozone precursors emitted by a unit process.
• SCF is the specific conversion rate of NOx and other precursors to NOx equivalence based on
background concentrations of VOCs and NOx in a given region
• ECEC is the product of the cumulative exposure as determined by AOT 60 mapping by isopleth, and the corresponding population density within the dispersion domain.
3.2.2.2. Considerations in Establishing SCFs and ECFs
Establishment of the SCFs and ECFs used to calculate the ground level ozone indicator involves the correlation of threshold concentrations to point source emissions and the resultant cumulative human exposure.
this function gives the trajectory of the parcel, which is the change of the parcel’s position or concentration over time. This trajectory is used to determine the horizontal and vertical extent of the contaminant plume over a given area, which is used to calculate cumulative concentrations.
© 2009. Scientific Certification Systems, Inc. Page 3-7
3.2.2.2.1. Establishing SCFs
The SCF for ground level ozone is based on the establishment of conversion rates for kg of O3 formed per kg of NOx or VOCs emitted.
• The following atmospheric reactions are used to estimate the range of conversion rates:
o Intermediate alkyl-hydroxyl free radicals (ROO·) are formed from VOCs, CO or hydroxyl radical (OH·) and NOx.
o The peroxy radicals and ozone (O3) oxidize nitrous oxide free radicals (NO·) to form nitrogen dioxide (NO2).
o NO2 is split by ultraviolet radiation (UV), leading to the formation of NO· and the release of oxygen free radicals (O·).
o Oxygen free radicals then react with oxygen (O2) to form O3.
• Conversion rates are also dependent upon meteorological conditions and the background concentrations of both VOCs and NOx.
• Secondary SCFs may be required to establish the specific conversion rate for a given region of the various compounds that comprise the aggregated VOC release. Either the maximum incremental reactivity (MIR) or photo-oxidative chemical potential (POCP) reactivity ranking may be used to determine this secondary SCF.16
The ratios of conversion from NOx to ozone can vary significantly — for instance, from 0.2 to 1.3 kg O3 per kg of NOx released — depending upon the regional background concentrations of VOCs and how limited the NOx concentrations are within that region (Table 3.2).17
Table 3.2. SCF values for four different areas within Europe
Area SCFs (kg O3 / kg NOx)
N Lappland, Finland 1.232 E Svealand, Sweden 0.957
SE England 0.228
C Germany 0.276
Additionally, a difference between initial concentrations of nitric oxide free radicals (NO•) has been observed between urban and rural environments. A
British government study of rural and urban areas found that the 97th percentile seasonal average for ozone was 52 ppb in rural areas and 43 ppb in
16 MIRs are established by the California Air Resources Board; POCPs are published in the Nordic Guidelines. 17 LCSEA Practitioner’s Manual, Scientific Certification Systems, the Swedish Environmental Research Institute (IVL) and Soil and Water, 1997.
© 2009. Scientific Certification Systems, Inc. Page 3-8 urban centers.18 The lower values for urban areas were attributed to the removal reaction of NO• with O3, resulting in lower levels of ozone formation in urban centers due to higher mobile source emissions. The British study results suggest that the same level of NOx emissions in urban centers forms 20% less O3 than in rural areas. The SCFs for rural areas in the vicinity of large urban areas are likely to be in the range of 1.2, while in urban areas, the value is likely to be approximately 0.8. For isolated rural areas, much lower SCF values are expected.
In the current study, an SCF of 1.0 was assumed, which is the equivalent of one kilogram of O3 forming for each kilogram of NOx emitted. For VOCs, the corresponding factor, based on European correlations in the Danish Guideline, was assumed as 0.55 kg O3/kg VOC.
3.2.2.2.2. Establishing the ECF based upon the AOT-60 Exposure Framework
In order to establish the ECF for ground level ozone, an exceedance threshold must be identified. No absolute scientific consensus has been reached for determining the threshold for chronic human health effects from exposure to ground level ozone. The World Health Organization’s (WHO) Air Quality Guidelines use a threshold of 60 ppb averaged over an 8-hour period (i.e., where the concentration level is calculated from running eight-hour averages of the one-hour mean concentrations).19 In this study, SCS used the WHO threshold, based on its compatibility with the European Union’s AOT-60 (“accumulated concentration over threshold”) Framework. Several publications and websites present the scientific underpinnings of the AOT-60 approach and integrate these data sets into the regulatory framework to address trans-boundary pollution.20
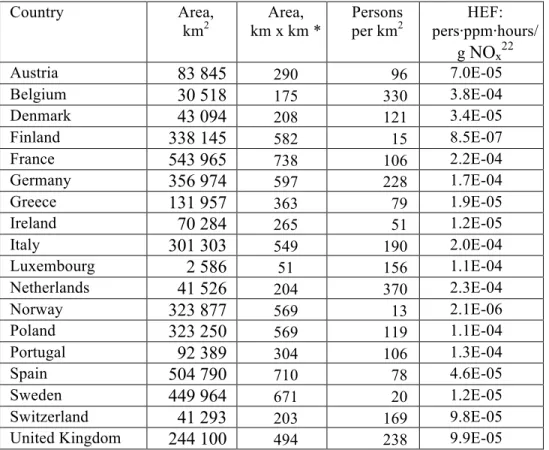
The AOT-60 Framework allows for the establishment of an ECF based upon: 1) the relative population densities of different regions that exceed the 60-ppb/8-hr. threshold; or alternatively 2) the relationship of these population densities to the overall percentage of total NOx emissions contributing to the cumulative annual exposure. The AOT-60 threshold is expressed as the number of people exposed, multiplied by hours of annual cumulative ozone exposure above 60 ppb. The Human Exposure Factor (HEF) is expressed per gram of NOx or equivalent VOC emitted as “person * ppm O3 * hours / g NOx”, and represents a unit of cumulative exposure for a given region. The HEFs for 41 regions or countries in Europe have been determined with the
18 Derwent, D., “Ozone Trends in the British Isles and their European Policy Context, Climate Research Division,” Meteorological Office, Bracknell, UK [EPG1/3/164], 2002.
19 World Health Organization (WHO) Air Quality Guidelines for Europe, 2nd Edition, 2000.
20 Readers interested in this framework are directed to the general website of the Coordination Center for Effects in Holland, CCE, RIVM. http://arch.rivm.nl/cce.