Structural, efficiency and income effects of direct payments:
an analysis of different payment schemes for the German region
'Hohenlohe'
Happe, K.a*, Balmann, A.a & Kellermann, K. a a Institute of Agricultural Development in Central and Eastern Europe (IAMO),
Halle (Saale), Germany
* Correspondence: Theodor-Lieser-Straße 2, D-06120 Halle (Saale), Germany, [email protected]
Abstract
The objective of this paper is to work out some fundamental dynamic effects on agricultural structure, farm incomes, and efficiency that result from decoupled income payments, the transfer of payments together with a progressive payment cut. To do so, we apply the agent-based model AgriPoliS (Agri-cultural Policy Simulator). AgriPoliS is a normative spatial and dynamic model of regional agricul-tural structures that takes account of actions and interactions between a large number of individually acting farms. The model is calibrated to the region 'Hohenlohe' in Baden-Württemberg which is char-acterised by intensive livestock farming on the plains and extensive cattle and dairy farming in more remote valleys. The policy simulations show that impacts on structural change, competitiveness, and income distribution vary greatly depending on how the policy scheme is implemented. If direct pay-ments are completely decoupled from land use (no obligation to farm land) this has significant and lasting effects on the competitiveness of agriculture, structural change, farmers’ incomes and land-use.
1 Introduction
The current discussion on the mid-term review of the Common Agricultural Policy (CAP) of the EU has drawn much attention to the further decoupling of direct payments from produc-tion. The proposed policy change is to provide a basis for the forthcoming WTO negotiations, but also for the enlargement of the EU. Since it is expected that an application of the Agenda 2000 policies to the accession countries would create enormous budget pressure (Swinbank and Tangermann 2000), a less costly CAP is needed. The mid-term review of the CAP has provided a first proposal for such a policy change (EU Commission 2002). A key issue is the introduction of a farm specific decoupled income payment instead of payments coupled to production. This is expected to give the farms greater flexibility and to increase their market orientation. Among agricultural economists it is less the decoupling as such which is dis-cussed, but it is rather the details of decoupled payments which are open to dispute. Among others, some critical points in this respect are: (i) a step-wise payment cut (dynamic modula-tion), (ii) the establishment of payment entitlements per hectare, and (iii) the transfer of pay-ment entitlepay-ments when parts of the farm are sold or leased. This paper aims to shed some light on these points. The objective is to work out some fundamental dynamic effects on agri-cultural structure, farm incomes, and production efficiency that result from a switch to further decoupled income payment schemes and related detailed regulations. For this the agent-based model AgriPoliS (Agricultural Policy Simulator) is applied. AgriPoliS is a normative spatial and dynamic model of agricultural structures. The model explicitly takes account of actions and interactions (e.g. rental activities, investments, and continuation of farming) of a large number of individually acting farm-agents. Accordingly, AgriPoliS allows for endogenous structural change and it is particularly suited to analyse structural, allocative, and distributive effects of policy changes on the agricultural structure of a small region. In this study, the model is applied to the region of Hohenlohe in southwest Germany
2 Methods and techniques
In AgriPoliS the farms are modelled as agents, i.e. as entities that act individually, and sense parts of their environment and act upon it (cf. Ferber 1999). As the main features of agent-based models have been described elsewhere (e.g. Berger 2001, Balmann 1995 and 1997) we will not further elaborate on them, but focus on those model components that go beyond the basic model by Balmann (1995 and 1997).1
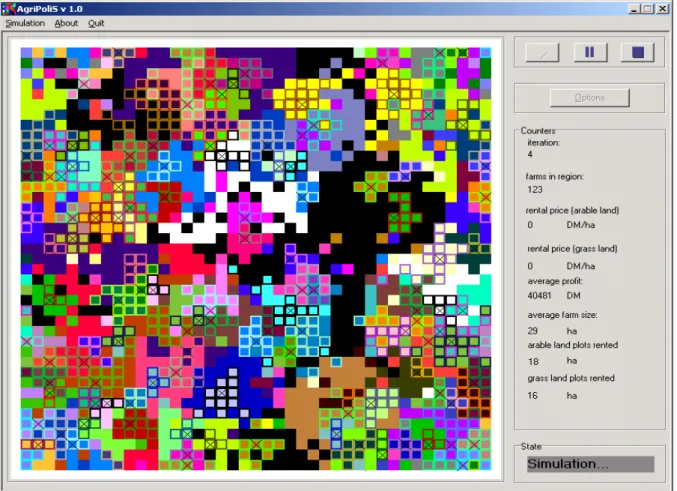
In AgriPoliS an agricultural region is interpreted as a GIS-like grid of cells with a size of 2.5 ha (Figure 1). The coloured cells represent agricultural land which is either grassland or arable land. On some of the cells, farmsteads are located. They are marked with and X. The total land of a farm consists of both own and leased land. All cells belonging to one farm have the same colour; if the land is owned by a farm, the cell is surrounded by a box.
Figure 1: AgriPoliS - Graphical User Interface
We assume that each farm acts autonomously and maximises household income. For the ad-aptation of the model to the Hohenlohe region we defined a number of production activities. The chosen 13 activities (pig fattening, pig breeding, turkeys, dairy cows, beef cattle, suckler cows, cereals, sugar beet, rape seed, and permanent grassland) are typical for the region. For production, farms can choose between 29 investment options (buildings, machinery, facilities) of different types and capacities. The latter allows to implement economies of size, i.e. with increasing size, the costs per unit of production capacity decrease and labour is assumed to be used more effectively. Farms can lease land, production quotas, and manure disposal rights. Labour can be hired on a fixed or per-hour basis, vice versa farm family labour can equally be offered for off-farm employment. To finance farm activities, farms can take up long-term and short-term credits. Liquid assets not used on-farm can be saved. Farms quit production either if they are illiquid or if opportunity costs of input owned by the farmer are not covered.
Production and investment decisions are made simultaneously on the basis of a single-period mixed-integer programme. Farm decision making can be called myopic or boundedly rational because the decision problem of the model farms is highly simplified with respect to strategic aspects. Unbounded rationality would require that farms take account of the interactions be-tween farms as well as of the technical and political framework conditions now and in future periods. Currently, this cannot be implemented because of computational and methodological problems.2 Hence, we need to make a number of assumptions about expectation formation. In the majority of cases farms follow adapted expectations. Merely policy changes are antici-pated one period in advance and included into the decision making process. If a policy change is expected to cause severe structural effects on key variables (e.g. a drop of land rental prices due to fully decoupled direct payments) then expectations about the respective variables (e.g. rents) are given exogenously. Furthermore, most prices remain relatively constant. Prices of livestock and cereals underly a slight downward trend, prices of variable labour and agri-services are assumed to show a slow, but steady increase.
New investments affect production capacities for the operating lifetime of the investment. Investment outlays are assumed to be totally sunk. Farms are handed over to the next genera-tion every 25th period. For this decision opportunity costs of farm family labour are consid-ered to be 15% higher. Accordingly, continuation of farming can be interpreted as an invest-ment decision into either agricultural or non-agricultural training. And finally, farms are dif-ferentiated by their management ability. For this we randomly assign each farm a manage-ment factor which represents the spread of profitability and compatibility of model farms.
At the start-up the location of farmsteads as well as the farms' initial endowment with produc-tion factors (family labour, machinery, buildings, producproduc-tion facilities, land, producproduc-tion quota,
liquid assets, and borrowed capital) are specified. During the following periods these vari-ables are changed as a result of production, lease, and investment activities. Even though farms do not directly interact with each other, they are connected indirectly via markets for products, land, milk quota, and manure disposal area.
The land market is of particular relevance as farms cannot grow independently of land. As farms predominantly grow by leasing land, we only consider a land rental market. On this market, land is available either because farms quit the sector or because unprofitable land is let for lease. Each period, free plots are leased to the farms in an iterative auction. For this, each farm determines the plot it wishes to lease and determines a bid depending on the shadow price for land, the number of adjacent farm plots and the distance-dependent transport costs between the farmstead and the plot.3 The number of adjacent plots and the bid are posi-tively correlated because we assume that economies of size in crop production can be realised with larger field sizes and larger machinery.Finally, the bids of all farms are compared and the farm with the highest bid receives the respective plot. This process continues until all land is leased or the bids are zero. The renting process alternates between arable land and grass-land. As other costs associated with leasing land, such as taxes and fees, are not considered in the initial bid, the actual rent paid is set at 75% of the bid. Each period the rent paid for a plot is adjusted towards the average rent paid for newly leased plots. This is done to avoid large fluctuations of rents between periods and to take account of trends.
Technical change is another issue in AgriPoliS. On farms, technical change is mostly embod-ied in process innovations, i.e. in improved equipments, facilities, or work organisation (cf. Berger 2001). With process innovations farmers usually expect to realise cost savings. As
t
3 As shadow prices for land can possibly increase with land endowment, it would be reasonable to bid for more
farms are highly heterogeneous in reality, it is hardly possible to determine an exact cost-saving effect. Hence, we assume that with each new investment the variable unit costs of the product produced with the investment type decrease by 1 to 1.5 %. The labour saving feature of larger investments, also represents a kind of technical change.
3 Model calibration and empirical data base
The definition of the individual farm agents in AgriPoliS is mainly based on farm accoun-tancy data from 1997/98 for 12 selected farms in Hohenlohe.4 The chosen farms are consid-ered to be typical for the region, i.e. they cover the most important production activities and organisational forms of the region. Table 1 provides an overview about key characteristics of the selected farms. Eight full-time and four part-time farms were chosen. Unfortunately, no data is available on the kind and the remaining useful lifetime of the farms' production equipment. Therefore, we assume that the farms operate with buildings, machinery and facili-ties which are considered to be typical for the region.5 In addition to the figures in the table, equity capital, land assets, and private withdrawals are also taken from accounting data. Based on these real farms, 12 model farming systems are defined.
for only one plot we calculate the average shadow price for renting 8 plots at a time, and take the maximum of both as the basis for the rent offer.
4 An adaptation to the financial year 1998/99 appeared not suitable because of the extremely unfavourable
situa-tion on pig markets. Currently the data base is adjusted to the financial year 2000/01.
Table 1: Key characteristics and frequencies of the chosen farms (financial year 1997/98) A B C D E F G H I J K L Organisation Farm type PP PP D D A A M PP D M A PP Full-time/Part-time FT FT FT FT FT FT FT FT PT PT PT PT Land [ha] total 22,5 72,5 67,5 30 35 60 50 112,5 12,5 17.5 10 20 Leased 15 67,5 55 10 10 45 20 92,5 5 0 0 0 Arable land 22,5 72,5 40 12,5 35 60 22,5 102,5 5 12.5 10 20 Grassland 0 0 27,5 17,5 - - 27,5 10 7,5 5 0 0 Family labour 1 1.7 1.38 0.99 1.15 2.27 1.53 1.8 0.72 0.71 0.26 1.16 Milk quota [1000 t] - - 203 100 - - 139 - 56 - - - Livestock [places] Beef cattle - - - - 25 - 5 - - Dairy cows - - 39 26 - - 28 - 12 - - - Sows 40 128 - - 40 - 64 170 - - - 128 Fattening pigs 300 600 - - - - - - - 100 - - Turkeys - - - 20000 - - - - - - Frequency 480 25 120 244 106 22 231 95 389 154 442 298
FT – Full-time; PT – Part-time; PP – Pig/Poultry; A – Arable; F – Dairy; M – Mixed
The database underlying these farming systems is calibrated to reflect production capacities and key economic figures of the 12 real farms. Data on prices, production costs, and technical coefficients are taken from standardised data collections which were published for certain regions or the whole of Germany (e.g. KTBL). After calibrating the database on the farm sys-tem level, in a final step the region is calibrated to reflect major key characteristics of the real region. For this, each model farming system is assigned a specific frequency (Table 1) which is the number of times this particular farming system is represented in the region. The fre-quency was determined taking into account the total number of farms in the region differenti-ated by size, farm type, land use, and livestock production.6 The adaptation of the model to
the real region was done by minimising the weighted quadratic deviation between selected figures of the model and of reality (cf. Balmann et al. 1998). With respect to a number of variables, the model matches reality quite well. For instance, in the model full-time farms manage 55,565 ha land, in reality it is 57,464 ha.7 As for the number of farms of a particular type, the adjustment is worse; whereas in the model the number of arable farms is overesti-mated by 25%, the number of mixed farms is underestioveresti-mated by 24%. About 50% of the farms in the region are part-time farms, where as in the model about 25% of the farms are
6 Kleingarn (2002) provides a more detailed description of the data base and the calibration procedure. 7 A more detailed table that compares the model adjustment to reality can be obtained from the authors.
part-time farms. The reason behind is that very small farms are underrepresented in the under-lying statistical sample. This makes it difficult to properly represent part-time farms. In a final step, the some 2600 model farms which are based on the different farming systems are further individualised with respect to the age and kind of buildings, facilities, machinery, and farm location.
4 Results
The following simulations illustrate possible dynamic effects of several decoupled payment schemes on the Hohenlohe region. The full implementation of Agenda 2000 by the end of 2002 is taken as the reference scenario. However, as the model data base is derived from fi-nancial years before the implementation of Agenda 2000, in a first step the model needs to be calibrated to a pre-Agenda policy situation. This is necessary since adjustment processes to policy changes are not immediate, but are slow and subject to a kind of path dependence (Balmann 1995).8 In this paper the policy options as given in Table 2 are considered:
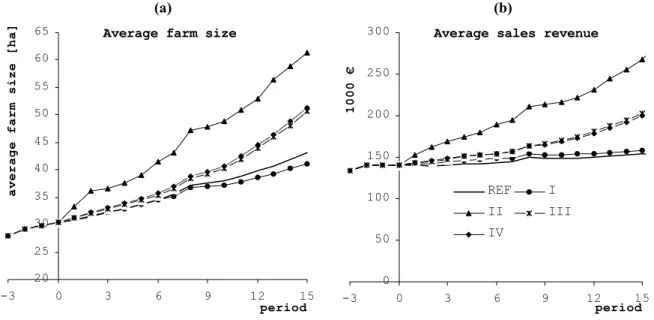
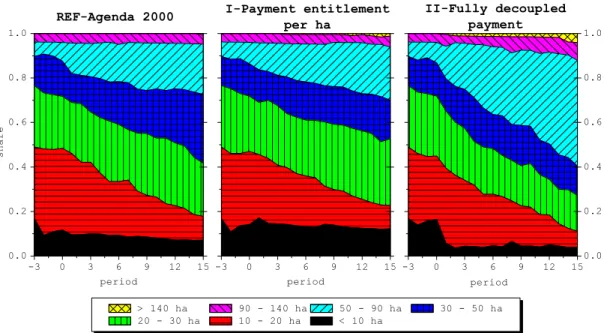
Figures 2(a) and (b) show the development of the average farm size and of average sales revenue over time. This and the following figures show results for four periods prior and 15 periods after the policy change.9 The figures give an impression about the speed of structural change under the defined policy conditions. As the figures show, structural change takes place in all policy scenarios, but is more pronounced if payments are fully decoupled from produc-tion and land use. This is underlined by figure 3 in which the reference scenario is contrasted with two decoupled scenarios. It shows that only in the case of a fully decoupled payment, land is increasingly managed by farms with 50 hectares or more. Coupling the payments to farmed land even slows down structural change as compared to the reference scenario.
8 In another paper, the authors undertake a detailed calibration of the basic model and compare the pre-Agenda
Table 2: Policy scenarios*
REF Agenda 2000" - Full implementation of Agenda 2000 at the end of 2002
I Payment entitlement
per ha# - Each farm receives a single decoupled income payment based on the average payments of the past three years.
- The overall amount is split into parts (payment entitlements) on a per-ha-basis. Hence, payments are attached to the use of land rather than produc-tion.
- Entitlements are fully transferred if land is leased or let for lease.
II Fully decoupled
payment - Each farm receives a single decoupled income payment based on the average payments of the past three years. - Payments are independent of farm activity, i.e. they continue to be granted if
farms quit agriculture.
III Decoupled payment + area payment 50 €/ha
- Each farm receives a single decoupled income payment based on the average payments of the past three years. This payment is reduced by 50 €/ha of the average land farmed in the three years prior to the introduction of the policy. - Cultivated land receives a basic area payment of 50 €/ha which is a reward
for the land management activity.
- The decoupled payment part of the scheme is independent of farm activity, i.e. it is paid if farms quit agriculture.
IV Decoupled payment + area payment 50 €/ha + modulation
- Like the previous scenario
- The decoupled payment is decreased annually by 5% of the initial payment over the next 20 periods
* Set-aside is compulsory; the dairy regime remains unchanged; premium payments for dairy cows are not considered. # This scenario is based on a specific interpretation of the EU commissions’ mid-term review of the Agenda 2000.
(a) (b)
Average farm size
20 25 30 35 40 45 50 55 60 65 -3 0 3 6 9 12 15 period a verag e far m siz e [ha
] Average sales revenue
0 50 100 150 200 250 300 -3 0 3 6 9 12 15 period 10 00 € REF I II III IV
Figure 2: Average farm size and average sales revenue
Figure 2 also shows a clear difference between policy scenarios with respect to the way in which farms grow. In the reference scenario and scenario I farm acreage grows quicker than farm revenues. This means that over time production becomes less intensive.10 In the
9 Period 1 stands for the first period after the policy change.
led scenarios, production is more intensive as both revenue and farm size grow at similar pace. However, in these scenarios, fully decoupled direct payments are not the only reason for a more pronounced farm size and revenue growth. Many smaller farms take the fully decoup-led payments with a continuation of payments as a chance to quit production altogether. This changes the composition of the farm sample and therefore creates a sample effect.
What cannot be seen in the figures is that in scenario II with fully decoupled income pay-ments, in the model up to a third of all land (mainly grassland) in the region is not leased at all after the policy change. The introduction of a mixed policy, that on the one hand grants a fully decoupled income payment but at the same time rewards land use with a small base premium of 50 € per ha ensures that all land is farmed.
-3 0 3 6 9 12 15 0.0 0.2 0.4 0.6 0.8 1.0 REF-Agenda 2000 share period > 140 ha 90 - 140 ha 50 - 90 ha 30 - 50 ha 20 - 30 ha 10 - 20 ha < 10 ha -3 0 3 6 9 12 15 I-Payment entitlement per ha period -3 0 3 6 9 12 150.0 0.2 0.4 0.6 0.8 1.0 II-Fully decoupled payment period
Figure 3: Development of farm size classes for selected policy scenarios
As was indicated before, agricultural policies do not only affect the farm structure of a region but also the production structure. Table 3 shows the average annual change rates of selected production activities after a policy change. Compared to the reference scenario, suckler cow production ceases immediately after the introduction of payments which are decoupled from
livestock production.11 Dairy production also shows a steady decrease which is ore or less independent of the prevailing policy environment. Although this leads to falling quota prices, this effect is outweighed by the fact that dairy farms do not re-invest in dairy production or quit farming altogether. Intensive livestock production is more dependent on the policy envi-ronment. Whereas in the reference scenario, pig production decreases, this could be reversed or slowed down in the decoupled scenarios II-IV. A reason for this is the easier accessibility of land due to lower rents. This alleviates manure restrictions.
Table 3: Average annual change rates of production capacities for marketed products
Szenarios REF I II III IV
[%] Cereals 0.56 0.80 0.73 0.81 0.81 Sugar beet 0.00 0.00 0.00 0.00 0.00 Dairy cows -9.44 -9.71 -11.4 -9.38 -9.54 Suckler cows1) 3.43 . . . . Fattening pigs -0.51 0.78 2.40 2.41 2.07 Breeding sows2) -2.41 -1.34 -2.07 -1.71 -1.62 Turkeys 1.51 1.43 4.37 2.52 3.00
1) suckler cow production immediately stops after a policy change 2) production of sows and fattening pigs is not linked
In spite of decreasing total revenues in the region, the efficiency of agricultural production, measured as the difference between net value added and opportunity costs of labour and capi-tal, increases significantly in all policy scenarios (Figure 4).
11 With respect to suckler cows one needs to be careful because profitability strongly depends on the way it is
(a) (b) Rental price -150 0 150 300 -3 0 3 6 9 12 1 period € per ha 5 REF I II III IV
*The economic rent is what is left to pay for land. It is defined as total income plus rent expenditure minus opportunity costs of labour and capital. Depreciations of facilities that are used no longer when a farm quits the sector are not considered.
Figure 4: Average economic rent and average rent payed for leased land
Economic rent* -150 0 150 300 -3 0 3 6 9 12 15 period € per ha
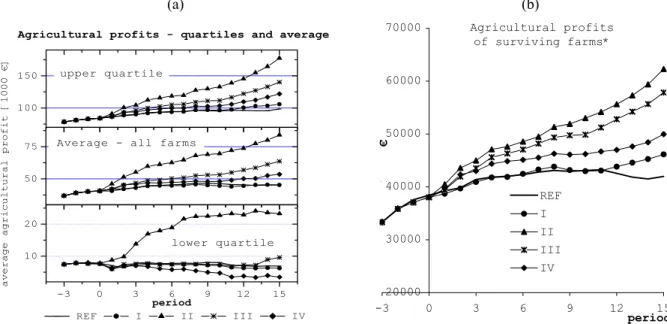
With farms leaving the sector the composition of the farm sample changes and the surviving farms take advantage of relaxed conditions on product and factor markets, and particularly on the land market. As Figure 4 shows, albeit an increasing average economic rent (Figure 4a), the average rent paid by the farms for leased land (Figure 4b) decreases. With respect to the fully decoupled scenarios, rents decrease dramatically by about 50 % shortly after the policy change. This shows, that the lower shadow prices for arable land and grassland resulting from decoupled payments are transferred quickly into lower rents.12 As at the outset of the model the share of leased land is about 60% on average, farms with a higher share of leased land will benefit from lower rents. This is supported by Figure 5(a).
(a) (b) -3 0 3 6 9 12 15 10 20 50 75 100 150 lower quartile period
Average - all farms
a v e rag e ag ric ul tu ral p r o fit [ 1 0 00 €]
Agricultural profits - quartiles and average
REF I II III IV upper quartile Agricultural profits of surviving farms* 20000 30000 40000 50000 60000 70000 -3 0 3 6 9 12 1 period REF I II III IV
* By agricultural profits we denote the income stemming from agriculture excluding off-farm activity and farm family labour.
Figure 5: Agricultural profits
1000 €
5
On average, the agricultural profits, i.e. the income derived from agricultural activities includ-ing transfer payments, show a much stronger increase in the decoupled payment scenarios. Even if direct payments are cut annually (scenario IV), profits increase faster than in the sce-narios with payments attached to production or land use. This means that decoupling on aver-age generates a growth potential which outweighs the reduction of direct payments. However, a look at the averages for the upper and lower quartiles of farms reveals that only in the sce-nario with fully decoupled payments all farms benefit. In the other decoupled scesce-narios only the more profitable farms benefit. One could argue that this interpretation is also the result of the sample effect as the composition of the farm sample changes over time and depending on the policy. However, an analysis of the farms that survive under all policy conditions (Figure 5b) shows that these farms can generate increasing profits in any case and even if payments are cut annually. Hence, farms with a growth potential high enough to guarantee the farm business to operate also in 15 year's time, benefit the most from decoupled payments.
H
12 In reality this process can be expected to last longer as lease contracts usually define a period of cancellation.
5 Conclusions
The results obtained with AgriPoliS are subject to a number of assumptions that influence the behaviour and interactions of farm agents, and hence model results. Especially since the psented results imply relatively clear conclusions which, to our knowledge, cannot yet be re-produced with other models, the approach behind AgriPoliS as well as the underlying as-sumptions need to be discussed thoroughly. As long as comparable models are lacking, results can only be evaluated along their theoretical and practical plausibility. In brief, the central results of the policy simulations are:
• If payments are no longer attached to production, but to land use only (scenario I), this will result in no significant changes of production, efficiency, and profits compared to the reference scenario. This is not surprising as at least the cereal payments under the Agenda 2000 are considerably attached to land use and widely uniform.13
• Fully decoupled direct payment schemes granted independent of agricultural produc-tion (scenarios II-IV) show to have land slide effects. Shadow prices for producproduc-tion factors fall dramatically as a consequence of the policy. Thus, farms have stronger in-centives to spend less on leasing land, and to look for alternative uses of the comple-mentary factors labour and capital. This means accelerating structural change. How-ever, marginal land may no longer be managed. In the model, a basic land manage-ment premium of 50 € per ha was enough to prevent land from falling idle.
• As for the winners and losers of a policy change towards decoupled income payments, the model results produce a clear answer. Both, unprofitable farms, and farms with a growth potential, profit from fully decoupled payments. The first group profits be-cause they are rewarded for leaving the sector. This takes away some strain on the payments to reflect changes in overall supply and demand on the land market.
land market as more land is available for lease. The remaining farms have the oppor-tunity to lease land at lower prices and to realise size effects more easily. Furthermore, as these farms' share of leased land has already been higher at initialisation, farms re-ceive an additional profit from the sharp drop in rents.
• As was seen above, in the model, the resulting efficiency gains outweigh the disadvan-tages from an annual payment cut. Hence, decoupling could be seen as a means to re-duce the total amount of payments without suffering from severe income losses. The income effect on farms leaving the sector will have to be analysed further as these farms are excluded from the growth potential of remaining farms.
• Losers of a fully decoupled payment scheme will certainly be the land owners, as it can be expected that a drop in rents will also lower the sales value of land. This, how-ever, has also consequences for the use of land as a security, which in return could en-danger the survival of capital intensive farms, too. Moreover, it would make it more difficult for farms to exploit the very growth potential that results from the decoupling.
The majority of the points are plausible from a theoretical and empirical point of view. How-ever, there remain a number of questions, which cannot be answered to a full extent here. As much as fully decoupled payments granted independent of farming make sense from an eco-nomic point of view, their general acceptance by society can be questioned as it will be diffi-cult to justify why farmers should still receive payments if they quit farming (Swinbank and Tangermann 2000). Food quality and environmental aspects which form another pillar of ag-ricultural policy making have also been left out. But it can be expected that these policies have an indirect effect on agricultural structures and production efficiency, too. From a purely economic point of view the results presented in this paper support the demand for a decoup-ling of payments which over the past 25 years has repeatedly been advocated by agricultural
economists (e.g. Koester and Tangermann 1976, Swinbank and Tangermann 2000, Isermeyer 2002). If implemented at reasonable financial terms and time horizons, and if certainty about the future existence of the policy scheme is insured, then a decoupled payment scheme could provide a chance for both policy makers and active farmers to win in the end.
6 References
Balmann, A. (1995). Pfadabhängigkeiten in Agrarstrukturentwicklungen - Begriff, Ursachen und Konsequenzen. Duncker und Humblodt, Berlin.
Balmann, A. (1997). Farm-based Modelling of Regional Structural Change: A Cellular Automata Approach. European Review of Agricultural Economics 24(1): 85-108.
Balmann, A., Happe, K. (2001). Agentenbasierte Politik- und Sektoranalyse – Perspektiven und Herausforderungen. Agrarwirtschaft 50(8): 505–516.
Balmann, A., Lotze, H., Noleppa, S. (1998). Agrarsektormodellierung auf der Basis 'typischer Betriebe'. Teil 1: Eine Modellkonzeption für die neuen Bundesländer. Agrarwirtschaft 47(5): 222-230.
Berger, T. (2001). Agent-based spatial models applied to agriculture. A simulation tool for technology diffusion, resource use changes, and policy analysis. Agricultural Economics 25: 245-260.
EU Commission (2002). Mid-Term Review of the Common Agricultural Policy - COM(2002) 394 final. http://www.europa.eu.int/comm/agriculture/mtr/comdoc_en.htm.
Ferber, J. (1999). Multi-Agent Systems: An Introduction to Distributed Artificial Intelligence, Addison-Wesley.
Happe, K., Balmann, A. (2002). Struktur-, Effizienz- und Einkommenswirkungen von Di-rektzahlungen. Agrarwirtschaft 51(8): 376-388.
basis of distance and transport costs, and not depending on the payment entitlement of a plot.
Isermeyer, F. (2002). Grundlegende Reform des Prämiensystems? Stellungnahme zur Halb-zeitbewertung der Gemeinsamen Agrarpolitik und Entwicklung eines Alternativ-vorschlags. Arbeitsbericht 03/2002 des Instituts für Betriebswirtschaft, Agrarstruktur und ländliche Räume, FAL, Braunschweig.
Kellermann, K. (2002). PlayAgriPoliS – Ein agentenbasiertes Politikplanspiel. MSc-Thesis. Humboldt-Universität zu Berlin.
Kleingarn, A. (2002). Anpassungskosten von Agrarpolitikänderungen – Erstellung und Kali-brierung der Datengrundlage für ein räumlich-dynamisches Multiagentenmodell der Re-gion Hohenlohe. MSc-Thesis. Humboldt-Universität zu Berlin.
Koester, U, Tangermann, S. (1976). Alternativen der Agrarpolitik. Eine Kosten-Nutzen-Analyse im Auftrag des Bundesministeriums für Ernährung, Landwirtschaft und Forsten. Landwirtschaftsverlag, Münster-Hiltrup.
Kuratorium Technik und Bauwesen in der Landwirtschaft (KTBL), various years. Daten-sammlung Landwirtschaft.
Swinbank, A., Tangermann, S. (2000). A Proposal for the Future of Direct Payments Under the CAP. Working Paper No. 1 prepared under the Project “Bond Scheme” financed by the EU Commission (QLRT-1999-015010), October 2002.
![Table 1: Key characteristics and frequencies of the chosen farms (financial year 1997/98) A B C D E F G H I J K L Organisation Farm type PP PP D D A A M PP D M A PP Full-time/Part-time FT FT FT FT FT FT FT FT PT PT PT PT Land [ha]](https://thumb-us.123doks.com/thumbv2/123dok_us/136089.2516733/8.892.105.793.135.398/table-characteristics-frequencies-chosen-farms-financial-organisation-farm.webp)