Three Essays in Public Finance in Developing Countries
by
Luis Alejandro Alejos Marroquín
A dissertation submitted in partial fulfillment of the requirements for the degree of
Doctor of Philosophy (Public Policy and Economics)
in The University of Michigan 2018
Doctoral Committee:
Professor Joel Slemrod, Chair Professor James R. Hines Professor Linda Tesar Professor Dean Yang
Luis Alejandro Alejos Marroquín lalejos@umich.edu
ORCID iD: 0000-0002-8574-0790
ii
DEDICATION
An achievement such as the completion of a doctorate degree is seldom the result of an individual effort. Throughout the years, I have been privileged to receive the support of many wonderful people. However, this journey would not have been possible without the ever-present support and guidance of my parents, as well as the understanding and encouragement of my wife. I dedicate this achievement to them. A special mention goes to Regina de Riojas and the members of Asociación Becaria Guatemalteca, an institution that believed in my early potential and gave me the opportunity to develop it. Thank you for your selfless, tireless, and inspiring work in favor of Guatemala’s youth.
iii
ACKNOWLEDGEMENTS
I would like to express my sincere gratitude to Joel Slemrod, Jim Hines, Linda Tesar, and Dean Yang for their patient and honest advice, as well as their continuous support throughout my time in Michigan. This research benefited significantly from discussions with Claudio Agostini, Pierre Bachas, Luis Baldomero, William Boning, Giacomo Brusco, Benjamin Glass, Shekhar Mittal, Alexander Persaud, Ana Ríos, Sebastian Sotelo, Tejaswi Velayudhan, and conference and seminar participants at the University of Michigan, North East Universities Development Consortium (NEUDC), National Tax Association, University of Zurich, International Institute of Public Finance, and Research Institute for Development, Growth and Economics (RIDGE). I would also like to extend my thanks to Ricardo Barrientos, Maynor Cabrera, Gabriel Castellanos, Juan Alberto Fuentes, Humberto Guzmán, Abelardo Medina, and the staff of Superintendencia de Administración Tributaria, for their valuable insights at the early stages of this research.
iv
TABLE OF CONTENTS
DEDICATION ……… ii
ACKNOWLEDGEMENTS ……… iii
LIST OF FIGURES ………. viii
LIST OF TABLES ……….………. ix
LIST OF APPENDICES ………. x
ABSTRACT ……….... xi
CHAPTER 1. Firms' (mis)reporting under a minimum tax: Evidence from Guatemalan corporate tax returns ... 1
1.1.Introduction ……… 1
1.2.Theoretical Framework ……….. 3
1.2.1. Profit maximization under a pure profits tax ……… 4
1.2.2. Profit maximization under a turnover tax ……… 5
1.2.3. Profit maximization under a minimum tax ………. 6
1.2.4. Implication of adding an exception rule to the minimum tax scheme …………. 8
1.2.4.1. Exemption rules that create an upward notch in the tax liability function .. 9
1.2.4.2. Exemption rules that create a downward notch in the tax liability function ……… 11
v
1.3.1. Guatemalan income tax and minimum tax scheme ……….. 12
1.3.2. Data………. 13
1.4.Empirical Strategy………... 14
1.4.1. Tax liability function and exemption rule under Regimen Optativo ……… 14
1.4.2. Firm behavior and testable predictions ………. 16
1.4.2.1. Bunching at the kinks of the tax liability function ………... 17
1.4.2.2. Bunching at the MTS exemption threshold ……… 18
1.4.2.3. Differentiated behavior of merchandise and services firms ………. 19
1.4.3. Methodology for the estimation of bunching responses ………... 21
1.5.Empirical Results ………... 24
1.5.1. Evidence of bunching at the kinks ……… 24
1.5.2. Evidence of gross margin misreporting ………. 26
1.5.3. Bunching responses estimates ………. 27
1.6.Conclusions ……… 30
1.7.References ……….. 33
1.8.Figures and Tables ………. 37
CHAPTER 2. Estimating the fiscal impact of extreme weather events ……….. 50
2.1.Introduction ……… 50
2.2.Literature Review ………. 52
2.3.Theoretical Framework ………. 53
2.3.1. Basic model ……….. 53
2.3.2. Understanding the impact of disaster shocks in the budget balance ……… 55
vi
2.4.1. Data ……….. 56
2.4.2. Definition of extreme weather events ………. 57
2.4.3. Benchmark econometric model …….……….. 58
2.5.Empirical Results ……….. 59
2.5.1. Benchmark model estimation ……….. 59
2.5.2. Results by per capita income classification ……… 61
2.5.3. Robustness checks ……… 62
2.5.4. Other potential identification threats ……… 63
2.6.Conclusions ……….. 65
2.7.References ……….. 67
2.8.Tables ……….……….. 70
CHAPTER 3. Tax arbitrage and domestic profit shifting in environments with co-existing income tax regimes ……….……… 78
3.1.Introduction ……… 78
3.2.Theoretical Model ………. 80
3.2.1. A simple model of profit maximization ……….. 81
3.2.2. Tax arbitrage and profit-shifting between regimes ………. 83
3.2.3. Robustness of the model to turnover and cost misreporting ……… 85
3.3.Context and Data ……….. 87
3.3.1. Corporate income tax regimes in Guatemala ……….. 87
3.3.2. Data ….…….……… 87
3.4.Empirical Strategy ………. 88
vii
3.4.2. Definition of treatment and control groups ……….. 90
3.4.3. Empirical model ……….. 90
3.5.Empirical Results ……….………. 91
3.5.1. Firms’ registration in Regimen General by network type ….……….. 91
3.5.2. Results of the baseline difference-in-difference estimation ………. 92
3.5.3. Results of the generalized difference-in-difference estimation ……… 93
3.5.4. Heterogeneity of the response by income groups ……… 93
3.6.Conclusions ……… 94
3.7.References ..……… 96
3.8.Figures and Tables ……… 98
viii
LIST OF FIGURES
Figure
1.1 Income tax liability function under a minimum tax scheme ………. 37 1.2 Firm behavior and bunching when switching from a profit tax to a minimum tax
scheme ……… 38 1.3 Implications of exemption rules that create an upward notch ……… 39 1.4 Implications of exemption rules that create a downward notch ………. 40 1.5 Implications of the exemption rule for the Guatemalan minimum tax scheme ……….. 41 1.6 Kernel density distributions of reported profit margin ………. 42 1.7 Kernel density distributions of reported gross margin ……… 44 1.8 Bunching estimation for exemption-eligible firms at the MTS payment threshold …. 46 1.9 Bunching estimation for non-exempt firms at the MTS payment threshold ………… 46 3.1 Firms registered in Regimen General by network type ……….. 98 3.2 Generalized difference-in-difference coefficients, by network type ……….. 99
3.3 Heterogeneity by income groups ………100
A.1 Bunching Estimation for Non-exempt Firms at the MTS payment threshold using the standard bunching methodology ……….108
ix
LIST OF TABLES
Table
1.1 Corporate Income Tax Rates and Tax Bases under Regimen Optativo ………. 47
1.2 Summary Statistics for Firms under Regimen Optativo ……….. 48
1.3 Incentives to misreport the gross margin by firms’ cost structure and profitability …... 49
2.1 Fixed-Effects Model Estimation ……… 70
2.2 Fixed-effects model estimation, by per capita income classification ………. 71
2.3 Fixed-Effects Model Estimation with Instrumental Variables ……….. 74
2.4 Dynamic Panel Estimation (Arellano-Bond) ………. 75
2.5 Dynamic Panel Estimation (Arellano-Bover/Blundell-Bond) ……… 76
2.6 Fixed Effects Model Estimation with Average Lagged GDP Values in Dependent Variable ………. 77
3.1 Marginal Income Tax Rates Before and After the 2013 Fiscal Reform ………101
3.2 Summary Statistics for Firms under Regimen General and Regimen Optativo ……….101
3.3 Summary baseline difference-in-difference estimates, by network type ………102
A.1 Estimated evasion responses at the MTS payment threshold using Non-exempt firms to derive the counterfactual density distribution ………108
B.1 List of countries included in the analysis ………..……….109
C.1 Baseline difference-in-difference estimates ………..………110
x
LIST OF APPENDICES
APPENDIX A. Supplementary material for Chapter 1 ………...………..………. 103
A.1. Model with turnover and cost misreporting ………. 103
A.1.1. Profit maximization under a pure profits tax ………. 103
A.1.2. Profit maximization under a turnover tax ……….. 104
A.1.3. Profit maximization under a minimum tax ……… 104
A.2. Optimality conditions under Regimen Optativo ………..……… 106
A.3. Supplementary figures and tables for Chapter 1 ..………..……….. 108
APPENDIX B. Supplementary material for Chapter 2 ..………... 109
B.1. Supplementary figures and tables for Chapter 2 ……….. 109
APPENDIX C. Supplementary material for Chapter 3 ………..………... 110
xi ABSTRACT
The three chapters presented in this dissertation focus on fiscal issues affecting developing countries. Low tax revenue collection, weak enforcement capabilities, high levels of tax evasion, inefficient tax system design, and reactive handling of contingent liabilities –such as natural disasters–, are characteristics commonly observed in countries across the developing world. In the analyses presented here, I study some of these issues and seek to contribute to their understanding through new empirical evidence.
Chapter 1: Minimum taxes are attractive to governments because under such regimes evasion incentives are expected to be lower than under profit taxation. Until recently, this type of policies was considered suboptimal from a social welfare perspective. The present analysis focuses on the Guatemalan corporate income tax regime faced by firms registered in Regimen Optativo. The empirical evidence shown in this chapter suggests strong firm responses to the minimum tax and to its exemption rule, most of which seem in accordance with evasion behavior. Upper-bounds for average reported profits are estimated to be as low as 42% of actual firms’ profits, implying an evasion rate of 58% in the absence of the minimum tax scheme. These results are consistent with the view that minimum taxes can be an effective mechanism to lower tax evasion in environments with limited enforcement capabilities.
Chapter 2: This chapter analyses the fiscal impact of extreme weather events. While the literature analyzing the economic incidence of natural disasters has mainly focused on their macroeconomic consequences, the fiscal dimension of this problem remains relatively neglected. Due to their
xii
adverse effect on the economy, extreme weather events tend to reduce government revenues and increase public expenditure, creating a negative pressure on the budget balance. According to the results shown in this chapter, the occurrence of at least one extreme weather event is associated with an increase in the budget deficit between 0.4% and 0.9% of GDP. This impact comes primarily from an immediate reduction in government revenues, as a percentage of GDP, with some evidence pointing out to a lagged effect on public expenditure two years after the event. The analysis also shows that the fiscal effect is larger for low-income and lower-middle income countries but is not significant for high-income and upper-middle income countries.
Chapter 3: This chapter explores the consequences of having two co-existing corporate income tax regimes within a domestic tax system. This scenario is interesting because, in such environments, a simple theoretical model predicts an optimal strategy involving tax arbitrage through income shifting across regimes. The empirical exercise focuses on the case of Guatemala, where firms choose between a regime that taxes profits –Regimen Optativo–, and a regime that taxes turnover
–Regimen General–. Following a difference-in-difference approach, where treatment and control
groups are defined by whether firms belong to a tax arbitrage network or not, the results show differential behavior between the two groups. Firms that do not belong to a tax arbitrage network faced a decrease of around one percentage point more than the treatment group in the probability of registering in Regimen General after the reform. Despite their consistency with the theoretical predictions, it is acknowledged that these results should only be interpreted as indirect evidence of profit shifting and the existence of tax arbitrage networks in Guatemala.
1
CHAPTER 1
Firms’ (mis)reporting under a minimum tax: Evidence from Guatemalan
corporate tax returns
1.1. Introduction
It is well documented that, despite similar statutory tax rates, developing countries have relatively low tax revenues in comparison to the developed world. For instance, in 2010 the average tax-to-GDP ratio in low income countries was 13.0%, in contrast with the OECD mean of 35.4%. The difference is particularly striking when comparing income tax collection, which represented 12.9% of GDP in OECD countries, while only reaching 3.5% in low income countries (IMF, 2011). Such a reality points at significant limitations in the ability of developing countries to collect taxes, and several studies have discussed different dimensions of this problem, including informality and tax evasion (e.g. Gordon and Li, 2009; IDB, 2013; Beasly and Persson, 2014).
This paper studies firm behavior under a minimum tax scheme in the context of a developing country. Minimum taxes are a form of taxation that calculates the amount a taxpayer owes using alternative bases (e.g. profits, turnover), levying the largest liability of the two. These schemes are attractive to governments in advanced and developing economies because under such regimes evasion incentives are expected to be lower than under profit taxation, hence increasing
2
tax collection.1 Until recently, this type of policies was considered suboptimal from a social welfare perspective, due to their distortionary nature. However, new research has shed some light into this issue (Best et al., 2015).
The specific focus of this paper is the Guatemalan corporate income tax regime faced by firms registered in Regimen Optativo. This regime features a minimum tax scheme in which firms pay the largest tax liability between a tax on profits and a tax on turnover. As shown in the paper, the kink in the tax liability function created by this policy induces bunching behavior among firms, which allows for the identification of evasion responses (Saez, 2010; Chetty et al., 2011). Moreover, Regimen Optativo also features an exemption rule, based on the firm’s cost structure, as well as no loss carryforward. The former trait causes a firm-specific upward notch in the tax liability function, while the latter generates an additional kink, similar to the one provoked by the minimum tax.2 The differentiated misreporting incentives that arise as a result of these kinks and notch provide helpful variation, which is exploited in the paper to identify behavior consistent with evasion strategies.
The present study contributes to the growing literature focusing on firms’ behavior in developing countries in three ways. First, it focuses on the analysis of exemption rules and their impact within the framework of a minimum tax scheme. To the best of the author’s knowledge, a systematic approach to this issue has not been attempted in any previous studies. Using previously unexplored Guatemalan administrative data, the empirical analysis demonstrates that firms react
1 Some examples include Bolivia, Cambodia, Cameroon, Chad, Colombia, Dominican Republic, El Salvador, Gabon, Guatemala, Honduras, Hungary, India, Ivory Coast, Liechtenstein, Madagascar, Mauritius, Nicaragua, Nigeria, Pakistan, Panama, Republic of the Congo, Senegal, Slovakia, South Korea, Tanzania, and the United States. (see Price-Waterhouse-Coopers, 2014).
2 In this context, a kink occurs when there is a discontinuous change in the tax rate, but not in the tax liability. Instead, a notch represents a discontinuous change in the level of the tax liability.
3
strongly to the incentives created by this type of notch, strategically misreporting specific cost categories to become exemption-eligible. Second, this paper provides new empirical evidence in support of the use of minimum taxes as a tool to increase tax revenue. Estimates obtained from bunching analysis suggest that the minimum tax induces firms to reduce misreporting, as a proportion of reported profits, by as much as 137%. Third, the paper exploits the no loss carryforward rule of Regimen Optativo to derive a method that allows the estimation of upper bounds for the ratio of reported-to-actual profits. According to these calculations, firms report, on average, no more than 42% of their true profits in the absence of the minimum tax scheme. This number implies that evasion arising from profit misreporting would be at least 58% of actual profits if this scheme was not in place. The large estimated rate of evasion is consistent with other estimates found in the literature for developing countries.3
The rest of the paper is structured as follows. Section 2 introduces the theoretical model used throughout the analysis. Section 3 provides a description of the Guatemalan income tax and the dataset. Section 4 discusses the methodology which guides the empirical analysis, with results presented in Section 5. Finally, the conclusions of the paper are summarized in Section 6.
1.2. Theoretical Model
This section develops the theoretical framework needed to understand a minimum tax scheme, as well as the implications of introducing an exemption rule into this setup. It starts by separately describing optimal firm behavior under a pure profit tax and a turnover tax. Then, building on
3 For instance, Bachas and Soto (2017) estimate that evasion could be as large as 70% of actual firm profits in the case of Costa Rica. Similarly, Pecho et al. (2012) present estimates of income tax non-compliance in Latin America ranging between 34.5% and 72%.
4
those cases, it presents a model where firms face a minimum tax. Finally, the model is expanded to account for the introduction of an exemption rule.
1.2.1. Profit maximization under a pure profits tax
The basic model used in this paper is an extension of the canonical income tax model (Allingham and Sandmo, 1972) in which firms maximize profits, taking into account a tax liability function, as well as the expected benefits and costs of evasion. The tax liability faced by firms, 𝑇(𝑦, 𝑐̂), depends on output 𝑦 and reported cost 𝑐̂. 4,5 As is common in the literature, the model assumes that firms face total costs 𝑐(𝑦) that are a convex function of output; private costs of evasion ℎ(𝑐̂ − 𝑐(𝑦)) that are a convex function of misreported cost; and, as is the case in the developing world, imperfect enforcement.6 Hence, the firm’s problem is,
max
𝑦,𝑐̂ 𝑦 − 𝑐(𝑦) − 𝑇(𝑦, 𝑐̂) − ℎ(𝑐̂ − 𝑐(𝑦)). (1)
For the case of a pure profits tax with a marginal rate 𝜏𝜋, the tax liability function becomes 𝑇(𝑦, 𝑐̂) = 𝜏𝜋(𝑦 − 𝑐̂). The key feature of such a scheme is that firms can fully deduct costs from their turnover, in order to determine their taxable income. The firm’s first order conditions for an interior solution are,
𝑐′(𝑦)[1 − ℎ′(𝑐̂ − 𝑐(𝑦))] = 1 − 𝜏𝜋 (2)
4 The terms output and turnover are used interchangeably in this study. This follows from a normalization of the price level, which simplifies the exposition of the problem.
5 For simplicity, firms can only misreport cost in this framework. However, the model can be extended to account for turnover misreporting without changing the basic results presented in this section. See the appendix to this chapter for a model with such a representation.
6The choice of the private costs of evasion as a convex function of misreported cost, ℎ(𝑐̂ − 𝑐(𝑦)), mirrors the typical penalty structure observed in many tax systems around the world. Moreover, it also replicates the penalty structure of the Guatemalan tax system, which will be the subject of analysis in the empirical section.
5
ℎ′(𝑐̂ − 𝑐(𝑦)) = 𝜏𝜋. (3)
Optimal evasion is governed by equation (3), which indicates that firms will engage in tax evasion by misreporting costs, up to the point where the marginal cost of doing so equals the tax rate.7 Furthermore, in this simplified model, combining equations (2) and (3) yields,
𝑐′(𝑦) = 1. (4)
This condition implies that a pure profits tax is non-distortionary, since the determination of the optimal output level is independent of the tax rate.8 Therefore, under this scheme, if the government decides to increase the tax rate, firms will react by adjusting their level of cost misreporting, 𝑐̂ − 𝑐(𝑦), without altering their output decision. In other words, any observed behavioral response would map directly to a change in the firm’s evasion pattern, as there is no real (i.e. output) response in this framework.
1.2.2. Profit maximization under a turnover tax
An alternative approach to profits taxation often observed in developing countries is turnover taxation. The main difference with the pure profits tax setting is that this type of taxation does not allow for costs deduction. In this context, the tax liability function takes the form 𝑇(𝑦, 𝑐̂) = 𝜏𝑦𝑦, where 𝜏𝑦 represents the tax rate on turnover. The first order conditions for an interior solution to this problem are,
7 The dependence of the level of misreporting on the tax rate relies on the specification of ℎ(𝑐̂ − 𝑐(𝑦)), as discussed in the literature (Yitzhaki, 1974; Cremer and Gahvari, 1994; Slemrod and Yitzhaki, 2002). The result in equation (3) is consistent with a setting in which the probability of detection is an increasing function of the evaded amount. It is also consistent with a scenario in which there are variable costs of evasion on top of the expected penalty incurred if caught by the tax authority.
8 The characterization of a profit tax as non-distortionary is used for tractability. However, this is not in agreement with the empirical evidence. See Auerbach et al. (2008) for an example of this literature.
6
𝑐′(𝑦)[1 − ℎ′(𝑐̂ − 𝑐(𝑦))] = 1 − 𝜏𝑦 (5)
ℎ′(𝑐̂ − 𝑐(𝑦)) = 0, (6)
which together imply,
𝑐′(𝑦) = 1 − 𝜏𝑦. (7)
Contrary to the pure profits tax, a turnover tax has a distortionary effect, as equation (7) relates the optimal output level to the tax rate. As a consequence, a firm under this tax regime will produce less output than under a profit tax. Moreover, the firm will not engage in tax evasion via cost misreporting, as the marginal benefit of this action would be zero.9
1.2.3. Profit maximization under a minimum tax
The previous two cases serve as the foundation for the analysis of firm behavior under a minimum tax scheme (MTS). These types of schemes find their rationale in the fact that firms have no incentives to misreport costs whenever they face a turnover tax, hence, reducing evasion.10
A typical minimum income tax liability function has the form,11
𝑇(𝑦, 𝑐̂) = max{𝜏𝜋(𝑦 − 𝑐̂), 𝜏𝑦𝑦}. (8)
9In this model, the possibility of turnover misreporting is ignored for simplicity. See the appendix to this chapter for a model that incorporates this margin of evasion. The main results are unchanged, as turnover misreporting also decreases with respect to its level under a profit tax, as long as the tax rate on turnover is lower than the tax rate on profits.
10 The cost of reducing evasion using a minimum tax comes from the distortion to production incentives. Nonetheless, Best et al. (2015) show that minimum taxes can be more socially efficient than profit taxes in environments with low enforcement.
11 Examples of this type of tax liability function are provided by Best et al. (2015) for the case of Pakistan, and Mosberger (2016) for the case of Hungary. In the empirical section, the Guatemalan corporate tax regime will be added to this list, but there are many other similar schemes around the world.
7
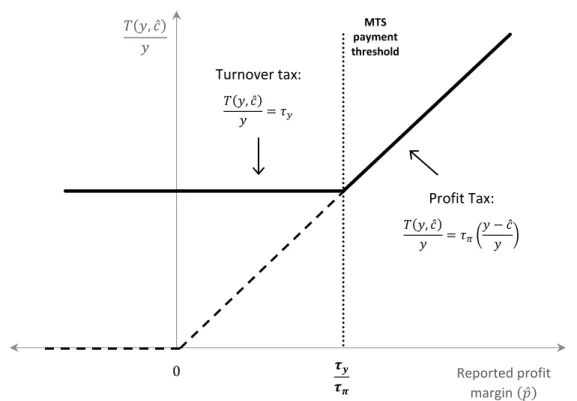
Equation (8) indicates that a firm faces the largest tax liability between a profit tax and a turnover tax. For a given combination of output and reported cost, (𝑦, 𝑐̂), the two liabilities are equal when,
𝜏𝜋(𝑦 − 𝑐̂) = 𝜏𝑦𝑦 ⇔ 𝑝̂ ≡ (𝑦−𝑐̂)
𝑦 = 𝜏𝑦
𝜏𝜋. (9)
Here, 𝑝̂ is known as the reported (pre-tax) profit margin. The value 𝜏𝑦⁄𝜏𝜋 –referred to as the MTS payment threshold, from this point onwards– defines which tax liability is higher. Firms reporting a profit margin lower than the MTS payment threshold face a turnover tax, while those reporting a larger profit margin are required to pay a tax on profits. This means that the incentives for a profit-maximizing firm change depending on whether it locates to the left or the right of the MTS payment threshold. Figure 1.1 provides a graphical representation of how a minimum tax scheme works.
In order to have a better understanding of how firm behavior is affected by a minimum tax, let us suppose that we start in a scenario with a pure profit tax. Under this regime, a firm with a reported profit margin below the MTS threshold would locate on the profit tax liability function (dashed line), as shown by point A in Figure 1.2.12 At that point, there is no tax distortion to output and evasion is positive, in line with equations (3) and (4). If the tax regime suddenly changed to a minimum tax scheme, the firm would face a higher tax liability. Before accounting for any response, the firm would find itself at point B in the figure. However, given the new tax incentives, the firm will respond by decreasing output and reducing evasion, in accordance with equations (6) and (7). As a result, the firm’s reported profit margin will increase, and the firm will locate at
12Throughout this paper, the term “tax liability function” may also be used (imprecisely, admittedly) to refer to the function 𝑇(𝑦, 𝑐̂)/𝑦. This is mainly done so when describing the tax liability function as a proportion of turnover in the different figures presented in the study.
8
point C.13 In aggregate, firms’ responses will create bunching in the density distribution at the MTS threshold, as illustrated in Panel (b) of Figure 1.2.
Contrary to the case shown in Figure 1.2, firms with an initial reported profit margin above the MTS payment threshold will not show any behavioral response. This is because their incentives remain unchanged after the introduction of the minimum tax scheme. Thus, under the new regime, the overall tax revenue gains from lower evasion, as well as the efficiency costs from distorting production, are all coming from firms with an initial reported profit margin below the MTS payment threshold.
1.2.4. Implications of adding an exemption rule to the MTS
An implicit assumption of the minimum tax framework developed above is that all firms are required to pay the minimum tax, provided that their profit margin lies below the MTS payment threshold. However, in practice, it is not uncommon to find schemes that exempt a group of firms from facing the minimum tax. As it is shown below, accounting for exemption rules is important because of their effect on tax incentives. When an exemption rule is available, firms take into consideration their eligibility prospects at the time of making output and evasion decisions.
The previous model can be expanded to account for the effects of an exemption rule. Let 𝜃 be a binary parameter that defines whether a firm is exempt or not, with 𝜃 = 1 if the firm is eligible for a minimum tax exemption, and 𝜃 = 0 if the firm is non-exempt. The tax liability function under this scheme is,
13 The reported profit margin can be written as 𝑝̂ =𝑦−𝑐(𝑦)
𝑦 −
𝑐̂−𝑐(𝑦)
𝑦 . The first term corresponds to the firm’s “true” profit margin and is decreasing in output under the assumption of decreasing returns to scale. The second term captures the evasion component and is increasing in misreported cost. Thus, if a firm reduces both its output and misreported cost, its reported profit margin will increase.
9
𝑇(𝑦, 𝑐̂) = 𝜃𝜏𝜋(𝑦 − 𝑐̂) + (1 − 𝜃) max{𝜏𝜋(𝑦 − 𝑐̂), 𝜏𝑦𝑦}. (10)
Equation (10) is equivalent to equation (8) whenever a firm is non-exempt, and it reverts into a pure profits tax if a firm is exempt.
In order to fully appreciate the implications of the new setup on the tax liability function, it is convenient to consider different specifications of this exemption rule. The next subsections will analyze two broad categories of exemption rules, which create a notch in the tax liability function.
1.2.4.1. Exemption rules that create an upward notch in the tax liability function
Suppose, for simplicity, that the government defines the exemption rule according to the following condition, 𝜃 ≡ { 0, 𝑦−𝑐̂ 𝑦 > 𝜑 1, 𝑦−𝑐̂ 𝑦 ≤ 𝜑. (11)
This definition indicates that firms are exempt if their profit margin is less or equal to an exogenous value 𝜑 –the MTS exemption threshold–, but are non-exempt otherwise.14
It is useful to point out that equation (11) provides a condition that is similar in nature to equation (9), insofar it relates the MTS exemption threshold to the profit margin.15 However, both conditions differ in a fundamental manner. One way to think about the separate roles of the MTS exemption and payment thresholds is to view the former as a parameter defining the intention to
14 The specification of this exemption rule is based on a simplified version of the Guatemalan case, which is analyzed in the empirical section.
15 The use of the profit margin in equation (11) to define the exemption rule is deliberate. In practice, these rules may not be stated in terms of the profit margin. However, the basic results of this section remain the same, as long as there is a mapping between the statistic that defines the exemption rule and the profit margin.
10
treat, and the latter as the actual treatment determinant. For instance, a firm with a reported profit margin above the MTS exemption threshold will be non-exempt, but it will only pay the minimum tax if its profit margin is below the MTS payment threshold. On the other hand, a firm with a reported profit margin below the MTS exemption threshold is, by definition, exempt, which means it is not subject to pay the minimum tax, independently of whether its profit margin lies above or below the MTS payment threshold.
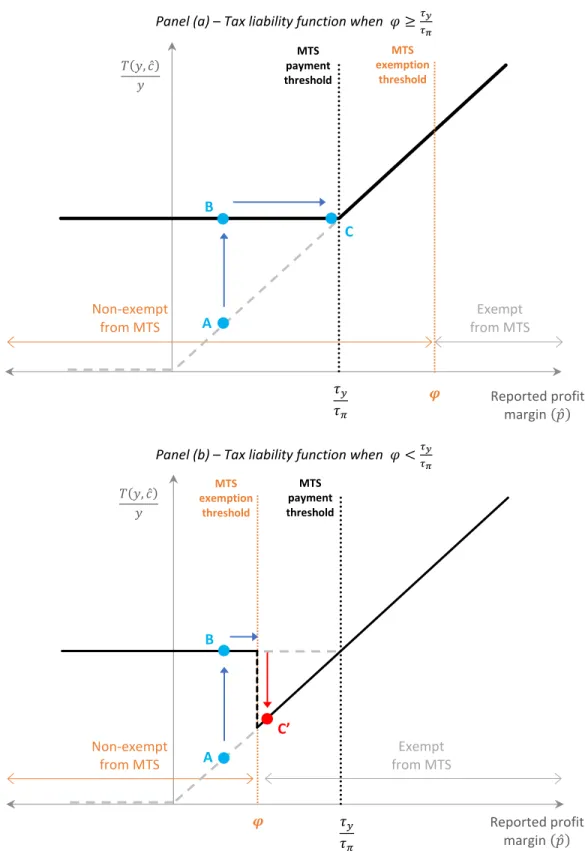
Figure 1.3 illustrates the consequences of such an exemption rule on the shape of the tax liability function. There are two cases to consider, each depending on how the MTS exemption threshold relates to the MTS payment threshold. Panel (a) shows that when 𝜑 ≥𝜏𝑦
𝜏𝜋 the tax liability function reverts to that of a pure profits tax. This occurs because all firms that would be subject to pay the minimum tax are exempt from doing so, rendering the MTS payment threshold irrelevant.16 The second case arises when 𝜑 <𝜏𝑦
𝜏𝜋 and is depicted in panel (b). In this situation, there is an upward notch in the tax liability function exactly at the MTS exemption threshold. Firms with a profit margin below 𝜑 avoid the minimum tax, but those with a higher profit margin must pay it if they also lie to the left of the MTS payment threshold.
Clearly, in both cases the existence of an exemption rule has important implications on the impact of a minimum tax scheme on firm behavior. For instance, a firm facing the tax liability function in panel (a) will not have incentives to bunch at the MTS payment threshold. However, if it faces the tax liability function in panel (b), the firm will evaluate its best alternative –that which maximizes after-tax profits– between two options. The first one is to respond to the kink at
16 In this highly stylized framework, this case seems trivial, as no government would create an exemption rule that effectively dismantles their minimum tax scheme. However, in practice, the MTS exemption threshold can be firm-specific, when considered in terms of the profit margin. The Guatemalan minimum tax scheme analyzed in the empirical section provides an example where this is the case.
11
the MTS payment threshold, in which case the firm will follow the path from points A to C, increasing its reported profit margin. A firm choosing this path will bunch at the MTS payment threshold in the same fashion as in Figure 1.2. The second alternative is to respond to the notch at the MTS exemption threshold. If it chooses to do so, the firm will adjust its output and evasion choices so that its reported profit margin drops to point C’, where the firm is now exempt from paying the minimum tax. In this latter case, firms will bunch to the left of the MTS exemption threshold.17
1.2.4.2. Exemption rules that create a downward notch in the tax liability function
Now, let us consider an alternative case, where the government inverts the exempt and non-exempt groups by defining the rule as follows,
𝜃 = { 0, 𝑦−𝑐̂ 𝑦 < 𝜑 1, 𝑦−𝑐̂ 𝑦 ≥ 𝜑. (12)
Contrary to (11), in this setting firms are exempt from the minimum tax scheme if their profit margin is greater or equal to the MTS exemption threshold, 𝜑, but remain non-exempt otherwise.18 The implications of this simple change in the eligibility rule are presented in Figure 1.4.
As in the case of the previous subsection, there are two cases to consider. Panel (a) shows that when 𝜑 ≥𝜏𝑦
𝜏𝜋 the MTS tax liability function remains unaffected by the exemption rule. This is because all the exempt firms are to the right of the MTS payment threshold, meaning that they
17 For cases where the MTS exemption threshold is firm-specific in terms of the reported profit-margin, as in the empirical section, this bunching will not be evident in the corresponding density distribution. This occurs because every firm faces the notch at a different value of the profit margin.
12
did not have to pay the minimum tax even in the absence of the exemption rule.19 Panel (b) presents the case when 𝜑 <𝜏𝑦
𝜏𝜋 . In this scenario, there is a downward notch in the tax liability function exactly at the MTS exemption threshold. Firms with a reported profit margin below 𝜑 are non-exempt and face the minimum tax, but those with a higher profit margin are exempt. While firms in panel (a) have incentives to bunch at the MTS payment threshold, moving from points A to C, those in panel (b) face incentives to bunch at the MTS exemption threshold, repositioning from points A to C’.
1.3. Context and Data
1.3.1. Guatemalan income tax and minimum tax scheme
As mentioned earlier in this study, one of the reasons why the analysis of taxpayer behavior is important for developing countries is their persistently low tax revenues. Guatemala represents an example of this reality. With a tax-to-GDP ratio averaging 11% in recent years –of which income tax is only about 2% of GDP–, the difficulties surrounding tax collection are a central aspect of the country’s fiscal policy. Evasion levels are believed to be high, given the legal and financial limitations of the tax authority, with some estimates placing the rates of noncompliance for income tax and VAT around 40% and 35%, respectively (ICEFI, 2015).
Guatemala’s corporate income tax law allows taxpayers to choose between two schemes,
Regimen General and Regimen Optativo, with the former being a tax on turnover and the latter a tax on profits with a minimum tax (i.e. a minimum tax scheme of the type shown in section 2).
19 As was the case of panel (a) in Figure 1.3, this seems trivial, as no government would be expected to implement an exemption rule that has no relevance. Nevertheless, this can occur inadvertently for some firms if the MTS exemption threshold is firm-specific, when expressed in terms of the profit margin. The Hungarian exemption rule to their minimum tax scheme provides an example of such a setup.
13
According to data from Superintendencia de Administración Tributaria (SAT), Guatemala’s tax authority, approximately 60% of corporate income tax is collected from Regimen Optativo
(Franco, 2011).
In this paper, the analysis is restricted to firms filing under Regimen Optativo. In this regime, firms must pay a tax on profits, with a marginal rate of 31%, if their reported profit margin is at least 3% of reported turnover. Firms reporting a profit margin below this threshold, pay a minimum tax equivalent to 0.93% of their turnover.20 Additionally, there is an exemption rule based on a firm’s reported gross margin,a measure that subtracts the direct cost of goods sold (COGS) from turnover but does not consider the costs of services sold.21 Firms with a gross margin larger than 4% of turnover are non-exempt, while firms with a lower gross margin are eligible to claim the exemption. In order to fully obtain the exemption, qualified firms must also submit a series of legal and accounting documents at least two months before the filing deadline for annual income tax returns.22
Finally, it is important to remark that Guatemala’s corporate income tax regimes do not allow loss-carryforward. Table 1.1 summarizes the main features of corporate income taxation under Regimen Optativo.
1.3.2. Data
20 The tax rate on profits and the minimum tax changed after 2012, following a tax reform. The data used in this analysis is unaffected by these adjustments, as it does not cover the post-reform period.
21 The gross margin is regarded as a measure of how a firm’s productioncosts relate to its turnover. The cost of goods sold (COGS) refers to the direct costs attributable to the production of the goods sold by a company. This amount includes the cost of the materials used in creating the good along with the direct labor costs used to produce the good. It excludes indirect expenses such as distribution costs and sales force costs.
14
The data used in this paper comes from a novel panel database of Guatemalan tax administrative records. This dataset contains the universe of corporate income tax returns filed annually under
Regimen Optativo for the years 2006 to 2012. Since the units of analysis in this paper are all firms filing in this regime, individual taxpayers are not considered in the sample.
Consistency checks were carried out to ensure basic reliability of the data, which resulted in some observations being dropped. Firms reporting revenues from exports are not considered due to the impossibility to distinguish which of them are eligible for income tax exemption under Guatemalan tax law.23The total number of observation points remaining after filtering is 133,122, which corresponds to an average of about 19,000 firms per year. Table 1.2 provides summary statistics for the final sample under analysis.
1.4. Empirical Strategy
Based on the theoretical framework developed earlier in this paper, this section adapts the model to the case of the Guatemalan corporate income tax scheme. It starts by describing the scheme’s tax liability function and exemption rule in a form comparable to those shown in Section 2. Then, it analyzes the expected behavioral responses of firms in this setting, yielding a set of testable predictions from the model. Finally, it describes the bunching methodology used to estimate firms’ responses from the empirical data.
1.4.1. Tax liability function and exemption rule under Regimen Optativo
In terms of the model described in Section 2, the main features of the Guatemalan minimum tax scheme can be incorporated into a tax liability function with the following form,
15 𝑇(𝑦, 𝑐̂𝐶𝑂𝐺𝑆, 𝑐̂𝑜) = 𝜃 max{𝜏𝜋(𝑦 − 𝑐̂𝐶𝑂𝐺𝑆− 𝑐̂𝑜), 0} + (1 − 𝜃) max{𝜏𝜋(𝑦 − 𝑐̂𝐶𝑂𝐺𝑆− 𝑐̂𝑜), 𝜏𝑦𝑦} (13) where, 𝜃 ≡ { 0, 𝑦−𝑐̂𝐶𝑂𝐺𝑆 𝑦 > 4% 1, 𝑦−𝑐̂𝐶𝑂𝐺𝑆 𝑦 ≤ 4%. (14)
Here, the variable 𝑐̂𝐶𝑂𝐺𝑆 incorporates the firm’s reported cost of goods sold (COGS), while the variable 𝑐̂𝑜 ≡ 𝑐̂ − 𝑐̂𝐶𝑂𝐺𝑆, referred to as “other” costs, is defined as the difference between total reported costs and reported COGS. Notice that, in the first term of equation (13), the inability of exempt firms to carry forward net operating losses creates, in practice, a kink in the tax liability function at 𝑝̂ = 0.24 The second term of the tax function in equation (13) describes the tax liability faced by non-exempt firms. As in the theoretical framework, this term generates a kink at the MTS payment threshold, which in this context occurs at 𝑝̂ = 𝜏𝑦⁄𝜏𝜋 = 0.93%/31% = 3%.
A feature of the exemption rule in equation (14) is that it is expressed in terms of the reported gross margin, 𝑔̂ ≡𝑦−𝑐̂𝐶𝑂𝐺𝑆
𝑦 . However, in order to reconcile this rule with the theoretical framework, equation (14) needs to be considered in terms of the profit margin, which is the statistic that matters to determine the tax base. This transformation yields,
𝜃 = { 0, 𝑦−𝑐̂𝐶𝑂𝐺𝑆−𝑐̂𝑜 𝑦 > 4% − 𝑐̂𝑜 𝑦 1, 𝑦−𝑐̂𝐶𝑂𝐺𝑆−𝑐̂𝑜 𝑦 ≤ 4% − 𝑐̂𝑜 𝑦 . (15)
24 The figures presented in Section 2 incorporated this feature; however, for simplicity, the equations representing the theoretical tax liability functions did not.
16
The key difference between equation (15) and equation (11) –its theoretical equivalent– is that, in this case, the MTS exemption threshold is firm-specific, as 𝜑(𝑦, 𝑐̂𝑜) = 4% −𝑐̂𝑜
𝑦. Therefore, firms for which 𝜑(𝑦, 𝑐̂𝑜) ≥ 3% will face a tax liability function as in panel (a) of Figure 1.3. Instead, for firms with 𝜑(𝑦, 𝑐̂𝑜) < 3%, a tax liability function of the type depicted in panel (b) of the same figure will apply.
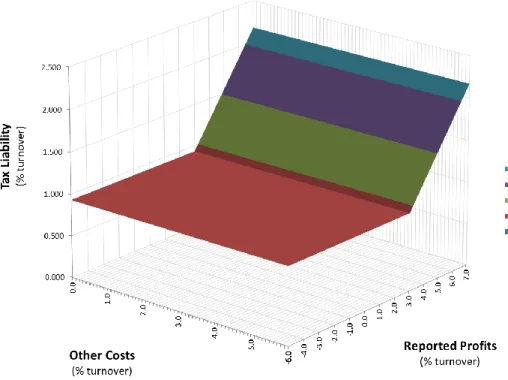
To facilitate the understanding of how a firm-specific MTS exemption threshold affects the tax function, it is helpful to see these features graphically. Figure 1.5 shows the implications of this exemption rule on the Guatemalan minimum tax scheme. Panel (a) depicts the tax liability function faced by firms, ignoring the effects of the exemption rule. The figure is equivalent to Figure 1.1, with a MTS payment threshold at 3%. On the other hand, panel (b) incorporates the relationship between the firm’s reported profit margin and its reported “other” costs, 𝑐̂𝑜, as implied by the exemption rule in equation (15). As it can be seen, the resulting tax function is somewhat complex. In terms of their cost structure, firms can be allocated into one of three groups.25 Firms with 𝑐̂𝑜
𝑦 ≤ 1% face a pure profits tax with a kink at 𝑝̂ = 0, created by the no loss carryforward rule. Those with 1% < 𝑐̂𝑜
𝑦 ≤ 4% face a kink at the MTS payment threshold, a notch at the firm-specific MTS exemption threshold, 𝜑(𝑦, 𝑐̂𝑜), and a second kink at 𝑝̂ = 0, which basically reproduce the tax liability function of panel (b) in Figure 1.3. Finally, firms with 𝑐̂𝑜
𝑦 > 4% only face a kink at the MTS payment threshold and a notch at 𝜑(𝑦, 𝑐̂𝑜), with the latter located at negative values of the firm’s reported profit margin. The substantial heterogeneity generated by this complex structure will be useful to corroborate the empirical results shown in later sections.
17 1.4.2. Firm behavior and testable predictions
Under Regimen Optativo, the basic firm’s problem can be written as,
max
𝑦,𝑐̂𝐶𝑂𝐺𝑆,𝑐̂𝑜 𝑦 − 𝑐𝐶𝑂𝐺𝑆(𝑦) − 𝑐𝑜(𝑦) − 𝑇(𝑦, 𝑐̂𝐶𝑂𝐺𝑆, 𝑐̂𝑜) − ℎ(𝑐̂𝐶𝑂𝐺𝑆− 𝑐𝐶𝑂𝐺𝑆(𝑦), 𝑐̂𝑜− 𝑐𝑜(𝑦)). (16)
In this setting, firms choose output, reported COGS and reported other costs to maximize their after-tax profits. The cost of evasion function, ℎ(𝑐̂𝐶𝑂𝐺𝑆− 𝑐𝐶𝑂𝐺𝑆(𝑦), 𝑐̂𝑜− 𝑐𝑜(𝑦)), considers misreporting of both types of cost.26 Allowing the total cost function to be expressed as 𝑐(𝑦) = 𝑐𝐶𝑂𝐺𝑆(𝑦) + 𝑐𝑜(𝑦), yields optimal responses in line with those of the theoretical model.27
Overall, three groups of testable implications can be considered. The first group relates to firms’ expected bunching at the kinks of the tax liability function. The second group results from the repercussions of the notch created by the exemption rule. A third group arises from the differentiated incentives to misreport faced by firms selling physical goods versus those selling services. All these sets of implications are discussed below.
1.4.2.1. Bunching at the kinks of the tax liability function
As shown in Figure 1.2, kinks in the tax liability function can lead to bunching when firms behave optimally. In the Guatemalan setting, there is two differentiated kink-induced responses expected from firms. On the one hand, non-exempt firms face a kink at the MTS payment threshold (i.e.
26 As in the theoretical framework, this specification ignores turnover misreporting. The model can be expanded to include this type of misreporting without altering its general conclusions.
27 This total cost specification assumes that a given firm can only produce a level of output, 𝑦, with a unique combination of COGS and other costs. While this assumption about the firm’s technology may be too restrictive in the long run, it seems plausible in the short run. For the full derivation of the model’s optimality conditions in this setup, see the appendix to this chapter.
18
𝑝̂ = 3%). On the other, exempt firms face the kink at 𝑝̂ = 0. Therefore, the two predictions arising from the existence of kinks in the tax liability function are the following:
Prediction 1 - Non-exempt firms will have incentives to bunch at 𝒑̂ = 𝟑%. As explained in the theoretical framework, non-exempt firms whose reported profit margin under a profit tax lies below 3% will respond to a minimum tax by decreasing both output and cost misreporting.28 This, in turn, increases the reported profit margin, causing bunching at the MTS payment threshold.
Prediction 2 - Exempt firms will have incentives to bunch at 𝒑̂ = 𝟎%. Contrary to the non-exempt group, exempt firms face a kink at 𝑝̂ = 0%. This is a consequence of the impossibility to engage in loss carryforward. Interestingly, from an analytical point of view this is equivalent to a minimum tax with a tax rate, 𝜏𝑦 = 0%, which implies that there is no real distortion as firms’ optimal output choice is guided by the condition 𝑐′(𝑦) = 1 − 𝜏𝑦 = 1. In other words, any observed bunching by exempt firms at the specified threshold cannot be caused by an output response; instead, it would be generated by the evasion response, thus providing direct evidence of firms’ cost misreporting behavior.29
1.4.2.2. Bunching at the MTS exemption threshold
Figure 1.5 illustrates how the exemption rule of Regimen Optativo generates a firm-specific notch in the tax liability function. This notch creates incentives for firms to misreport their gross margin, with the aim of becoming exemption-eligible and avoiding the minimum tax scheme. However,
28 Conditional on being non-exempt, a firm’s reported COGS and other costs are equivalent for tax purposes. Hence, there is no differentiated response in either, and a firm facing the minimum tax will reduce its cost misreporting in both margins.
29 In a model that allows turnover misreporting, the difference in interpretation is that the evasion response is composed of both turnover and cost misreporting. However, the no-real-response argument remains unaffected.
19
not all firms face the same misreporting incentives, as discussed earlier. Besides their cost structure, firms’ incentives are also affected by their reported profit margin.30 For instance, a firm with a reported profit margin larger than 3% has no incentives to misreport 𝑔̂, since their tax liability is the same whether it is exempt or non-exempt. However, if its reported profit margin is lower than 3%, there are two scenarios in which it will have incentives to misreport its gross margin. The first case is when the firm’s other costs are such that 4% ≥𝑐̂𝑜
𝑦 > 1% and their reported profit is positive; this corresponds to the middle quadrant in panel (b) of Figure 1.5. The second case occurs if the firm reports losses and its cost structure is such that 𝑐̂𝑜
𝑦 > 4%; a notch is also visible in the respective quadrant in panel (b) of Figure 1.5. Table 1.3 summarizes firms’ incentives to misreport the gross margin according to their profitability and cost structure.
The heterogeneity of incentives to misreport the gross margin provides a valuable source of testable implications of the model. The predictions derived from this framework are:
Prediction 3 - Firms with incentives to misreport their gross margin will bunch at 𝒈̂ = 𝟒%. As discussed above, firms located in quadrants where there is a notch will have incentives to misreport their gross margin. These firms will tend to bunch below 𝑔̂ = 4% in order to avoid payment of the minimum tax.
Prediction 4 - Firms with no incentives to misreport their gross margin, will not bunch at this threshold at 𝒈̂ = 𝟒%. In contrast to the previous group, firms located in quadrants where there is no notch face no incentives to misreport their gross margin. Hence, this group serves as a placebo test, as firms should not bunch at 𝑔̂ = 4%.
20
1.4.2.3. Differentiated behavior of merchandise and services firms
An additional implication of the minimum tax exemption rule is that firms selling physical goods –referred to as merchandise firms from here onwards– are more likely to engage in misreporting of the gross margin, in comparison to firms selling services. This is because, in the Guatemalan context, the gross margin only takes into consideration the direct costs of producing physical goods, but it does not include the costs of producing services.31 Thus, it is expected that, on average, merchandise firms will have a lower gross margin than services firms. This means that, for a given profit margin, merchandise firms are expected to be closer to the MTS exemption threshold than services firms. This leads to the following prediction:
Prediction 5 - Merchandise firms will show stronger bunching at 𝒈̂ = 𝟒% than services firms. For any given profit margin, merchandise firms will have, on average, a smaller gross margin. Hence, for merchandise firms with an initial gross margin above 4%, the additional COGS misreporting needed to cross the MTS exemption threshold is smaller than that required by services firms. Given the resulting difference in the marginal and total cost of misreporting, merchandise firms are expected to have a stronger response to the notch created by the MTS exemption, in comparison to services firms.
Since it is expected that firms engage in cost misreporting, Prediction 5 cannot be tested directly. This is because the actual values of COGS and other costs are not observable. Therefore, the analysis uses an instrument to separate firms into those likely to have a high ratio of COGS (i.e. lower gross margin before misreporting) and those expected to have a low one. The
21
instrument used exploits the availability of detailed information on the sources of turnover, with firms categorized as either merchandise or services, as follows:
• Merchandise firms - Firms reporting sales of physical goods equivalent to more than 80% of total turnover are considered in this category.32 Given their business focus, a large proportion of total costs coming from either production or inventory costs would be expected. Hence, it is likely that these group of firms will run a high COGS ratio before misreporting occurs.
• Services firms - Firms reporting sales coming from services provision amounting to more than 80% of turnover are selected in this category. Due to the nature of their activities, a small proportion of physical goods production or inventory costs would be expected. As a result, these firms are assumed to have a low COGS ratio before any misreporting takes place.
1.4.3. Methodology for the estimation of bunching responses
The existence of kinks and notches allows for the use of bunching techniques to identify firms’ responses (Saez, 2010; Chetty et al., 2011; Kleven and Waseem, 2013). In the specific case of a minimum tax scheme, Best et al. (2015) show that firms’ responses can be decomposed into an output and an evasion component. This paper uses their method to obtain estimates of those margins of response.
Let us express the reported profit margin as,
32 This percentage is arbitrary. However, robustness checks were carried out for both types of firms, with values ranging from 51% to 90%. No significant changes in the results were observed.
22
𝑝̂ =𝑦−𝑐(𝑦)
𝑦 −
(𝑐̂−𝑐(𝑦))
𝑦 , (17)
where the first term in the right-hand side encapsulates the firm’s true profit margin, while the second term captures cost misreporting.33 When ∆𝑝̂ is small the above decomposition can be used to totally differentiate 𝑝̂ and obtain,
∆𝑝̂ = 𝜕𝑝̂ 𝜕𝑦𝑑𝑦 + 𝜕𝑝̂ 𝜕(𝑐̂ − 𝑐)𝑑(𝑐̂ − 𝑐) = (𝑐̂ 𝑦− 𝑐′(𝑦)) 𝑑𝑦 𝑦 − 𝑑(𝑐̂ − 𝑐) 𝑦 = ((1 − 𝑝̂) − 1)𝑑𝑦 𝑦 − 𝑑(𝑐̂ − 𝑐) 𝑦 ≈ 𝜏𝑦 2 𝜏𝜋 𝜀𝑦− 𝑑(𝑐̂ − 𝑐) 𝑦
The third row in the previous expression follows from the definition of the reported profit margin and the firm’s optimality condition for output. The fourth row approximation arises from realizing that
𝑝̂ ≅𝜏𝑦
𝜏𝜋 in the vicinity of the MTS payment threshold, as well as from the definition of the elasticity of output with respect to the net-of-tax rate,
𝜀𝑦 ≡ 𝑑𝑦 𝑦⁄
𝑑(1 − 𝜏) (1 − 𝜏)⁄
where the fact that 𝑑(1−𝜏)
(1−𝜏) = −𝜏𝑦 when crossing the kink is also used. 34
33 As this decomposition will be used to obtain response estimates for non-exempt firms, there is no need to distinguish between COGS and other costs.
34 The basic idea is that, to the right of the MTS payment threshold, the effective tax rate on output is zero because costs are fully deductible (i.e. there is no output distortion); however, to the left of the threshold, output is taxed at a rate 𝜏𝑦. See Best et al. (2015) for further details.
23
The usefulness of the approximation above is that it allows us to separate the output and evasion responses. The first term in the right-hand side captures the real response as a proportion of the elasticity of output. The decomposition shows that this term will be relatively insensitive to
the output elasticity, as 𝜏𝑦 2
𝜏𝜋 will be a very small value.
35 The second term absorbs the evasion
response, as a proportion of turnover. This latter term can be converted to a ratio of reported profits as follows, 𝑑(𝑐̂ − 𝑐) 𝑦 = ( 𝑦 − 𝑐̂ 𝑦 ) 𝑑(𝑐̂ − 𝑐) 𝑦 − 𝑐̂ ≈ ( 𝜏𝑦 𝜏𝜋) 𝑑(𝑐̂ − 𝑐) 𝑦 − 𝑐̂
In order to obtain empirical estimates using the previous decomposition, an estimate of the change in the reported profit margin is required. This estimate can be calculated from the excess mass observed at the bunching point. Following Saez (2010), when the bunching response, 𝐵, is local we can approximate the change in the reported profit margin as,
𝐵 ≈ ∆𝑝̂ 𝑓0( 𝜏𝑦 𝜏𝜋 ) ⇔ ∆𝑝̂ ≈ 𝐵 𝑓0(𝜏𝜏𝑦 𝜋) where 𝑓0(𝜏𝑦
𝜏𝜋) is the density of the profit margin around the MTS payment threshold in the absence of the minimum tax kink.
The key aspect for this calculation to provide a good estimate of the bunching response is the choice of counterfactual density distribution. The standard approach in the literature is to fit a polynomial using data from the empirical density distribution, leaving out the area visibly affected by the bunching response. However, in the setting of this paper applying that procedure directly
24
would likely lead to a biased estimate of the bunching response. This is because in the absence of a minimum tax, firms would be expected to bunch at 𝑝̂ = 0%, due to the no loss carryforward rule. Since, under a minimum tax, non-exempt firms are not expected to bunch at that threshold, using the empirical density distribution of this group to estimate the counterfactual distribution would not be appropriate. Instead, the approach followed here is to obtain the counterfactual distribution from the empirical density distribution of exempt firms, as this group represents the environment that would be faced by non-exempt firms in the absence of the minimum tax.
1.5. Empirical Results
This section shows the empirical evidence obtained using Guatemalan tax administrative data. First, evidence of bunching at the MTS payment threshold is analyzed. Second, evidence of gross margin misreporting is presented. Finally, estimates of evasion obtained from the bunching responses are provided.
1.5.1. Evidence of bunching at the kinks
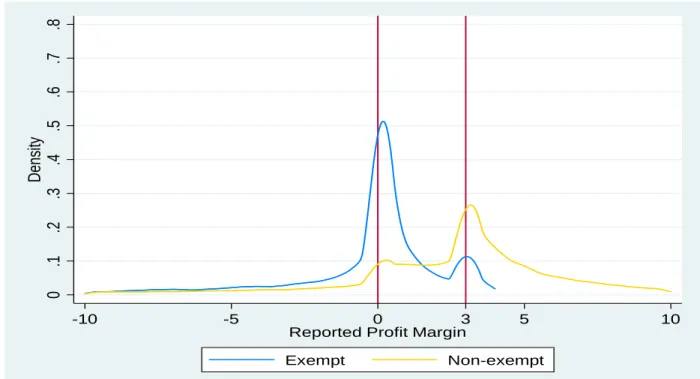
Prediction 1 states that non-exempt firms will have a tendency to bunch at the MTS payment threshold, while Prediction 2 indicates that exempt firms will have bunching incentives at 𝑝̂ = 0%. The empirical evidence shown in Figure 1.6 strongly supports these theoretical predictions. Panel (a) presents the density distribution of the reported profit margin for exempt and non-exempt firms. As seen in the figure, for the case of non-exempt firms there is clear evidence of bunching at 𝑝̂ = 3%. In contrast, exempt firms show large bunching at 𝑝̂ = 0%, although there is also a smaller amount of bunching at the MTS threshold.
25
A possible explanation for the unexpected bunching of exempt firms at the MTS payment threshold is that there are fixed costs of obtaining the exemption.36 In other words, a firm may be exemption-eligible, but may decide not to claim this benefit if the costs of doing so exceed the tax gains received by the firm. As explained earlier in the paper, firms claiming the MTS exemption face costs associated with submitting a series of legal and accounting documents well in advance of the filing deadline. A firm that has not complied with these requirements is liable to pay the minimum tax, which means it faces the same incentives as non-exempt firms. Unfortunately, the dataset does not include information on whether a given firm presented this documentation or not.
However, one way to indirectly test this hypothesis is to analyze firms’ behavior by turnover groups. If the costs of obtaining the exemption are fixed, firms with higher turnover should be less affected by them, as they represent a smaller proportion of their turnover. Panel (b) of Figure 1.6 provides some empirical support for this hypothesis. Exempt firms with a reported turnover below 8 million quetzales –low turnover firms– show sizeable bunching at the MTS payment threshold.37 In contrast, exempt firms with a reported turnover above 8 million quetzales –high turnover firms– appear to behave differentially, as they bunch significantly at 𝑝̂ = 0%, while having a negligible concentration at the MTS threshold. As a comparison, non-exempt firms do not seem to alter their behavior, independently of their level of turnover.
Further evidence in support of the fixed-cost hypothesis is provided in panels (c) and (d) of Figure 1.6. In the first of these panels, the density distribution of the reported profit margin is shown for firms, according to their cost structure. As indicated in Figure 1.5 and Table 1.3, firms
36 The literature on crime displacement has highlighted the importance of fixed costs when enforcement is selective. For instance, Yang (2008a) analyzes the role of fixed costs of switching to alternative duty-avoidance methods in the context of customs reform in the Philippines, finding evidence consistent with their existence.
26
face different misreporting incentives depending on their ratio of other costs to turnover. Firms with 𝑐̂𝑜
𝑦 ≤ 1% essentially face a pure profit tax and, hence, should not show any bunching at the MTS payment threshold in the absence of fixed costs. However, the empirical density shows bunching at this threshold. As in the case of panels (a) and (b), the density distributions presented in panel (d) illustrate that this bunching diminishes significantly for firms with a higher level of turnover. Interestingly, firms with 1% <𝑐̂𝑜
𝑦 ≤ 4% behave in a similar fashion as the previous group, suggesting that misreporting incentives are strong for this group. Instead, firms with 𝑐̂𝑜
𝑦 > 4% do not show any differentiated behavior, a pattern consistent with the fixed-costs hypothesis.
1.5.2. Evidence of gross margin misreporting
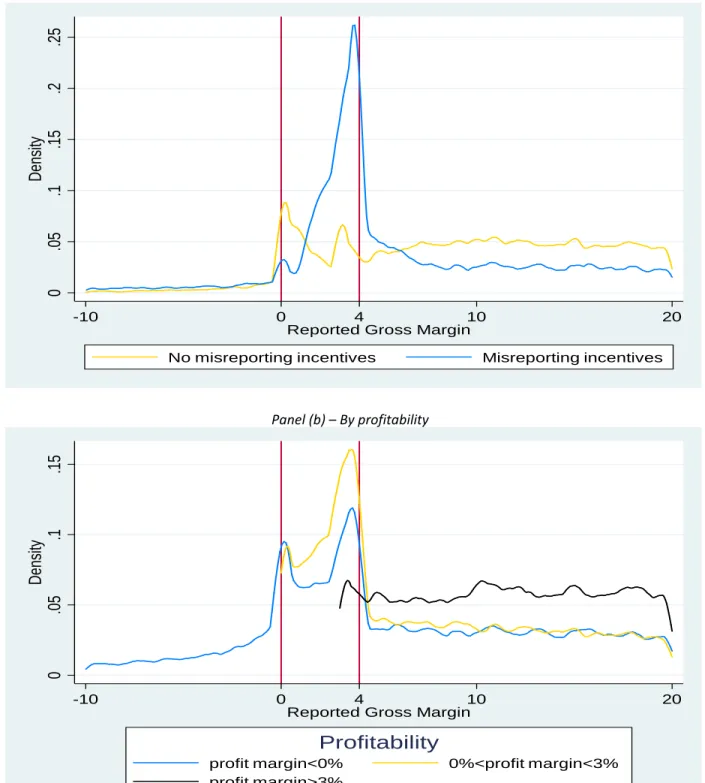
As explained earlier in this paper, the income tax scheme under Regimen Optativo creates incentives for some firms to bunch below the gross margin exemption threshold, with the intention of avoiding the minimum tax. Figure 1.7 shows evidence that firms behave according to what is predicted by the theoretical model. Panel (a) displays the density distributions for firms with incentives to misreport the gross margin and those without these incentives.38 As expected from Predictions 3 and 4, the first group shows significant bunching at the MTS exemption threshold, while the latter group does not. The two points of observed bunching for the group without incentives to misreport correspond to the kinks in the tax liability function, but not to the notch.39
Panel (b) of Figure 1.7 also provides strong evidence in favor of the theoretical predictions. First, it can be seen that firms reporting losses show large bunching at the MTS exemption
38 See Table 1.3 for the definition of which firms have incentives to misreport their gross margin and which do not. 39 The reported profit margin can be expressed as 𝑝̂ = 𝑔̂ −𝑐̂𝑜
𝑦. Hence, for firms with a small value of 𝑐̂𝑜
𝑦, we get that
𝑝̂ ≈ 𝑔̂. This means that the observed bunching at 𝑝̂ = 0% and 𝑝̂ = 3% in Figure 1.6 will be partially visible around
27
threshold. This is important because these firms do not face a local kink in their tax liability function, indicating that their bunching behavior at that point can only be reconciled with gross margin misreporting. Moreover, firms reporting a non-negative profit margin below 3% also bunch significantly at the MTS exemption threshold. Once again, this is consistent with the theory, as this group faces strong incentives to misreport their gross margin. Finally, firms with a reported profit margin above 3% provide a placebo test, as they should not bunch at the MTS exemption threshold. This is because they do not face the minimum tax, given that their reported profit margin is above the MTS payment threshold. Indeed, the figure shows that there is no observed bunching in this group.
Additionally, panels (c) and (d) in Figure 1.7 offer graphical evidence of gross margin misreporting for merchandise and services firms. Two features are significant in these graphs. On the one hand, firms with misreporting incentives bunch at the MTS exemption threshold, while those without these incentives do not bunch. This pattern, consistent with Predictions 3 and 4, occurs independently of whether the firms are merchandise or services firms. On the other hand, the intensity of the bunching at the critical threshold is weaker for services firms, a feature consistent with Prediction 5. In all, this pattern is suggestive of services firms facing, on average, higher costs of gross margin misreporting than merchandise firms.
1.5.3. Bunching responses estimates
The previous results provided evidence of firms’ bunching responses and their consistency with the theoretical framework. This subsection builds on that behavior in order to calculate estimates of the bunching response, applying the methodology detailed in Section 4. The analysis focuses on firms with a reported profit margin between 0% and 4%, for two reasons. First, in this range there is a common support between exemption-eligible and non-exempt firms, allowing for
28
meaningful comparisons of the two groups. Second, restricting the analysis to firms not reporting losses facilitates a better fit of the counterfactual distributions, which in turn results in better estimates of the bunching response at the minimum tax kink.
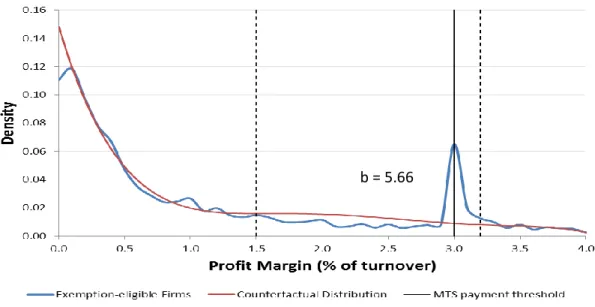
Figure 1.8 displays the empirical density distribution of the profit margin for exemption-eligible firms. It also presents the estimated counterfactual density for this group. Using these two distributions, the estimated excess bunching, 𝑏, caused by the fixed-costs of claiming the exemption is calculated at 5.66.40 Table 1.4 provides details of this estimation. For instance, the implied average profit margin response at the MTS payment threshold consistent with this level of bunching is 0.57 percentage points. If this response was only driven by a real adjustment (i.e. no evasion response), the estimated output elasticity would be 20.28, a value well above the typical range found in the literature.41 Instead, imposing more reasonable output elasticity values —from 0 to 10— yields estimated evasion responses ranging from 9.56% to 18.36% of reported profits.
A more dramatic picture is given by non-exempt firms. Figure 1.9 illustrates the empirical density distribution for this group and compares it to the estimated counterfactual distribution of exemption-eligible firms. As argued earlier in this study, the latter distribution is the appropriate counterfactual for non-exempt firms, due to the existence of the no loss carryforward rule. For this reason, in this context, the estimation procedure refrains from using the typical polynomial regression, which would fit data from non-exempt firms.42 In its place, the bunching response is
40 As in Best et al. (2015), the value of the excess bunching presented here is scaled by the average counterfactual density around the kink. Formally, 𝑏 = 𝐵̂/𝐸(𝑑̂𝑗|𝑗 ∈ [𝑝𝐿, 𝑝𝑈]), where 𝑑̂𝑗 represents the estimated counterfactual density at 𝑗, and [𝑝𝐿, 𝑝𝑈] defines the excluded range.
41 See, for example, Gruber and Rauh (2007), Devereux et al. (2014), and Patel et al (2017).
42 For comparison purposes, the estimation results derived from fitting a flexible polynomial to the density distribution of non-exempt firms are shown in Table A.1 in the appendix to this chapter.