Equity vs. Inside Debt Compensation of CEOs and
Firm Performance: New Evidence
Susan Bianca Pollock
A Thesis
In
The John Molson School of Business
Presented in Partial Fulfillment of the Requirements
for the Degree of Master of Science (Finance) at
Concordia University
Montreal, Quebec, Canada
January 2020
© Susan Pollock, 2020
CONCORDIA UNIVERSITY School of Graduate Studies This is to certify that the thesis prepared
By: Susan Bianca Pollock
Entitled: Equity vs. Inside Debt Compensation of CEOs and Firm Performance: New Evidence and submitted in partial fulfillment of the requirements for the degree of
Masters of Science (Finance)
complies with the regulations of the University and meets the accepted standards with respect to originality and quality.
Signed by the final Examining Committee:
______________________________ Chair Dr. Mahesh C. Sharma ______________________________ Examiner Dr. Sandra Betton ______________________________ Examiner Dr. Alan Hochstein ______________________________ Supervisor Dr. Lorne Switzer
Approved by: ______________________________ Department Chair Dr. Rahul Ravi
January 15, 2020 ______________________________ Dean of John Molson School of Business Dr. Anne-Marie Croteau
iii
A
BSTRACT
Equity vs. Inside Debt Compensation of CEOs and Firm Performance: New Evidence
Susan Bianca Pollock
This paper provides new evidence on the comparative effects of CEO inside debt and the components of equity compensation on firm valuation as measured by Tobin’s Q. We find empirical evidence for the classic Jensen and Meckling (1976) premise that managers should be granted debt and equity in
proportion to the ownership structure of the firm. We disaggregate the compensation structure into two components of inside debt: deferred compensation and accumulated pension. We also consider the four components of equity: including unvested shares, stock awards, estimated value of in-the-money unexercised options, as well as the estimated value of all other option awards. We also consider salary and bonus as short term incentives. We find that the effects of the different components of CEO compensation are dependent on the CEO’s time horizon, as measured by the expected period of employment to retirement.
iv
A
CKNOWLEDGEMENTS
While I worked on this thesis and during the semesters of coursework before it, I felt privileged to learn from so many exceptional and talented individuals at JMSB. Particularly, I would like to express my sincere appreciation and gratitude to my advisor, Dr. Lorne N. Switzer, for his patience, as well his endless good ideas, vast expertise and excellent guidance. I wish to thank my thesis committee, Dr. Sandra Betton and Dr. Alan Hochstein, for their insightful recommendations and comments. I would also like to thank Dr. Nabil El-Meslmani for his good advice and help programming in SAS, and to other members at JMSB, who facilitated my work and studies. Finally, I would not have conceived or completed this endeavor without my daughters, Violet and Scarlett.
v
T
ABLE OF
C
ONTENTS
1. Introduction ... 1 2. Literature Review ... 2 3. Hypothesis Development ... 10 4. Research methodology: ... 125. Results and Discussion ... 16
6. Conclusion ... 18
Bibliography ... 19
Appendix ... 24
Figures ... 25
vi
L
IST OF
F
IGURES
Figure 1: Distribution of CEO age in the sample ... 25
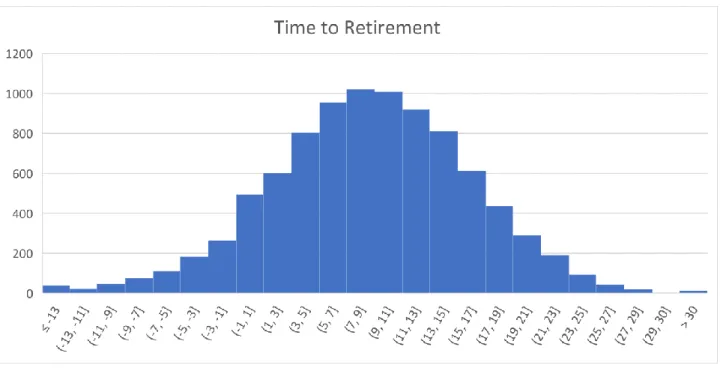
Figure 2: Distribution of Time to Retirement in the sample ... 25
Figure 3: Percentage of women on boards (2006 to 2015) ... 26
vii
L
IST OF
T
ABLES
Table 1: Descriptive Statistics ... 27
Table 2: Correlation table ... 28
Table 3: Summary of Regression Results – H1 ... 29
1
1.
I
NTRODUCTION
Agency problems associated with the separation of decision-making power and of risk-bearing from ownership represent serious challenges for publicly held corporations. The literature in finance is rife with discussions about alternative preventive strategies for mitigating agency problems. Fama and Jensen (1983) argue that separation of ownership persists in organisations in part because it benefits the organisation and because effective common approaches to control this agency problem and cost exist, the imperfect alignment and subsequent conflict of interest, is not without consequence. As per Jensen and Meckling (1976), agency costs are “as real as any other cost.”
Several studies have demonstrated that equity compensation of CEOs is related to improved firm performance, consistent with the classical agency cost perspective (e.g. Jensen, Murphy 1990b, Lippert, Moore 1995 Guay 1999, Core, Holthausen et al. 1999, Ittner, Lambert et al. 2003, Switzer 2007). The issue of debt compensation has received much less attention, however. Jensen and Meckling (1976) speculate that to better align managers with all stakeholders, managers should be granted debt and equity in proportion to the ownership structure of the firm. Equity compensation alone could encourage risk-taking behaviour, while recent empirical studies find that inside debt can reduce risk-taking (Edmans, Liu 2010, Wei, Yermack 2011, Anantharaman, Fang et al. 2013, Bolton, Mehran et al. 2015).
This paper provides new evidence on the differential impact of equity vs. inside debt compensation of CEOs and firm performance as measured by Tobin’s Q. Inside debt as defined by Jensen and Meckling (1976) includes defined benefit pensions and deferred compensation. As Edmans and Liu (2010), note, these components are as important as unsecured bonds to the firm, since they represent unfunded debt claims with equal priority to those of other unsecured creditors in bankruptcy. This study disaggregates executive compensation broken into three categories, i. bonus and salary, ii. four equity components, value of option awards, value of stock awards, value of unvested shares, estimated value in money options and iii. two inside debt components, accumulated pension benefits and deferred compensation aggregate. The study’s key findings are that firm performance benefits when executive capital structure is tied to firm capital structure; we find evidence to support Jensen and Meckling’s (1976) speculation. We also find that to best incentivize executives; compensation structure should change with expected CEO tenure. The expected time to retirement as such is not significant; young CEOs are not necessarily better than older. Equity compensation is better for young CEOs and while debt incentives are not good overall, they are better for older CEOs.
2
The remainder of the paper is organized as follows. The next section provides a brief review of the literature. Section 3 introduces the hypotheses for testing. Section 4 discusses the methodology and the data. The results are presented in section 5. The paper concludes with a summary in section 6.
2.
L
ITERATURE
R
EVIEW
Monitoring and governance
Internal mechanisms for mitigating the fundamental conflict of interest between the shareholders of the firm and the managers are typically categorized into types: 1. Direct and indirect monitoring of managers by the board of directors, and 2. Adoption of Incentives that align the interests of the manager with those of the shareholders (Denis, David J., Denis et al. 1999) – e.g. equity based compensation (Denis, Diane K., McConnell 2003).
A basic tenet in corporate finance is that good corporate governance should have a positive impact on the value of the firm, measured by Tobin’s Q (Morck, Shleifer et al. 1988) or in the valuation of cash and of cash flow (Gompers, Ishii et al. 2010, Dittmar, Mahrt-Smith 2007). The contribution of the board of directors to good governance remains a matter of controversy, however. While it is theoretically in place to ensure the interests of the shareholders are represented, Perel (2003) for example states “many corporate boards function as entrenched and passive clubs, closely allied with the CEO, and not prone to exercising strong challenges.” Elson’s (2003) basic critique is that in the case of executive compensation, board members are often unqualified to make decisions on appropriate compensation. With the
introduction of the “say on pay” provision in the Dodd-Frank Wall Street Reform and Consumer Protection Act, enacted on July 21, 2010, boards of publicly held firms must submit the executive
compensation plan to a shareholder vote, the results of which are made public. Evidence of a favourable effect on firm performance and on a subsequent downward adjustment of excessive executive pay has been documented (Denis, Diane K., Jochem et al. 2019). Other researchers propose that if “compensation could be cut without weakening managerial incentives” there would be tangible gains to the investors, though they warn that the influence managers have over their own compensation could be the most costly to the firm (Bebchuk, Lucian A., Fried 2006). Marinovic and Varas (2018), however, argue that optimal compensation contracts allow for some manipulation. Compensation contracts should include performance-based vesting conditions (Bettis, Bizjak et al. 2010), otherwise incentives vest
deterministically. With manipulation vesting will depend on performance and the manager will exert a higher level of effort (Marinovic, Varas 2018).
3
Excessive CEO compensation has been the subject of much controversy. One of the challenges for any organisation is attracting and retaining top talent. In times of high demand, particularly for people who are capable of leading companies, compensation can skyrocket (Chambers, Foulon et al. 1998). CEO pay is several multiples more than the “average worker’s” pay. In 1970, and including all CEO income, the average CEO earned 25 times that of the average industrial worker (Frey, Osterloh 2005). In 1990 CEO pay was approximately on average 100 times that of the average worker. Ten years later in 2000, it was approximately 350 to 570 times that of the average worker (Rynes, Gerhart 2000). Brick and Palmon (2006) study CEO and director compensation and find that excess compensation, for both CEO and directors, is related to firm underperformance. They also find that director and CEO compensation are related and conclude that “the evidence is consistent with excessive compensation due to mutual back scratching or cronyism.”
Further, the board’s power to control agency issues is limited. Decision making power is diffused among many agents in the organisation (as are agency costs). Agency problems, and the consequential costs and impact to firm value, occur at many levels in an organization. Projects or initiatives are often started at lower levels and then filtered up. Ratification and monitoring, happening only at the board level, has limited impact. Monitoring all activities would be prohibitively expensive, and monitoring cannot be comprehensive unless the monitoring agents become the managers themselves (Jensen, Meckling 1976).
Alignment of ownership
The second internal mechanism, alignment of ownership, is described by Jensen and Murphy (1990a) as the “most powerful link” between CEO wealth and shareholder wealth.
In Jensen and Meckling’s (1976) formalization of the agency problem they explain that managers who do not own 100 percent of the firm they manage will incur agency costs to the firm. If the manager owns, for example, only 95 percent of the stock, he or she “will expend resources to the point where the marginal utility derived from a dollar’s expenditure of the firm’s resources equals the marginal utility of an additional 95 cents of purchasing power (i.e., his share of the wealth reduction) and not one dollar.” Compensation using stock option awards or similar equity pay is expected to entice CEOs to adopt an optimal balance of risk and return to improve shareholder wealth; as cash compensation is unsuccessful at establishing this balance (Bryan, Hwang et al. 2000, Bryan, Hwang et al. 2005). Equity compensation in a leveraged firm “serves as a pre-commitment device” to minimize the agency costs of debt (John, John 1993). Similar findings support the hypothesis that agency costs are reduced by increased CEO
4
ownership (e.g. Jensen, Murphy 1990b, Lambert, Larcker 1987, Lippert, Moore 1995 Guay 1999, Core, Holthausen et al. 1999, Ittner, Lambert et al. 2003, Switzer 2007).
One of Jensen and Murphy’s (1990a) recommendations is that “CEOs should own substantial amounts of company stock”. Those executives will experience a “direct and powerful ‘feedback effect’ from the market.” Despite the unapologetic statement, the authors, however, concede that it is not reasonable or possible in many firms due to the sheer size of the firm (Jensen, Murphy 1990a). In 1990 Jensen and Murphy found that of the 250 largest American companies, the median CEO owned less than 0.07% of the company’s stock (Jensen, Murphy 1990a). More recently, according to a 2005 study, the average CEO owns 0.0017% of the firm’s equity (Brick, Palmon et al. 2006).
Empirical research, that focuses on financial firms, fails to support these findings. One study found no correlation between bank CEO equity incentives and the bank performance during the Financial Crisis of 2008 (Tung, Wang 2012), while another found no evidence that CEO incentive alignment performed better and even some evidence suggesting they performed worse (Fahlenbrach, Stulz 2011).
Agency costs of debt
Compensating with equity alone will give managers a stronger incentive to take riskier investments or projects (Jensen, Meckling 1976). If the risky investments turn out well, the manager captures most of the gains, but if they turn out badly, the creditors bear most of the costs. Empirical evidence of risk shifting when executive stock option plans are introduced was has been found (DeFusco, Zorn et al. 1991).
Given a scenario where the manager must decide between one of two investment opportunities; one has a higher variance, but both are log-normally distributed, the manager can first issue debt, promise to take the low variance project, and sell bonds. Assuming the bondholders cannot prevent the manager from changing the investment decision, he/she can then take the high variance project and transfer wealth from the bondholders to him/herself as an equity holder. Bondholders, in this scenario, will not actually lose. They presume the manager has opportunities to change projects due to his/her own maximizing behaviour (if no agreement exists) and consequently pay the appropriate amount for the bonds (i.e. the high variance project) (Jensen, Meckling 1976).
External governance mechanisms include “the external market for corporate control (the takeover market) and the legal system” (Denis, Diane K., McConnell 2003). So in addition to opportunity wealth
5
loss caused by incentivizing higher risk projects, agency costs to the bondholders include the monitoring and bonding expenses by bondholders and the owner-manager and potentially, the bankruptcy and reorganization costs (Jensen, Meckling 1976).
Inside debt is a more effective solution to the agency costs of debt than equity. The payoff is not only subject to the event of bankruptcy, but also to the value of the firm in bankruptcy (Edmans, Liu 2010). In a firm with sufficient leverage, bonuses are not successful in eliminating agency costs of debt (Brander, Poitevin 1992). Liu, Mauer et al. (2014) find a positive relationship between CEO inside debt and the firm’s cash reserves. Further, they find that as firm becomes more leveraged, the positive relationship is magnified (Liu, Mauer et al. 2014).
Debt-like pay is not, however, without caveats. Wei and Yermack (2011) remark that an executive might notice a firm is failing and take early retirement, further stressing the liquidity of the firm. Raviv and Sisli-Ciamarra (2013) found that level of risk in executive compensation may vary with the state of the economy; the proportion of equity-based to debt-like compensation is less sensitive in a systemic crisis. The overarching evidence is not unilaterally in favour of CEO inside debt compensation. A recent study found that high inside debt holdings reduce the value of excess cash. Executives take on risk averse behaviour, including the accumulation of excess cash. Shareholders bear the cost of these lost opportunities while debtholders benefit (Belkhir, Boubaker et al. 2018).
Optimal mix and inside debt
Jensen and Meckling (1976) speculate that there is an optimal mix of executive debt ownership; the debt and equity held by “the manager” should have the same ratio as the firm’s equity to debt ratio. They further caution that high debt compensation might motivate the executive to manage the firm too conservatively (Jensen, Meckling 1976).
Empirical studies have shown that inside debt can reduce risk taking (Bolton, Mehran et al. 2015, Anantharaman, Fang et al. 2013, Edmans, Liu 2010). Similarly, Wei and Yermack (2011) find that managers with inside debt tend to become less inclined to take on risk; they show “a general pattern of gains to bondholders and losses to equityholders when firms disclose large inside debt holdings by their CEOs.”
6
When CEOs have a high ratio of inside debt to equity compensation, they tend to have a lower cost of debt (Wei, Yermack 2011). This is consistent with the results of simulations done by Parrino and Weisbach (1999). Anantharaman, Fang et al. (2013) further find that firms have fewer bond covenants when the CEO has a inside debt in the form of a pension, and that the effectiveness of debt-like compensation in aligning incentives depends “crucially on the extent to which it exposes executives to similar risk of loss as unsecured outside debtholders.”
The inside debt held by CEOs may be underestimated. In addition to pension benefits and disclosed deferred compensation, “many executives receive substantial post-retirement perks, including payments for consulting services that may well represent compensation for services rendered before their
retirement” (Bebchuk, Lucian A., Jackson Jr 2005). Further, some deferred compensation schemes allow the executive “to pass the tax costs of investment gains to their firms” (Bebchuk, Lucian A., Jackson Jr 2005). Even after the disclosure of deferred compensation was required by law, there continues to be a tax benefit for an executive who receives deferred compensation; it is often paid out after the executive retires (Wei, Yermack 2011). Pay for performance after the CEO retires is costly for firms, and the effectiveness of such compensation is limited (Marinovic, Varas 2018).
Financial firms and banks in particular are unique in that they are financed predominantly by debtholders (Van Bekkum 2016). Debt-based compensation, however, limits bank risk and risk-taking, as found by Van Bekkum (2016). They find that the results make sense in context since “bank shareholders worry about executives taking too little risk.” The boards of these firms want to prevent underinvestment. This, however, also has the effect of increasing shareholder volatility (Guay 1999). Further, that while
shareholder agency issues have received a great deal of “attention” in the past, other stakeholders, debtholders in particular, have received much less. Equity incentives essentially shift risk to debtholders, and away from shareholders (Van Bekkum 2016). When leverage is high, the potential for risk shifting to debtholders is large, and the positive influence of inside debt is expected to be high (Van Bekkum 2016). Van Bekkum (2016) finds that when CEO inside debt is relatively large for the more highly
leveraged banks, the impact of the inside debt on “stock market losses, volatility, VaR, ES and CoVaR” are higher.
CEO Horizons
CEO compensation “shifts systematically” toward pension benefits and deferred compensation, and away from equity-based compensation, as CEOs age (Sundaram, Yermack 2007). However, “deferred
7
compensation vests over time at an increasing rate” (Marinovic, Varas 2018) which creates an
endogenous CEO horizon problem. Executive compensation becomes increasingly sensitive to short-term performance over time; since “positive shocks” will accelerate vesting, which reduces long term
incentives. Long-term incentives are most effective “at the beginning of a CEO’s tenure and decay toward the end” (Marinovic, Varas 2018).
CEO’s incentive horizons are determined predominantly by the length of the vesting periods on their equity compensation grants (Ladika, Sautner 2018). Reductions in investment are linked to the CEO’s concern for the current stock price (Edmans, Fang et al. 2017). Option acceleration led CEOs to cut both R&D and capital expenditure, and the magnitude of those cuts was directly related to decreases in CEO horizons (Ladika, Sautner 2018). CEOs with greater short-term incentives spend less on long-term investment (Ladika, Sautner 2018) and similarly CEOs with shorter horizons, or shorter expected tenure, have a greater propensity to forego long-run investments (Antia, Pantzalis et al. 2010).
While it is beneficial for firms to defer compensation, it is more effective while the CEO is still on the job rather than after he or she retires (Marinovic, Varas 2018) as CEOs place less importance on cash flow that occurs after retirement (Antia, Pantzalis et al. 2010). The firm’s lifespan is longer than the CEO’s tenure, and managers approaching the end of their tenure tend to become myopic (Antia, Pantzalis et al. 2010). This myopia could lead CEOs to manipulate their compensation (Marinovic, Varas 2018) or encourage short-termism that includes, prematurely recognizing revenues and earnings (Jensen 2004), inflating reported earnings (Sun, Hovey 2017) or reducing long-term investment, at the expense of the firm.
“Tolerating some level of manipulation is desirable because doing so allows the firm to elicit higher levels of effort than a manipulation-free contract” (Marinovic, Varas 2018). In addition, inducing “zero
manipulation” would require a large postretirement compensation package that binds the CEO’s wealth to the firm. There is also an endogeneity issue in the horizon hypothesis; stakeholders can anticipate the horizon problem as the CEO approaches retirement, and can accordingly adjust executive compensation agreements (Marinovic, Varas 2018).
Short-termism is not necessarily solved by hiring a young CEO; age does not eliminate the possibility of manipulation in the short-term at the expense of the firm’s long term value (Antia, Pantzalis et al. 2010). Similarly, longer CEO horizons incentivize CEOs to focus on the long-term value of the firm (Antia, Pantzalis et al. 2010), but longer tenure of a CEO is also associated to an acceptance of “status quo” and
8
impaired financial performance (Hambrick, Geletkanycz et al. 1993). Succinctly, “the optimal contract is nonlinear in performance” (Marinovic, Varas 2018). Further, pay structure should not necessarily be static, optimal structure should change as incentives evolve with expected tenure. The theoretical model proposed by Marinovic and Varas (2018) shows that CEO horizon matters in determining optimal
incentive compensation structures.
While deferred compensation can is usually long-term, pension is almost always a long-term incentive. Short-term incentives can lead to short-term action. Archambeault, DeZoort et al. (2008) predict that short term incentive-based compensation on audit committees increases the likelihood of accounting restatements due to error or fraud, while the opposite is true for long-term incentive compensation. Long-term incentives are expected to mitigate excess risk taking and encourage executives to take a long horizon view. In the years after the financial crisis, and the massive government bailout in the United States, some researchers propose that executive incentive compensation should include only stock and stock options that cannot be sold for at least two to four years after the executive’s “last day in the office” (Bhagat, Romano 2009). Similar to the bad-model problem where predicting expected behaviour in short time frames based on present conditions is less subject to error (Fama 1998), in investigations of long-term time horizons, and the many events that can affect firm performance, it is more difficult to find evidence of a causal link between, for example, long-term incentive pay (LTIP) and long-term firm
performance.
Inside debt and elite pensions
Much of the literature addresses inside debt as a whole. There are some key differences between deferred compensation and pension. First, while deferred compensation can sometimes be long-term, pension is almost always a long-term incentive. Second, pensions, base pay and long-term incentives are expected to be stable, as opposed to bonuses which are expected to be variable (Gerhart, Milkovich 1990).
Third, the debt incentive alignment as an explanation is up for debate. Typically, executives have defined-benefit plans that guarantee fixed payments for life. Defined-defined-benefits, unlike defined-contribution plans, shift the risk of poor investment performance to the firm from the executive employee. Qualified pension plans for all employees provide tax benefits to the employees without increasing the firm’s tax rate. Executives, however, are often paid substantially more, and qualified pensions have limits on them for each employee. Pension plans, specifically for executives, are called supplemental executive
9
retirement plans (SERP). SERPs do not have to be funded or secured, whereas rank-and-file plans (RAFs) which cover all employees, are funded and secured and protected under the Employee Retirement Income Security Act of 1974 (ERISA) (Anantharaman, Fang et al. 2013). In addition to risk shifting toward the firm, the additional tax cost of SERPs is shifted from the executive to the firm. “The long-term capital-gains tax paid by individuals is lower than the marginal corporate tax rate paid by profitable companies” (Bebchuk, Lucian A., Jackson Jr 2005). Bebchuk and Jackson (2005) argue that if SERPs were efficient, then they would be extended to all employees in a firm. Further, they rebuke the possibility that SERPs as defined-benefit plans shift risk from the executives to the shareholders, who “are better able to bear such risk”, by saying that firms have been shifting from defined-benefit to defined contribution plans for regular employees, who are less able to shoulder additional risk than executives or shareholders. The elite pension plans were, up until regulation required their disclosure in 2006, considered a form of stealth compensation (Strier 2007). Camouflaged compensation may enhance how an executive is perceived (Bebchuk, Lucian Arye, Fried 2004), and even though pensions and deferred compensation must now be disclosed, stealth compensation continues to exist. For example, executives get dividends on unvested restricted stock grants. Firms are not required to disclose these amounts; it’s up to each firm to decide if there is “material information” (Minnick, Rosenthal 2014). Even with regulation, perhaps there is a perception benefit for the executive when his or her compensation takes the form of
retirement benefits instead of cash or equity-based pay.
Lastly, this “debt-serving explanation” assumes that companies do not pay out the unfunded executive pensions when facing bankruptcy. This is not necessarily true as firms “often assume in full the
company’s obligation to executives under defined-benefit plans even when they pay only part of the claims of financial creditors” (Bebchuk, Lucian A., Jackson Jr 2005). To align interests, pension payoff in “insolvency must be proportional to the firm’s liquidation value” (Anantharaman, Fang et al. 2013) and firms should commit to executive pensions in the same way they commit to other debts such bank loans, or private debt securities (Bebchuk, Lucian A., Jackson Jr 2005). In a 2013 study, researchers hand collected data on funded and secured RAF plans and that of the unfunded and unsecured SERP and deferred compensation and found that the average value of RAF plans was 6% relative to total debt-like compensation (Anantharaman, Fang et al. 2013). Despite the low overall secured portion of pension, “special arrangements in debt-like compensation could hence weaken or even nullify any incentive-alignment effect” (Anantharaman, Fang et al. 2013).
10
3.
H
YPOTHESIS
D
EVELOPMENT
In the tax-free world of Modigliani and Miller (1958), capital structure is irrelevant. In the real world, where taxes and the tax-benefit of debt exist, it is assumed that firms choose an optimal capital structure that balances tax benefits with agency and bankruptcy costs. Jensen and Meckling (1976) speculate that to better align managers with all stakeholders, managers should be granted debt and equity in proportion to the ownership structure of the firm. Deviations in CEO compensation structure from the firm’s capital structure should, therefore, hinder performance.
HYPOTHESIS 1: Firm performance, as measured by Tobin’s Q, will be greater when the difference between the debt to equity ratio of the CEO’s compensation and the debt to equity ratio of firm are minimized.
Secondly, the optimal compensation structure should consider the expected tenure of the CEO. Long-term incentives at the beginning of CEO tenure are important to encourage a long-view horizon and prevent excessive risk-taking. However, similar long-term incentives for a seasoned CEO could, in some cases, encourage short-termism, even though excessive risk-taking late in CEO tenure is expected to be deterred by the risk of bankruptcy and the takeover market. Executive compensation becomes more sensitive to short-term performance over time. Lower pay-for-performance sensitivity for option grants is related to longer CEO tenure, “suggesting the entrenchment effect of CEO tenure” (Ozkan 2011). Higher salaries and bonus for older CEOs might discourage short-term myopia and potentially stock and earnings manipulation, while compensation that is deferred until after the CEO retires can be costly to the firm (Marinovic, Varas 2018).
To incentivize the long horizon view, and optimal firm performance over time, the CEO’s debt
compensation should start high and decrease toward the end of CEO tenure. At the beginning of CEO tenure, the executive is likely to have less personal wealth invested in the firm. Bonuses incentivize early in CEO tenure but are later “eclipsed by accumulated equity incentives” (Guay, Kepler et al. 2019). Bonus and salary are expected to be more relevant when the CEO has a long-expected tenure, though
guaranteeing a large salary to a young CEO over the long-term is unlikely to predict optimal firm performance, salary and bonus are likely to be several times less than mid-career equity and debt holdings of most CEOs. In my dataset, the average annual salary and bonus combined is $969,000
11
compared to the average sum of CEO inside debt and equity holdings of $10,271,000 (excluding estimated value of money options, which is on average $8,070,000).
HYPOTHESIS 2: An optimal compensation structure depends on CEO time horizons and their influence on incentives in the form of equity, inside debt and salary. The debt and salary incentives are expected to be optimal when they start high and decrease with time. Equity incentives are expected to be optimal when they are greatest near the end of CEO tenure.
12
4.
R
ESEARCH METHODOLOGY
:
Analytical Methods: Measuring firm performance
Using Tobin’s Q as the dependent variable, we use regression testing to investigate the relationship with independent variables, along with several other control variables.
The dependent variable Tobin’s Q is used as the measure of firm performance and is approximated as per Chung and Pruitt (Chung, Pruitt 1994).
𝑇𝑜𝑏𝑖𝑛′𝑠 𝑄 =(𝑀𝑎𝑟𝑘𝑒𝑡 𝑉𝑎𝑙𝑢𝑒 𝑜𝑓 𝐸𝑞𝑢𝑖𝑡𝑦 + 𝑃𝑟𝑒𝑓𝑒𝑟𝑟𝑒𝑑 𝑆𝑡𝑜𝑐𝑘 𝐿𝑖𝑞𝑢𝑖𝑑 + "𝐷𝑒𝑏𝑡") 𝑇𝑜𝑡𝑎𝑙 𝐴𝑠𝑠𝑒𝑡𝑠 Where 𝑀𝑎𝑟𝑘𝑒𝑡 𝑉𝑎𝑙𝑢𝑒 𝑜𝑓 𝐸𝑞𝑢𝑖𝑡𝑦 = 𝐶𝑜𝑚𝑚𝑜𝑛 𝑆ℎ𝑎𝑟𝑒𝑠 𝑂𝑢𝑡𝑠𝑡𝑎𝑛𝑑𝑖𝑛𝑔 × 𝑃𝑟𝑖𝑐𝑒 𝐶𝑙𝑜𝑠𝑒 𝑎𝑡 𝐹𝑖𝑠𝑐𝑎𝑙 𝑌𝑒𝑎𝑟 𝐸𝑛𝑑 “𝐷𝑒𝑏𝑡" = 𝐶𝑢𝑟𝑟𝑒𝑛𝑡 𝐿𝑖𝑎𝑏𝑖𝑙𝑖𝑡𝑖𝑒𝑠 𝑇𝑜𝑡𝑎𝑙 − 𝐶𝑢𝑟𝑟𝑒𝑛𝑡 𝐴𝑠𝑠𝑒𝑡𝑠 𝑇𝑜𝑡𝑎𝑙 + 𝐿𝑜𝑛𝑔 𝑇𝑒𝑟𝑚 𝐷𝑒𝑏𝑡 𝑇𝑜𝑡𝑎𝑙
The numerator is composed of the market value of equity, preferred stock Liquid and debt, where i. market value of equity is the product of the firm’s share price and the number of common stock shares outstanding, ii. preferred stock liquid is the liquidating value of the firm’s outstanding preferred stock, and iii. debt is the value of the firm’s short-term liabilities net of its short-term assets plus the firm’s long-term debt. The denominator is the book value of the total assets of the firm.
Compensation structure (H1)
To test our first hypothesis, that firm performance is optimal when the compensation structure of the CEO is identical to that of the firm, we take the absolute difference of the spread between the debt to equity ratio of the CEO’s compensation and the debt to equity ratio of firm. The employed equations are:
𝐾𝑑𝑖𝑓𝑓 = |𝐼𝑛𝑠𝑖𝑑𝑒 𝐷𝑒𝑏𝑡 ℎ𝑒𝑙𝑑 𝑏𝑦 𝑡ℎ𝑒 𝑚𝑎𝑛𝑎𝑔𝑒𝑟 𝐸𝑞𝑢𝑖𝑡𝑦 ℎ𝑒𝑙𝑑 𝑏𝑦 𝑡ℎ𝑒 𝑚𝑎𝑛𝑎𝑔𝑒𝑟 − 𝐿𝑜𝑛𝑔𝑡𝑒𝑟𝑚 𝑑𝑒𝑏𝑡 𝑜𝑓 𝑡ℎ𝑒 𝑓𝑖𝑟𝑚 𝐸𝑞𝑢𝑖𝑡𝑦 𝑜𝑓 𝑡ℎ𝑒 𝑓𝑖𝑟𝑚 | 𝑇𝑜𝑏𝑖𝑛′𝑠 𝑄 = 𝑎0+ 𝑎1𝐾𝑑𝑖𝑓𝑓 + 𝑎2log(𝑇𝑜𝑡𝑎𝑙 𝐴𝑠𝑠𝑒𝑡𝑠 𝑜𝑓 𝑡ℎ𝑒 𝐹𝑖𝑟𝑚) + 𝑎3𝑅𝑛𝐷 𝑡𝑜 𝑆𝑎𝑙𝑒𝑠 + 𝑎4𝐵𝑜𝑎𝑟𝑑 𝑆𝑖𝑧𝑒 + 𝑎5𝐵𝑜𝑎𝑟𝑑 𝐼𝑛𝑑𝑒𝑝𝑒𝑛𝑑𝑒𝑛𝑐𝑒 + 𝑎6𝐶𝐸𝑂 𝐷𝑢𝑎𝑙𝑖𝑡𝑦 + 𝑎7 𝑃𝑒𝑟𝑐𝑒𝑛𝑡𝑎𝑔𝑒 𝑜𝑓 𝑊𝑜𝑚𝑒𝑛 𝑜𝑛 𝑡ℎ𝑒 𝐵𝑜𝑎𝑟𝑑 + 𝑎8 𝐹𝑖𝑛𝑎𝑛𝑐𝑖𝑎𝑙 𝐶𝑟𝑖𝑠𝑖𝑠 𝐷𝑢𝑚𝑚𝑦 + 𝜀
13 Where
𝐵𝑜𝑎𝑟𝑑 𝐼𝑛𝑑𝑒𝑝𝑒𝑛𝑑𝑒𝑛𝑐𝑒 =𝑇𝑜𝑡𝑎𝑙 𝐼𝑛𝑑𝑒𝑝𝑒𝑛𝑑𝑒𝑛𝑡 𝐷𝑖𝑟𝑒𝑐𝑡𝑜𝑟𝑠 𝑜𝑛 𝐵𝑜𝑎𝑟𝑑 𝑇𝑜𝑡𝑎𝑙 𝐷𝑖𝑟𝑒𝑐𝑡𝑜𝑟𝑠 𝑜𝑛 𝐵𝑜𝑎𝑟𝑑
CEO Horizon and incentives (H2)
To investigate whether CEO horizon matters in determining optimal executive pay structure, we introduce two-way interactive terms into the model for the salary, equity and debt incentives.
The best available proxy for expected tenure, as opposed to past or current tenure, is time to retirement from the WRDS BoardEx database. This assumes that CEOs retire at 64 years old, and the time to retirement variable becomes negative after the CEO turns 65. For the most part, this assumption seems somewhat plausible, though if one assumes hard-working, driven people, with intrinsic motivations beyond “paying the mortgage” become CEOs, then 64 years old may be an underestimate. (In my data 10.14% of CEOs are 65 years old or older.) The variable of time to retirement could have noise, but in the absence of clairvoyant or individually hand-collected CEO survey data, it will suffice as the proxy for expected tenure. 𝑆𝑎𝑙𝑎𝑟𝑦 𝐼𝑛𝑐𝑒𝑛𝑡𝑖𝑣𝑒 = (𝐴𝑛𝑛𝑢𝑎𝑙 𝑆𝑎𝑙𝑎𝑟𝑦 + 𝐴𝑛𝑛𝑢𝑎𝑙 𝐵𝑜𝑛𝑢𝑠)𝑥 𝑇𝑖𝑚𝑒 𝑡𝑜 𝑅𝑒𝑡𝑖𝑟𝑒𝑚𝑒𝑛𝑡 𝐸𝑞𝑢𝑖𝑡𝑦 𝐼𝑛𝑐𝑒𝑛𝑡𝑖𝑣𝑒 = (𝑉𝑎𝑙𝑢𝑒 𝑜𝑓 𝑂𝑝𝑡𝑖𝑜𝑛 𝐴𝑤𝑎𝑟𝑑𝑠 + 𝑉𝑎𝑙𝑢𝑒 𝑜𝑓 𝑈𝑛𝑣𝑒𝑠𝑡𝑒𝑑 𝑆ℎ𝑎𝑟𝑒𝑠 + 𝑉𝑎𝑙𝑢𝑒 𝑜𝑓 𝑆𝑡𝑜𝑐𝑘 𝐴𝑤𝑎𝑟𝑑𝑠 + 𝐸𝑠𝑡𝑖𝑚𝑎𝑡𝑒𝑑 𝑉𝑎𝑙𝑢𝑒 𝑖𝑛 𝑀𝑜𝑛𝑒𝑦 𝑂𝑝𝑡𝑖𝑜𝑛𝑠 𝑈𝑛𝑒𝑥𝑒𝑟𝑐𝑖𝑠𝑒𝑑)𝑥 𝑇𝑖𝑚𝑒 𝑡𝑜 𝑅𝑒𝑡𝑖𝑟𝑒𝑚𝑒𝑛𝑡 𝐼𝑛𝑠𝑖𝑑𝑒 𝐷𝑒𝑏𝑡 𝐼𝑛𝑐𝑒𝑛𝑡𝑖𝑣𝑒 = (𝐴𝑐𝑐𝑢𝑚𝑢𝑙𝑎𝑡𝑒𝑑 𝑣𝑎𝑙𝑢𝑒 𝑜𝑓 𝑃𝑒𝑛𝑠𝑖𝑜𝑛 + 𝑇𝑜𝑡𝑎𝑙 𝐴𝑔𝑔𝑟𝑒𝑔𝑎𝑡𝑒 𝐷𝑒𝑓𝑒𝑟𝑟𝑒𝑑 𝐶𝑜𝑚𝑝𝑒𝑛𝑠𝑎𝑡𝑖𝑜𝑛)𝑥 𝑇𝑖𝑚𝑒 𝑡𝑜 𝑅𝑒𝑡𝑖𝑟𝑒𝑚𝑒𝑛𝑡
14 𝑇𝑜𝑏𝑖𝑛′𝑠 𝑄 = 𝑎0+ 𝑎2𝐾𝑑𝑖𝑓𝑓 + 𝑎3𝑇𝑖𝑚𝑒 𝑡𝑜 𝑅𝑒𝑡𝑖𝑟𝑒𝑚𝑒𝑛𝑡 + 𝑎4 𝑆𝑎𝑙𝑎𝑟𝑦 𝐼𝑛𝑐𝑒𝑛𝑡𝑖𝑣𝑒 + 𝑎5 𝐸𝑞𝑢𝑖𝑡𝑦 𝐼𝑛𝑐𝑒𝑛𝑡𝑖𝑣𝑒 + 𝑎6 𝐼𝑛𝑠𝑖𝑑𝑒 𝐷𝑒𝑏𝑡 𝐼𝑛𝑐𝑒𝑛𝑡𝑖𝑣𝑒 + 𝑎1log(𝑇𝑜𝑡𝑎𝑙 𝐴𝑠𝑠𝑒𝑡𝑠 𝑜𝑓 𝑡ℎ𝑒 𝐹𝑖𝑟𝑚) + 𝑎7𝑅𝑛𝐷 𝑡𝑜 𝑆𝑎𝑙𝑒𝑠 + 𝑎8𝐵𝑜𝑎𝑟𝑑 𝑆𝑖𝑧𝑒 + 𝑎9𝐵𝑜𝑎𝑟𝑑 𝐼𝑛𝑑𝑒𝑝𝑒𝑛𝑑𝑒𝑛𝑐𝑒 + 𝑎10𝐶𝐸𝑂 𝐷𝑢𝑎𝑙𝑖𝑡𝑦 + 𝑎11 𝑃𝑒𝑟𝑐𝑒𝑛𝑡𝑎𝑔𝑒 𝑜𝑓 𝑊𝑜𝑚𝑒𝑛 𝑜𝑛 𝑡ℎ𝑒 𝐵𝑜𝑎𝑟𝑑 + 𝑎12 𝐹𝑖𝑛𝑎𝑛𝑐𝑖𝑎𝑙 𝐶𝑟𝑖𝑠𝑖𝑠 𝐷𝑢𝑚𝑚𝑦 + 𝑎13 𝐺𝑒𝑛𝑑𝑒𝑟 𝐷𝑢𝑚𝑚𝑦 + 𝜀
The model used include control variables for the firm, the log of the total firm assets to capture size effects and R&D to sales to account for investment in the future of the firm. Governance variables include the board size, board independence, which is a ratio of the independent board members to the total number of board members, a binary for CEO duality and the percentage of women directors on the board. A control variable for the financial crisis is 1 during years 2007 to 2009, and 0 otherwise. Gender is a control variable in case there is an inherent difference in propensity to risk taking.
Data
The data for this study are for U.S. firms over the ten-year period from January 1, 2006 to January 1, 2016. Fundamental financial data and stock returns are obtained from Compustat and CRSP.
Governance data and executive compensation were obtained from Execucomp and BoardEx. The initial sample consisted of 20,885 firm-years. After excluding financial firms (SIC codes from 6000 to 6999) as well as firms with incomplete data, the final sample consists of 8585 firm-years.
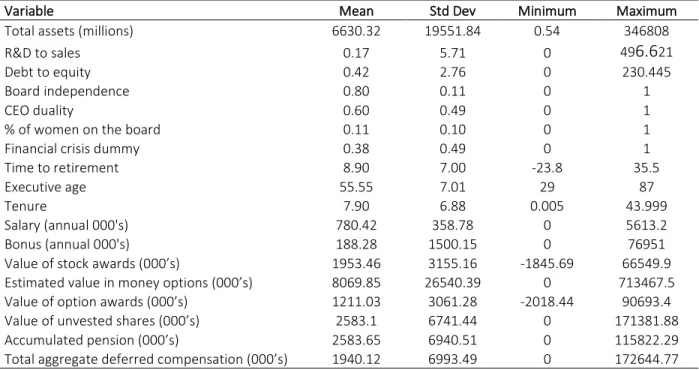
Table 1 provides some statistics on the dataset. The average size is $6.6 billion in total assets for all firms. The average inside debt compensation for CEOS is $2.6 million in accumulated pension for all firms, compared to $1.9 million in total deferred compensation. CEOs held an average of $1.2 million in option awards, $2.0 million in stock awards, $2.6 million in unvested shares and $8.1 million in estimated in-the-money unexercised options, across all firms. CEO’s annual salary averaged $780,000 with an average bonus of $188,000.
[Please insert Table 1 about here]
The average age of CEOs is 55 years old, with the oldest being 87 and the youngest at 29 years old. The average time to retirement is 9 years, based on an expected retirement age of 64 years old.
15
[Please insert Figure 2 about here] The variables and sources are summarized in the appendix.
Correlations
The variables in the model did not show problematic collinearity or correlation, based on Pearson correlation tests and Variance Inflation Factor tests. Some of the correlations among the independent variables showed correlations with the firm size proxy, log of total assets. The debt incentive variable was moderately correlated at |r| = 0.379. Board size showed a high correlation of |r| = 0.614 and the
percentage of women on the board showed a moderate correlation of |r| = 0.306 to the firm size. Board size and percentage of women on board are also moderately correlated to each other at |r| = 0.357.
[Please insert Table 2 about here]
Results
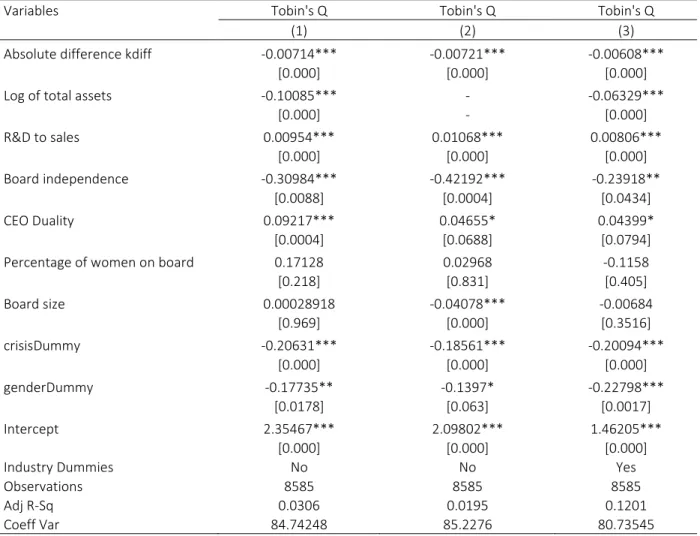
Table 3 summarizes the regression results of the first model, testing the Jensen and Meckling compensation structure hypothesis.
[Please insert Table 3 about here]
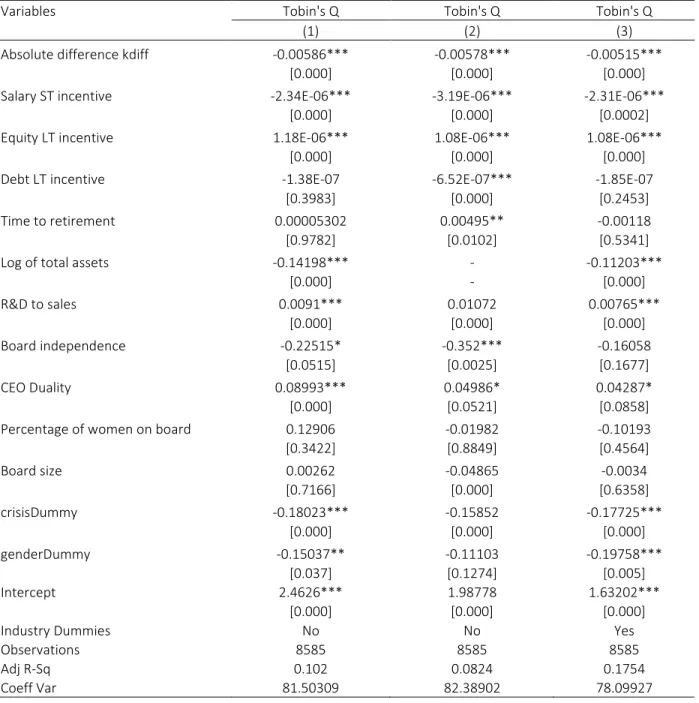
The table below summarizes the results of the regression model testing for CEO horizon and incentives. [Please insert table 4 about here]
16
5.
R
ESULTS AND
D
ISCUSSION
We do not reject the Jensen and Meckling (1976) hypothesis; tying executive capital structure to firm capital structure is positively related to firm performance.
We also find support for our second hypothesis. Time to retirement as such is not significant; young CEOs are not necessarily better. Large salaries for younger CEOSs with longer expected time to retirement is not beneficial, and that equity compensation is better for younger CEOs.
Debt incentives are generally not good overall but relatively better for older CEOs. Our result for debt incentives over time is not significant, though leverage can unfavorably affect the market value of the firm which may explain it. Interestingly, as CEO inside debt increases, the value of excess cash decreases, but for younger CEOs this effect is more pronounced. The excess cash value of a Euro declines to 0.1766 dollar for young CEOs and 0.5582 for older CEOs. Likely implying that the established reputations of older CEOs and their track records are known to the market (Belkhir, Boubaker et al. 2018).
Governance and Fixed Variables
There were no surprises in firm fixed effects. R&D expenditures are shown to increase valuation. This makes sense as investment in the future should lead to increasing valuations. Larger firms tended to have poorer performance.
The literature on CEO duality is mixed. Some argue that a CEO who also serves as the chairman of the board blurs the lines between ownership and control and exposes the firm to a greater risk of agency costs (Fama, Jensen 1983, Jensen 1993). Despite firms granting these CEOs a great deal of power, others have found no correlation or no evidence between lowered performance and CEO duality (Iyengar, Zampelli 2009, Carty, Weiss 2012), or weak evidence, particularly when controlling for long-term results (Baliga, Moyer et al. 1996). Others find mixed evidence, finding both that duality has a weak and insignificant effect of lower performance, but also that “duality is advantageous under conditions of resource scarcity or high complexity“ (Boyd 1995). My results show a positive and significant relationship between CEO duality and performance.
Board size was not significant. Board independence, however, was surprisingly significant and negatively related to firm performance.
17
A recent study finds that the board’s gender diversity “strengthens the relationship between CEO pay and firm performance” (Usman, Farooq et al. 2019). I found a positive, but insignificant, relationship between the percentage of women on the board and firm performance. Overall the average number of women on boards is relatively low, on average 11.5%, but more has a relatively promising upward trend reaching 18.49% in 2015.
[Please insert Figure 2 about here]
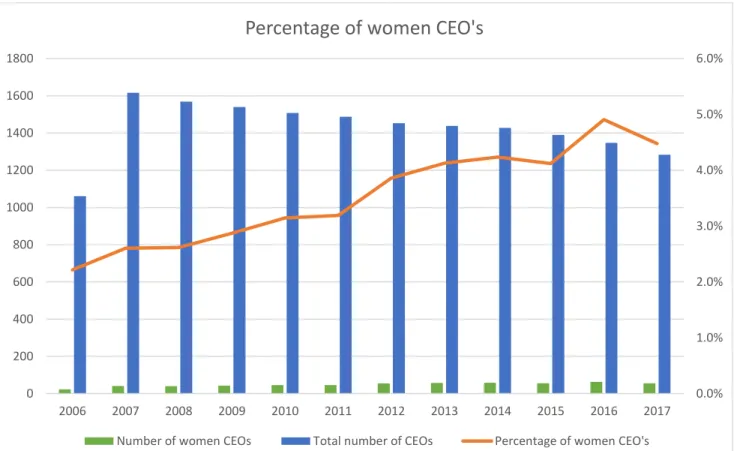
Discussions about gender and risk-taking, in particular, find that firms with female CEOs, on average, perform better and have lower risk levels, than those with male CEOs (Khan, Vieito 2013). The authors further find that “boards do not consider the risk aversion differences” between women and men executives when deciding on the structure of pay-for-performance compensation. My results indicate that there is negative link between women CEOs and Tobin’s Q. However, the number of women CEOs in my data was notably low. Out of 8585 firm-year data points, 289 of those had women CEOs (3.4%). The same percentage persists in the data before cleaning; 581 women CEOs out of 17,175 firm-years. Though my data includes only a subset of American firms, the general trend is not terribly encouraging, with only modest increases in female CEOs from 2006 to 2017.
[Please insert Figure 3 about here]
The financial crisis, unsurprisingly, had a negative effect on performance, but the overall results don’t change without the crisis dummy variable.
18
6.
C
ONCLUSION
CEO pay is assumed to be required and not necessarily an issue of self-selection. However, the decision on how to pay is the choice of the firm, often under influence from its top manager. The choice of CEO compensation with debt or otherwise is not exogenous, and not fixed over time. Executive compensation is likely to be influenced by a firm’s business environment and other external factors including risk exposure and the nature of the agency problems (Van Bekkum 2016). Firms and stakeholders need to understand how executive compensation structures affect firm performance and risk.
Is balancing the stockholder-bondholder conflict using both equity and debt-like compensation enough to motivate performance with an optimal amount of executive risk-taking over time, without exposing the firm to managerial short-termism? The risk of bankruptcy is not the only consequence; other forces like reputation, individual moral standards, or governance, may also work to curb undesirable behaviour. CEO compensation contracts are complicated, which suggests that the market is aware of the inherent complexities and externalities. In the words of Holmstrom and Milgrom (1987), “optimal incentive contracts tend to be complicated even in the simplest situations, making the models hard to work with in extended settings” (Holmstrom, Milgrom 1987).
This paper provides evidence that the incentive alignment effect of compensation differs depending on the firm and on the CEO horizon. The argument that executive equity compensation aligns the manager with shareholders and that debt compensation aligns the manager with debtholders, is over-simplified. Many factors, including perhaps even details in the compensation contracts, such as, precise pension agreement terms and vesting time of various deferred payments, could work to influence firm performance in the present.
19
B
IBLIOGRAPHY
ANANTHARAMAN, D., FANG, V.W. and GONG, G., 2013. Inside debt and the design of corporate debt contracts. Management Science, 60(5), pp. 1260-1280.
ANTIA, M., PANTZALIS, C. and PARK, J.C., 2010. CEO decision horizon and firm performance: An empirical investigation. Journal of Corporate Finance, 16(3), pp. 288-301.
ARCHAMBEAULT, D.S., DEZOORT, F.T. and HERMANSON, D.R., 2008. Audit committee incentive compensation and accounting restatements.
BALIGA, B.R., MOYER, R.C. and RAO, R.S., 1996. CEO duality and firm performance: What's the fuss?
Strategic Management Journal, 17(1), pp. 41-53.
BEBCHUK, L.A. and JACKSON JR, R.J., 2005. Executive pensions. Journal of Corporation Law, National Bureau of Economic Research, .
BEBCHUK, L.A. and FRIED, J.M., 2004. Stealth compensation via retirement benefits. National Bureau of Economic Research, No. w10742.
BEBCHUK, L.A. and FRIED, J.M., 2006. Pay without Performance: Overview of the Issues. Academy of Management Perspectives, 20(1), pp. 5-24.
BELKHIR, M., BOUBAKER, S. and CHEBBI, K., 2018. CEO inside debt and the value of excess cash. Journal of Applied Accounting Research, 19(2), pp. 225-244.
BETTIS, C., BIZJAK, J., COLES, J. and KALPATHY, S., 2010. Stock and option grants with performance-based vesting provisions. The Review of Financial Studies, 23(10), pp. 3849-3888.
BHAGAT, S. and ROMANO, R., 2009. Reforming executive compensation: Focusing and committing to the long-term. Yale J.on Reg., 26, pp. 359.
BOLTON, P., MEHRAN, H. and SHAPIRO, J., 2015. Executive compensation and risk taking. Review of Finance, 19(6), pp. 2139-2181.
BOYD, B.K., 1995. CEO duality and firm performance: A contingency model. Strategic Management Journal, 16(4), pp. 301-312.
BRANDER, J.A. and POITEVIN, M., 1992. Managerial compensation and the agency costs of debt finance.
Managerial and Decision Economics, 13(1), pp. 55-64.
BRICK, I.E., PALMON, O. and WALD, J.K., 2006. CEO compensation, director compensation, and firm performance: Evidence of cronyism? Journal of Corporate Finance, 12(3), pp. 403-423.
20
BRYAN, S., HWANG, L. and LILIEN, S., 2000. CEO stock‐based compensation: An empirical analysis of incentive‐intensity, relative mix, and economic determinants. The Journal of Business, 73(4), pp. 661-693.
BRYAN, S., HWANG, L. and LILIEN, S., 2005. CEO Compensation after Deregulation: The Case of Electric Utilities. The Journal of Business, 78(5), pp. 1709-1752.
CARTY, R. and WEISS, G., 2012. Does CEO duality affect corporate performance? Evidence from the US banking crisis. Journal of Financial Regulation and Compliance, 20(1), pp. 26-40.
CHAMBERS, E.G., FOULON, M., HANDFIELD-JONES, H., HANKIN, S.M. and MICHAELS, E.G., 1998. The war for talent. McKinsey Quarterly, , pp. 44-57.
CHUNG, K.H. and PRUITT, S.W., 1994. A simple approximation of Tobin's q. Financial Management, , pp. 70-74.
CORE, J.E., HOLTHAUSEN, R.W. and LARCKER, D.F., 1999. Corporate governance, chief executive officer compensation, and firm performance. Journal of Financial Economics, 51(3), pp. 371-406.
DEFUSCO, R.A., ZORN, T.S. and JOHNSON, R.R., 1991. The association between executive stock option plan changes and managerial decision making. Financial Management, , pp. 36-43.
DENIS, D.K., JOCHEM, T. and RAJAMANI, A., 2019. Shareholder Governance and CEO Compensation: The Peer Effects of Say on Pay. Available at SSRN 2909963, .
DENIS, D.K. and MCCONNELL, J.J., 2003. International corporate governance. Journal of financial and quantitative analysis, 38(01), pp. 1-36.
DENIS, D.J., DENIS, D.K. and SARIN, A., 1999. Agency Theory and the Influence of Equity Ownership Structure on Corporate Diversification Strategies. Strategic Management Journal, 20(11), pp. 1071-1076. DITTMAR, A. and MAHRT-SMITH, J., 2007. Corporate governance and the value of cash holdings. Journal of Financial Economics, 83(3), pp. 599-634.
EDMANS, A., FANG, V.W. and LEWELLEN, K.A., 2017. Equity vesting and investment. The Review of Financial Studies, 30(7), pp. 2229-2271.
EDMANS, A. and LIU, Q., 2010. Inside debt. Review of Finance, 15(1), pp. 75-102.
ELSON, C., 2003. What's wrong with executive compensation? Harvard business review, 81(1), pp. 68-77. FAHLENBRACH, R. and STULZ, R.M., 2011. Bank CEO incentives and the credit crisis. Journal of Financial Economics, 99(1), pp. 11-26.
FAMA, E.F., 1998. Market efficiency, long-term returns, and behavioral finance. Journal of Financial Economics, 49(3), pp. 283-306.
21
FAMA, E.F. and JENSEN, M.C., 1983. Separation of ownership and control. The Journal of Law & Economics, 26(2), pp. 301-325.
FREY, B.S. and OSTERLOH, M., 2005. Yes, managers should be paid like bureaucrats. Journal of Management Inquiry, 14(1), pp. 96-111.
GERHART, B. and MILKOVICH, G.T., 1990. Organizational differences in managerial compensation and financial performance. Academy of Management journal, 33(4), pp. 663-691.
GOMPERS, P.A., ISHII, J. and METRICK, A., 2010. Extreme governance: An analysis of dual-class firms in the United States. Review of Financial Studies, 23(3), pp. 1051-1088.
GUAY, W.R., 1999. The sensitivity of CEO wealth to equity risk: an analysis of the magnitude and determinants. Journal of Financial Economics, 53(1), pp. 43-71.
GUAY, W.R., KEPLER, J.D. and TSUI, D., 2019. The role of executive cash bonuses in providing individual and team incentives. Journal of Financial Economics, 133(2), pp. 441-471.
HAMBRICK, D.C., GELETKANYCZ, M.A. and FREDRICKSON, J.W., 1993. Top executive commitment to the status quo: Some tests of its determinants. Strategic Management Journal, 14(6), pp. 401-418.
HOLMSTROM, B. and MILGROM, P., 1987. Aggregation and linearity in the provision of intertemporal incentives. Econometrica: Journal of the Econometric Society, , pp. 303-328.
ITTNER, C.D., LAMBERT, R.A. and LARCKER, D.F., 2003. The structure and performance consequences of equity grants to employees of new economy firms. Journal of Accounting and Economics, 34(1), pp. 89-127.
IYENGAR, R.J. and ZAMPELLI, E.M., 2009. Self‐selection, endogeneity, and the relationship between CEO duality and firm performance. Strategic Management Journal, 30(10), pp. 1092-1112.
JENSEN, M.C., 2004. The agency cost of overvalued equity and the current state of corporate finance.
European Financial Management, 10(4), pp. 549-565.
JENSEN, M.C., 1993. The modern industrial revolution, exit, and the failure of internal control systems.
the Journal of Finance, 48(3), pp. 831-880.
JENSEN, M.C. and MECKLING, W.H., 1976. Theory of the firm: Managerial behavior, agency costs and ownership structure. Journal of Financial Economics, 3(4), pp. 305-360.
JENSEN, M.C. and MURPHY, K.J., 1990a. CEO incentives: It's not how much you pay, but how. Journal of Applied Corporate Finance, .
JENSEN, M.C. and MURPHY, K.J., 1990b. Performance Pay and Top-Management Incentives. Journal of Political Economy, 98(2), pp. 225-264.
22
JOHN, T.A. and JOHN, K., 1993. Top‐management compensation and capital structure. The Journal of Finance, 48(3), pp. 949-974.
KHAN, W.A. and VIEITO, J.P., 2013. CEO gender and firm performance. Journal of economics and business, 67, pp. 55-66.
LADIKA, T. and SAUTNER, Z., 2018. Managerial short-termism and investment: Evidence from accelerated option vesting. Available at SSRN 2286789, .
LAMBERT, R.A. and LARCKER, D.F., 1987. An analysis of the use of accounting and market measures of performance in executive compensation contracts. Journal of Accounting research, , pp. 85-125.
LIPPERT, R.L. and MOORE, W.T., 1995. Monitoring versus bonding: Shareholder rights and management compensation. Financial Management, , pp. 54-62.
LIU, Y., MAUER, D.C. and ZHANG, Y., 2014. Firm cash holdings and CEO inside debt. Journal of Banking & Finance, 42, pp. 83-100.
MARINOVIC, I. and VARAS, F., 2018. CEO Horizon, Optimal Pay Duration, and the Escalation of Short‐ Termism. The Journal of Finance, .
MINNICK, K. and ROSENTHAL, L., 2014. Stealth compensation: Do CEOs increase their pay by influencing dividend policy? Journal of Corporate Finance, 25, pp. 435-454.
MODIGLIANI, F. and MILLER, M.H., 1958. The cost of capital, corporation finance and the theory of investment. The American Economic Review, 48(3), pp. 261-297.
MORCK, R., SHLEIFER, A. and VISHNY, R.W., 1988. Management ownership and market valuation: An empirical analysis. Journal of Financial Economics, 20, pp. 293-315.
OZKAN, N., 2011. CEO compensation and firm performance: An empirical investigation of UK panel data.
European Financial Management, 17(2), pp. 260-285.
PARRINO, R. and WEISBACH, M.S., 1999. Measuring investment distortions arising from stockholder–
bondholder conflicts.
PEREL, M., 2003. An Ethical Perspective on CEO Compensation. Journal of Business Ethics, 48(4), pp. 381-391.
RAVIV, A. and SISLI-CIAMARRA, E., 2013. Executive compensation, risk taking and the state of the economy. Journal of Financial Stability, 9(1), pp. 55-68.
RYNES, S.L. and GERHART, B., 2000. Compensation in organizations. Current Research and Practice, 12 Edition in SIOP Frontiers Series, .
STRIER, F., 2007. Stealth compensation. International Journal of Disclosure and Governance, 4(2), pp. 132-144.
23
SUN, L. and HOVEY, M., 2017. The Endogeneity of Executive Compensation and its Impact on Management Discretionary Behavior over Financial Reporting. Available at SSRN 2912640, . SUNDARAM, R.K. and YERMACK, D.L., 2007. Pay me later: Inside debt and its role in managerial compensation. The Journal of Finance, 62(4), pp. 1551-1588.
SWITZER, L.N., 2007. Corporate governance, Sarbanes-Oxley, and small-cap firm performance. The Quarterly Review of Economics and Finance, 47(5), pp. 651-666.
TUNG, F. and WANG, X., 2012. Bank CEOs, inside debt compensation, and the global financial crisis. USMAN, M., FAROOQ, M.U., ZHANG, J., DONG, N. and MAKKI, M.A.M., 2019. Women on boards and CEO pay-performance link. International Journal of Manpower, .
VAN BEKKUM, S., 2016. Inside debt and bank risk. Journal of Financial and Quantitative Analysis, 51(2), pp. 359-385.
WEI, C. and YERMACK, D., 2011. Investor reactions to CEOs' inside debt incentives. The Review of Financial Studies, 24(11), pp. 3813-3840.
24
A
PPENDIX
List of Variables
Variable definitions and data sources.
Variables Definitions Data Sources
ComSharOutstanding Common shares outstanding at fiscal year end Compustat PriceCloseAnnFiscal Closing price shares at fiscal year end Compustat PreferredStockLiquid Preferred stock liquidating value Compustat CurrentLiabilitiesTotal Liabilities due within one year, including the current portion of
long-term debt
Compustat
TotalAssetsAT Firm total assets Compustat
CurrentAssetsTotal Represents cash and other assets that are expected to be realized in cash or used in the production of revenue within the next 12 months
Compustat
LongTermDebtTotDLTT Debt obligations due more than one year from the company's balance sheet date
Compustat
DateBecameCEO Date became CEO Execucomp
ValueofOptionAwards Value of Option Awards Execucomp
ValueofStockAwards Value of Stock Awards Execucomp
EstValInMoneyOptions Estimated Value of In-the-Money Unexercised Execucomp ValueUnvestedatFYearEnd Value of Unearned/Unvested Shares at Fiscal Year End Execucomp AccumulatedPension Present Value of Accumulated Pension Benefits from All Pension
Plans
Execucomp TotalAggregateDefComp Total Aggregate Balance in Deferred Compensation Plans at Fiscal
Year End
Execucomp
Gender Executive's gender Execucomp
ExecutiveAge Executive's age at the data date Execucomp
Tenure Calculated using the date the CEO became CEO in Execucomp and the data date in Compustat
Compustat/ Execucomp
boardSize Number of directors on the firm's board BoardEx
SDsOnBoard Number of supervisory directors on the board BoardEx IndependentNEDonBoard Number of non-executive directors BoardEx ExecChairCombinedCEO CEO duality or executive chairman present (1- Yes, 0 - No) BoardEx IndependentNEDpastCFO Number of independent non-executive director with past CFO/FD
role
BoardEx
PercentWomen Percentage of women on board BoardEx
rndExpense Research and Development Expense Compustat
25
F
IGURES
Figure 1: Distribution of CEO age in the sample
Figure 1 shows the age distribution of CEOs in the final dataset. (N = 8585)
Figure 2: Distribution of Time to Retirement in the sample
26
Figure 3: Percentage of women on boards (2006 to 2015)
Figure 3 shows the percentage of women on boards in final dataset which includes 8585 firm-years.
Figure 4: Number of women CEOs (exclude financial firms) N=17175
The figure shows the percentage and number of CEOs in the dataset after financial firms were removed.
0% 2% 4% 6% 8% 10% 12% 14% 16% 18% 20% 2006 2007 2008 2009 2010 2011 2012 2013 2014 2015
Percentage of women on boards
0.0% 1.0% 2.0% 3.0% 4.0% 5.0% 6.0% 0 200 400 600 800 1000 1200 1400 1600 1800 2006 2007 2008 2009 2010 2011 2012 2013 2014 2015 2016 2017
Percentage of women CEO's
27
T
ABLES
Table 1: Descriptive Statistics
Table 1 provides the summary statistics of the variables that were used in the models, or in calculating model variables. N= 8585
Variable Mean Std Dev Minimum Maximum
Total assets (millions) 6630.32 19551.84 0.54 346808
R&D to sales 0.17 5.71 0 49
6.6
21Debt to equity 0.42 2.76 0 230.445
Board independence 0.80 0.11 0 1
CEO duality 0.60 0.49 0 1
% of women on the board 0.11 0.10 0 1
Financial crisis dummy 0.38 0.49 0 1
Time to retirement 8.90 7.00 -23.8 35.5
Executive age 55.55 7.01 29 87
Tenure 7.90 6.88 0.005 43.999
Salary (annual 000's) 780.42 358.78 0 5613.2
Bonus (annual 000's) 188.28 1500.15 0 76951
Value of stock awards (000’s) 1953.46 3155.16 -1845.69 66549.9
Estimated value in money options (000’s) 8069.85 26540.39 0 713467.5
Value of option awards (000’s) 1211.03 3061.28 -2018.44 90693.4
Value of unvested shares (000’s) 2583.1 6741.44 0 171381.88
Accumulated pension (000’s) 2583.65 6940.51 0 115822.29
28
Table 2: Correlation table
Table 2 provides the Pearson correlation coefficients of all the variables used in the regression models.
Pearson Correlation Coefficients, N = 8585 Prob > |r| under H0: Rho=0
tobinsQ 1 2 3 4 5 6 7 8 9 10 11 12
Log of total assets 1 -0.1275
<.0001 R&D to sales 2 0.05373 -0.05558 <.0001 <.0001 Board independence 3 -0.04639 0.19048 -0.0019 <.0001 <.0001 0.8603 CEO duality 4 0.01125 0.19471 -0.00683 -0.08274 0.2973 <.0001 0.5268 <.0001 % of women on board 5 -0.03136 0.30626 -0.02378 0.20627 0.06644 0.0037 <.0001 0.0276 <.0001 <.0001 Board size 6 -0.08109 0.61483 -0.02012 0.19124 0.1025 0.35722 <.0001 <.0001 0.0623 <.0001 <.0001 <.0001 crisisDummy 7 -0.07279 -0.08367 0.00988 -0.06612 0.03662 -0.07674 -0.02626 <.0001 <.0001 0.3601 <.0001 0.0007 <.0001 0.015 genderDummy 8 -0.0228 -0.00469 -0.00439 0.04379 -0.02653 0.25555 0.02191 -0.01431 0.0346 0.664 0.6843 <.0001 0.014 <.0001 0.0424 0.185
Absolute difference kdiff 9 -0.05661 0.00795 -0.00335 -0.08245 0.02487 -0.01185 0.01434 0.014 -0.00372 <.0001 0.4614 0.7562 <.0001 0.0212 0.2722 0.1839 0.1945 0.7302 Time to retirement 10 0.07638 -0.12643 -0.00667 0.02418 -0.21313 -0.02623 -0.04933 0.08345 0.02113 -0.06416 <.0001 <.0001 0.5379 0.0255 <.0001 0.0154 <.0001 <.0001 0.0511 <.0001 Salary ST incentive 11 -0.00086 0.1165 -0.0066 0.007 -0.01164 0.02607 0.08494 0.02152 0.00374 -0.01509 0.31275 0.9369 <.0001 0.542 0.5182 0.2825 0.0161 <.0001 0.0468 0.7297 0.1634 <.0001 Equity LT incentive 12 0.23671 0.22686 -0.00595 0.03832 0.0444 0.07332 0.12865 -0.05092 -0.01224 -0.03713 0.27407 0.22411 <.0001 <.0001 0.5829 0.0004 <.0001 <.0001 <.0001 <.0001 0.2584 0.0006 <.0001 <.0001 Debt LT incentive 13 -0.0014 0.37916 -0.00876 0.139 0.11677 0.17701 0.26986 -0.00652 0.00379 0.01546 0.08954 0.11768 0.29082 0.897 <.0001 0.4188 <.0001 <.0001 <.0001 <.0001 0.5472 0.7261 0.1535 <.0001 <.0001 <.0001
29
Table 3: Summary of Regression Results – H1
The table below shows all regression results for the model testing H1, Jensen and Meckling’s debt proportion premise, with dependent variable Tobin’s Q. P-values are reported in the parentheses. The number of observations, adjusted R2 and the coefficient of variation for the model are provided. ***, **, and * indicate significance at the 1%, 5% and 10% levels, respectively.
(1) Results for the model: 𝑇𝑜𝑏𝑖𝑛′𝑠 𝑄 = 𝑎
0+ 𝑎1𝐾𝑑𝑖𝑓𝑓 + 𝑎2log(𝑇𝑜𝑡𝑎𝑙 𝐴𝑠𝑠𝑒𝑡𝑠 𝑜𝑓 𝑡ℎ𝑒 𝐹𝑖𝑟𝑚) +
𝑎3𝑅𝑛𝐷 𝑡𝑜 𝑆𝑎𝑙𝑒𝑠 + 𝑎4𝐵𝑜𝑎𝑟𝑑 𝑆𝑖𝑧𝑒 + 𝑎5𝐵𝑜𝑎𝑟𝑑 𝐼𝑛𝑑𝑒𝑝𝑒𝑛𝑑𝑒𝑛𝑐𝑒 + 𝑎6𝐶𝐸𝑂 𝐷𝑢𝑎𝑙𝑖𝑡𝑦 +
𝑎7 𝑃𝑒𝑟𝑐𝑒𝑛𝑡𝑎𝑔𝑒 𝑜𝑓 𝑊𝑜𝑚𝑒𝑛 𝑜𝑛 𝑡ℎ𝑒 𝐵𝑜𝑎𝑟𝑑 + 𝑎8 𝐹𝑖𝑛𝑎𝑛𝑐𝑖𝑎𝑙 𝐶𝑟𝑖𝑠𝑖𝑠 𝐷𝑢𝑚𝑚𝑦 + 𝑎9 𝐺𝑒𝑛𝑑𝑒𝑟 𝐷𝑢𝑚𝑚𝑦 + 𝜀 (2) The model without log of total assets. (3) The model with Industry dummies, which are used but not shown.
Variables Tobin's Q Tobin's Q Tobin's Q
(1) (2) (3)
Absolute difference kdiff -0.00714*** -0.00721*** -0.00608***
[0.000] [0.000] [0.000]
Log of total assets -0.10085*** - -0.06329***
[0.000] - [0.000] R&D to sales 0.00954*** 0.01068*** 0.00806*** [0.000] [0.000] [0.000] Board independence -0.30984*** -0.42192*** -0.23918** [0.0088] [0.0004] [0.0434] CEO Duality 0.09217*** 0.04655* 0.04399* [0.0004] [0.0688] [0.0794]
Percentage of women on board 0.17128 0.02968 -0.1158
[0.218] [0.831] [0.405] Board size 0.00028918 -0.04078*** -0.00684 [0.969] [0.000] [0.3516] crisisDummy -0.20631*** -0.18561*** -0.20094*** [0.000] [0.000] [0.000] genderDummy -0.17735** -0.1397* -0.22798*** [0.0178] [0.063] [0.0017] Intercept 2.35467*** 2.09802*** 1.46205*** [0.000] [0.000] [0.000]
Industry Dummies No No Yes
Observations 8585 8585 8585
Adj R-Sq 0.0306 0.0195 0.1201
30
Table 4: Summary of Regression Results – H2
The table below shows all regression results for the model testing H2, the CEO horizon incentives, with dependent variable Tobin’s Q. P-values are reported in the parentheses. The number of observations, adjusted R2 and the coefficient of variation for the model are provided.
(1) Results for the model: 𝑇𝑜𝑏𝑖𝑛′𝑠 𝑄 = 𝑎
0+ 𝑎2𝐾𝑑𝑖𝑓𝑓 + 𝑎3𝑇𝑖𝑚𝑒 𝑡𝑜 𝑅𝑒𝑡𝑖𝑟𝑒𝑚𝑒𝑛𝑡 + 𝑎4 𝑆𝑎𝑙𝑎𝑟𝑦 𝐼𝑛𝑐𝑒𝑛𝑡𝑖𝑣𝑒 +
𝑎5 𝐸𝑞𝑢𝑖𝑡𝑦 𝐼𝑛𝑐𝑒𝑛𝑡𝑖𝑣𝑒 + 𝑎6 𝐼𝑛𝑠𝑖𝑑𝑒 𝐷𝑒𝑏𝑡 𝐼𝑛𝑐𝑒𝑛𝑡𝑖𝑣𝑒 + 𝑎1log(𝑇𝑜𝑡𝑎𝑙 𝐴𝑠𝑠𝑒𝑡𝑠 𝑜𝑓 𝑡ℎ𝑒 𝐹𝑖𝑟𝑚) + 𝑎7𝑅𝑛𝐷 𝑡𝑜 𝑆𝑎𝑙𝑒𝑠 +
𝑎8𝐵𝑜𝑎𝑟𝑑 𝑆𝑖𝑧𝑒 + 𝑎9𝐵𝑜𝑎𝑟𝑑 𝐼𝑛𝑑𝑒𝑝𝑒𝑛𝑑𝑒𝑛𝑐𝑒 + 𝑎10𝐶𝐸𝑂 𝐷𝑢𝑎𝑙𝑖𝑡𝑦 + 𝑎11 𝑃𝑒𝑟𝑐𝑒𝑛𝑡𝑎𝑔𝑒 𝑜𝑓 𝑊𝑜𝑚𝑒𝑛 𝑜𝑛 𝑡ℎ𝑒 𝐵𝑜𝑎𝑟𝑑 +
𝑎12 𝐹𝑖𝑛𝑎𝑛𝑐𝑖𝑎𝑙 𝐶𝑟𝑖𝑠𝑖𝑠 𝐷𝑢𝑚𝑚𝑦 + 𝑎13 𝐺𝑒𝑛𝑑𝑒𝑟 𝐷𝑢𝑚𝑚𝑦 + 𝜀 (2) The model without log of total assets. (3) The model with Industry dummies, which are used but not shown.
Variables Tobin's Q Tobin's Q Tobin's Q
(1) (2) (3)
Absolute difference kdiff -0.00586*** -0.00578*** -0.00515***
[0.000] [0.000] [0.000]
Salary ST incentive -2.34E-06*** -3.19E-06*** -2.31E-06***
[0.000] [0.000] [0.0002]
Equity LT incentive 1.18E-06*** 1.08E-06*** 1.08E-06***
[0.000] [0.000] [0.000]
Debt LT incentive -1.38E-07 -6.52E-07*** -1.85E-07
[0.3983] [0.000] [0.2453]
Time to retirement 0.00005302 0.00495** -0.00118
[0.9782] [0.0102] [0.5341]
Log of total assets -0.14198*** - -0.11203***
[0.000] - [0.000] R&D to sales 0.0091*** 0.01072 0.00765*** [0.000] [0.000] [0.000] Board independence -0.22515* -0.352*** -0.16058 [0.0515] [0.0025] [0.1677] CEO Duality 0.08993*** 0.04986* 0.04287* [0.000] [0.0521] [0.0858]
Percentage of women on board 0.12906 -0.01982 -0.10193
[0.3422] [0.8849] [0.4564] Board size 0.00262 -0.04865 -0.0034 [0.7166] [0.000] [0.6358] crisisDummy -0.18023*** -0.15852 -0.17725*** [0.000] [0.000] [0.000] genderDummy -0.15037** -0.11103 -0.19758*** [0.037] [0.1274] [0.005] Intercept 2.4626*** 1.98778 1.63202*** [0.000] [0.000] [0.000]
Industry Dummies No No Yes
Observations 8585 8585 8585
Adj R-Sq 0.102 0.0824 0.1754