Pace University
DigitalCommons@Pace
Honors College Theses Pforzheimer Honors College
Fall 12-2017
EVA: An Indicator of Corporate Bankruptcy?
Amanda (Jinxian) Lu Honors College, Pace University
Follow this and additional works at:http://digitalcommons.pace.edu/honorscollege_theses
Part of theAccounting Commons, and theFinance and Financial Management Commons
This Thesis is brought to you for free and open access by the Pforzheimer Honors College at DigitalCommons@Pace. It has been accepted for inclusion in Honors College Theses by an authorized administrator of DigitalCommons@Pace. For more information, please contactrracelis@pace.edu.
Recommended Citation
Lu, Amanda ( Jinxian), "EVA: An Indicator of Corporate Bankruptcy?" (2017).Honors College Theses. 160.
EVA: An Indicator of Corporate Bankruptcy?
Amanda (Jinxian) Lu
Finance and Accounting
Dr. Aron Gottesman
Finance and Economics, Lubin School of Business, Pace University
December 13th, 2017
To the Pace Pforzheimer Honors College:
As thesis advisor for: _____________________________________,
I have read this paper and find it satisfactory.
_______________
Thesis Advisor
___________
Date
Economic value added (EVA) analysis is one of the most common methods to evaluate company’s performance in terms of value creation, which involves ROIC (Return on Invested Capital) and WACC (Weighted Average Cost of Capital) as key drivers. Past studies evaluate the superiority of EVA over other measures of performance and relationship between EVA and stock returns. This paper analyzes the relationship between EVA and bankruptcy on 373 public traded companies in U.S. of which 178 companies filed for bankruptcy between the year of 2015 to October 2017. We present descriptive statistics, conduct univariae grouping tests and
correlation between ROIC, WACC, NOPAT, and EVA, and logistic regression analysis for each sector. The results show that non-bankrupt firms tend to have higher WACC (compared to relative very low and negative WACC of bankrupt companies), higher NOPAT, and higher ROIC. EVA has correlation with bankruptcy but its significant level varies across sectors. The findings also suggest that WACC is another good indicator of bankruptcy.
1.
Introduction
Traditional performance measures are frequently used in evaluating companies’
performance. Those measures include but not limited to ratios such as EPS, ROA, ROE, gross margin. Although companies appear profitable by looking at those traditional measures, it does not necessarily mean that they are creating incremental value to company or more importantly to shareholders.
The concept of Economic Value Added (EVA) is initially brought up by a business consulting firm Stern Stewart & Co. and it published a book, The Quest of Value (Stewart, 1991). EVA is viewed as a better performance measure than traditional accounting measures in evaluating corporate performance because it takes into account of cost of capital and measures value creation on a continuous basis (Stewart, 1994).
Prior research on is broadly conducted on the topic of EVA. The studies can be
categorized into several categories such as EVA’s relationship to shareholder’s wealth in
relation to stock returns, relationship between EVA and MVA, EVA as a performance measurement tool, and EVA’s relationship with executive compensation. These studies suggest the superiority of EVA over other traditional performance measures, however, some argue that EVA is not better than the traditional performance measures.
One of the hottest research topic related to EVA and its relationship to stock returns. Kumar, Katepogu Kiran and Subramanyam (2017) evaluate the stock performance of 20 companies in cement industry in India over the period of 2005 - 2006 and 2014 - 2015. They use multiple regression with step-wise method to test the superiority of EVA and MVA in relation to stock returns. Their results reveal that both EVA and MVA are significant
in financial performance, however, EVA is a superior measure for creating value to shareholders in terms stock returns.
Nakhaei and Hamid (2013) study on 87 non-financial companies listed in TSE (Tehran Stock Exchange) over the period of 2004 – 2008 testing relative explanatory power of EVA versus operational profit and net profit in describing share market value (MV). They use Pearson correlation coefficient and regression method. Their results show that net profit and operational profit has more explanatory power than EVA although EVA does have a signification correlation with share market value. Of the two measures, net profit and operational profit, net profit has the most significant relationship with MV.
Samadiyan, Pooryeganeh, Ebrahimi, and Ghanbari (2013) also research on 120 companies that are listed on TSE (Tehran Stock Exchange) during the period of 2003 and 2010 to test its hypothesis of whether EVA, NOPAT, and operational cash flow has
meaningful relationship with stock return besides whether EVA or operational cash flows has more data content than NOPAT in describing stock return behavior and whether EVA has more differential (increasing) data content than the other measures. They use panel regression to test the relative and differential data content of EVA and two other traditional measures, NOPAT and operational cash flows. Their results show that all three measures have meaningful relationship with stock returns in general. However, NOPAT is better in explaining the traits of stock returns than EVA and operational cash flow has more
important differential (increasing) data content than EVA. They conclude that their findings do not support the superiority of EVA in describing stock return behavior.
Similarly, Eswara and Venkat (2016) do not support the superiority of EVA over traditional measures such as ROE, ROA, ROCE (Return On Capital Employed), ROS (Return
On Sales), and EPS in their research on 12 Indian companies between 2010 and 2014, which are also traded on NSE (National Stock Exchange of India). Of the 12 companies, 50% are from cement industry while the rest from FMGG (Fast-Moving Consumer Goods)
industry. Although the data sample seems quite small, Eswara and Venkat suggest a combination of traditional measures and adjusted EVA together be used in better evaluating financial performance. They conclude that EVA is not found superior in
shareholder wealth in terms of stock returns as a result of correlation and linear regression tests.
Corresponding to an increasing interest in shareholder value management by companies stemming from Stern Steward’s EVA concept another popular research area is on analyzing relationship between EVA and MVA (market value added). He states that EVA is best reflects the success of companies adding value to their shareholders. Stewart (1991) also brings up the concept of EVA as a proxy for MVA.
Fernandez (2015) analyzes 582 companies in the U.S. using data provided in Stern
Stewart’s publication that includes EVA, MVA, NOPAT, and WACC (Weighted Average Cost
of Capital). Fernandez calculates 10-year correlation between change in MVA versus EVA, NOPAT, and WACC each year. The results show that in 50% of the companies the
correlation between change in MVA and NOPAT is greater than change in MVA and EVA, suggesting NOPAT is more correlated to MVA than EVA. It also shows that about 210 companies have a negative relationship between EVA and MVA.
Yahyazadehfar, Shams, and Larimi (2010) also explores whether ROE, ROA, EPS versus EVA has significant relationship on MVA. They focus on companies listed in TSE over the
period between 1379 -1385. Their results indicate that ROE and EVA both have significant relationship with MVA while ROA and EPS both do not have relationship with MVA. The
As the ultimate goal of a company is to maximize shareholders’ wealth, some studies in the past explore the area of whether EVA is a good performance measure of shareholder wealth creation. Panigrahi (2017) investigates on shareholder’s wealth creation comparing EVA and traditional accounting measures in the context of 280 public traded companies in Malaysia over the period of 2003 and 2012. Panigrahi use panel data analysis techniques that include Error Correction Model and Ordinary Least Squares regression to test the hypothesis of whether EPS (Earnings Per Shares), ROA (Return on Assets), ROE (Return on Equity), ROCE (Return On Capital Employed), NOPAT (Net Operating Profit After Tax), DPR (Dividend Payout Ratio), EVA, and MVA (Market Value Added), is an important
performance measure for creating shareholder’s wealth. The results suggest that EPS, EVA, and DPR has significant positive relationship with shareholder wealth creation while MVA has a negative relationship with CSV (Created Shareholder Value), which supports the neo-classical theory that says value maximization and market efficiency fail to provide an explanation of crucial aspects of organizational development. Panigrahi also suggests managers can ensure their decisions can create value if using EPS, EVA, and DPR as performance measurement tools.
The comparison of EVA and traditional measures in describing financial performance such as profitability is another popular research area.
Reddy, Narayan, and Poornima (2015) examine the relationship between EVA and other traditional measures such as EPS, ROIC, RONW (Return On Net Worth). Their
the two periods between 2009 – 2010 and 2013 – 2014. They first rank the companies based on average of EVA performance and select the top 10 companies to be used in their methods. They use Pearson’s correlation matrix and regression methods to test two hypotheses that whether there exits significant difference between the mean values of the variables and whether there exists no significant impact of EPS, ROIC, and RONW on EVACE (EVA Capital Employed). Their finds indicate that there exists significant difference in mean values of variables. Of the three variables, ROIC has significant influence on EVACE.
Chen, Wang, and Qiao (2014) incorporate ABC (Activity Based Costing) and EVA to improve the DuPont Model. They find that EVA brings the advantage on performance
evaluation and BAC’s advantage of tracing costs to products by activities consumed. They conclude that the improved model provides useful information that helps improve
activities management and resources optimization and correctly evaluates the product’s
profitability as costs are accurately reflected. EVA-ABC based DuPont profitability analysis also reflects the goal of maximizing shareholder value. They also point out the limitation of the model as they find WACC difficult to define and EVA too complex for adjustments besides lack of sufficient cost management data in cost calculation of ABC method.
Other than researching on the relationship between EVA and profitability, Ivanov, Leong and Zaima (2014) study the performance of only negative EVA firms using Stern Stewart Company database that composes of 1000 market value added firms. They identified total 623 negative EVA firms as of 2003 year-end of which they further break down into 4 quartiles by EVA ranking from most to least negative. The 4 portfolios’
performance are then evaluated from 2004 to 2009. They use univariate and multivariate analysis to test correlation between performance and four traditional measures ROA, MTB
(Market-to-Book ratio), leverage, and size is examined. Their finds indicate they NOPAT, MTB, and size are not good indicators of performance for firms that experience negative EVA. Among 4 traditional measures, leverage correlates to firm performance. They find that negative EVA firms that have lower leverage generally have higher possibility of turning around. Firms with the least negative EVA experience higher returns, suggesting investors who consider investing in negative EVA firms should invest in near-zero EVA ones with lower leverage because these firms tend to earn abnormal returns.
Makhele (2013) explore post-acquisition performance using EVA on 336 acquired companies listed in South Africa from 2000 to 2011. Makhele uses paired sample t-test to examine the level of significance between EVA and traditional measures, EPS, ROA, ROE, and ROC (Return On Capital). The results indicate that acquiring firms experience
significantly deteriorating EVA post-acquisition while tend to have slightly improvement on operating performance if using traditional measures but these measures are not
significant in influencing performance. However, the improved performance is offset by the large premiums paid in acquisition, creating no real economic gains. Thus, Makhele
concludes that acquisitions are zero NPV (Net Present Value) investments for acquiring firms.
Holian and Reza conducts research on evaluating how much better EVA can explain the firm and industry fixed-effect model than simple accounting measures of profit. Holian and Reza explore the relative importance of firm versus industry effects in explaining firm performance (2011) using ROA and EVA as dependent variables on U.S large corporations. They find that EVA contributes to greater explanatory power of the model than ROA as EVA can explain over 50% of the variation in firm profitability.
Interest alignment between managers and owners of a firm can be strengthened by adopting EVA in performance management. EVA based remuneration gains popularity in prior research studies. Sloof and Randolph (2014) test whether residual income based performance measure, EVA is manipulative by managers. They compare 67 firms listed on NYSE (New York Stock Exchange) that adopted EVA in executive remuneration contracts and a matched sample of non-adopter companies using difference-in-differences approach. The results suggest that EVA is a distorted performance measure as it can be manipulated easily. They come up with a hypothesis that managers may increase short term EVA at the cost of future EVA and managers may try to avoid negative EVA projects even if they are profitable in the long run. However, they also conclude that their finds do not infer EVA is a poor performance measure.
De Wet (2012) research on South African companies during the period 2006-2010 to test the relationship between executive compensation and EVA, MVA, ROA, and ROE. De Wet uses regression and robustness test and the results indicate that the relationships between compensation and ROA and ROE measures are stronger compared to
relationships between compensation and EVA and MVA. Of EVA and MVA measures, EVA is has stronger relationship with executive compensation than MVA. De Wet also concludes that companies with high EVA have significant relationship between MVA and executive compensation while low-EVA companies there is no relationship between compensation with either MVA or EVA. De Wet also mentions that South African companies seem to rely more on ROA and ROE in valuing compensation unlike American companies, which tend to reply more EVA and MVA.
year. Bankrupt companies are across different industries. As of early October 2017 year end, 40.26% of bankrupt companies come from consumer discretionary and consumer staples industries followed by 23.38% from energy industry. For example, the household toy brand store, Toys R US Inc. filed Chapter 11 bankruptcy in September 2017. The frequent occurrence of bankruptcy draws the interest in raising a question of whether there exists some relationship between bankruptcy and indicative measures that show correlation with bankruptcy.
Despite prior research has demonstrated correlated relationship between EVA and stock returns and MVA besides the benefits to companies who adopt EVA as part of
performance management, the exploration on the connection between EVA and bankruptcy remains open. Recent research study concentrates on EVA as a tool in performance
management and consequences of bad financial performance can lead to corporate bankruptcy in which companies file Chapter 11 (Reorganization) or Chapter 7
(Liquidation) bankruptcy. EVA tells whether economic profit is generated to the company after counting for cost of capital, thus it will be also interesting to know whether economic profit can be a good indicator of bankruptcy as prior research show different aspects on how EVA can be a good indicator of financial performance.
This paper will further analyze performance in terms of bankruptcy rather than profitability, which prior research is already being conducted on. To conduct this research, a sample of 373 U.S. public traded companies is formed. The sample list of companies contains 178 companies that have filed for bankruptcy during the period of 2015 to
October 2017 across multiple sectors including Consumer, Energy, Financials, Health Care, Industrials, Materials, Technology, and Utilities. The rest of the sample are non-bankruptcy
public companies that are peers to the bankruptcy companies randomly chosen across all the industries bankruptcy companies are in.
This rest of the paper is organized in following way: Section 2 presents the hypothesis that are being tested on. Section 3 shows how data is gathered (details can be found in Appendix) and descriptive statistics for each sector based on bankrupt and non-bankrupt group to compare the average financial performance between bankrupt and non-bankrupt group in each sector. Section 4 presents univariate grouping tests that helps to find out the distribution of bankruptcy in different sector. Section 5 shows correlation between ROIC, WACC, EVA, and NOPAT variables by entire sample, bankrupt sample, and non-bankrupt sample. Section 6 displays logistic regression analysis for each sector, which will help discover the significance of EVA in each sector. Section 7 shows conclusions after presenting the results and implication of this research study. Reference and Appendix are also included at the end.
2.
Research question
This research intends to ask the question of whether there exists relationship between EVA and bankruptcy.
Hypothesis: There exists significant relationship between EVA and bankruptcy across sectors.
3.
Data and sampling method
Bloomberg is used as a secondary data source for the sample list of companies in this research. As there is tremendous amount of public and private companies that filed for bankruptcy including Chapter 11 and Chapter 7, the sample list of companies only focus on public traded companies as their financial statements are available to the public compared to private companies of which financials are not released in the public. The period of bankruptcy
filing traced back from 2015 to October 2017, which is about two calendar years.
The entire sample contain 178 bankruptcy filing companies and the other non-bankrupt 195 companies are peers to the 178 companies across different sectors. The peer companies are picked based on the sectors and randomly chosen to form this entire sample. (See Appendix for more details). Composition of the sample include companies’ tickers, bankruptcy announcement date, WACC, ROIC, total invested capital, adjusted NOPAT, EVA, financial leverage, net liability, and BICS sector. These financials are all derived from Bloomberg using the most recent quarter’s financials. For bankruptcy filing companies, their financials are only up to the most recent quarter when their business was still active.
3.1 Descriptive statistics by entire sample
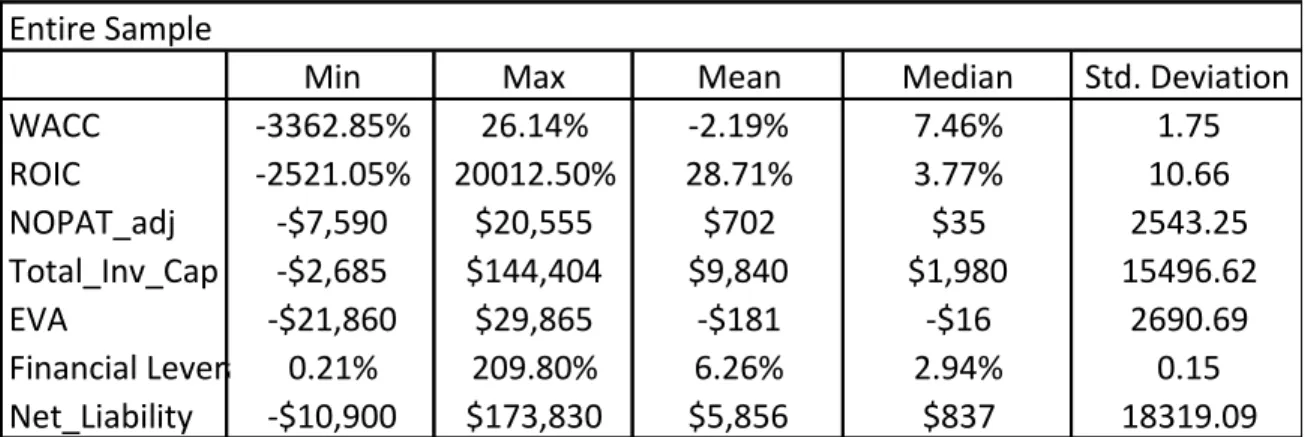
The entire sample consists a lot of data points and below is a table that presents the variables that the in interest of exploration. From Table 1, the range of each variable and their mean, median, and standard deviation are shown. Some variables such as WACC, ROIC, and financial leverage are interpreted in percentage while others such as NOPAT, total invested capital, EVA, and net liability are presented in dollar sign. As the entire sample covers 373 companies, the range of each variable is quite broad. WACC is ranged from negative about 3363% to positive 26.14% with the median being 7.46%. A negative WACC indicates a negative equity, meaning a
company has accumulated equity loss. Similar to WACC, ROIC is ranged from negative 2,522% to positive 20,013%, showing that some companies suffer from a huge loss while some can earn a positive return. Financial leverage is ranged from 0.21% to 209.80%, showing that some companies carry very low leverage while some carry high leverage. Net liability is the difference between total assets and total liabilities. When there are more liabilities than assets, net liability will be negative. A positive net liability means that more assets than liabilities. Adjusted
NOPAT, total invested capital, and EVA are also ranged from negative to positive.
This table shows min, max, mean, median, and standard deviation of important variables that include WACC, ROIC, adjusted NOPAT, total invested capital, EVA, financial leverage, and net liability for entire sample of 373 companies.
Of the 373 companies, energy companies occupies large portion of the entre sample followed by consumer discretionary with and quatity of 80 and 65 respectively as can be seen in Table 1.2. The size of Health Care, Financials, and Industrials companies is similar to each other. Matierlas, Communications, Comsumer Staples, and Technology companies also have simialr size in the sample with Utilities companies having the least amount. There are 59 companies filing bankruptcy in 2015 compared to 79 in 2016. As of the end of
October 2017, there are about 40 companies that filed bankruptcy. Non-bankrupty companies are chosen as benchmark, which has about 195 companies, which are also included in Table 1.2.
Table 1 Entire Sample
Min Max Mean Median Std. Deviation WACC -3362.85% 26.14% -2.19% 7.46% 1.75 ROIC -2521.05% 20012.50% 28.71% 3.77% 10.66 NOPAT_adj -$7,590 $20,555 $702 $35 2543.25 Total_Inv_Cap -$2,685 $144,404 $9,840 $1,980 15496.62 EVA -$21,860 $29,865 -$181 -$16 2690.69 Financial Leverage 0.21% 209.80% 6.26% 2.94% 0.15 Net_Liability -$10,900 $173,830 $5,856 $837 18319.09
Table 1.2 shows 10 sectors that 373 companies fall in. BICS stand for Bloomberg Industry Classification Systems. There is also 1 unclassifible companies as the BICS sector does not include. It is in the aersospace and defense sector, which will not be covered in the rest of the paper. Table 1.3 summarizes the amount of bankruptycy filing by year with the bottom showing the number of non-bankrupty compoanies in the entire sample.
From looking at the statistics of the entire sample, it will also be interested to know
whether there will be more negative data points leaning toward the bankruptcy companies as these companies generally do not perform well financially speaking. Compare Table 2 with Table 1, we can find that the minimum of WACC, ROIC, total invested capital, financial leverage, and net liability belongs to the bankrupty sample with only two variables,
adjusted NOPAT and EVA coming from the non-bankrupty sample. It is also suprising to find that the most negative EVA and adjusted NOPAT come from non-bankrupt companies sample, meaning that there are companies that have very low EVA and NOPAT can still survivie and have not yet went bankrupt.
Table 1.2
BICS Sector # of Companies
Energy 80 Consumer Discretionary 65 Health Care 35 Financials 34 Industrials 34 Materials 29 Communications 24 Consumer Staples 25 Technology 27 Utilities 19 Unclassifiable 1 Table 1.3
Filing Year Bankruptcy Filing
2015 59
2016 79
2017 40
non-bankrupt 195
Table 2 Table 3
Bankrupt Companies Non - Bankrupt Companies
Min Max Mean Median Std. Deviation Min Max Mean Median Std. Deviation WACC -3362.85% 26.14% -13.69% 6.13% 2.53 WACC 3.94% 18.36% 8.31% 8.28% 0.02 ROIC -2521.05% 20012.50% 60.25% -9.27% 15.42 ROIC -893.02% 48.38% -0.08% 7.22% 0.80 NOPAT_adj -$4,407 $705 -$132 -$7 527.03 NOPAT_adj -$7,590 $20,556 $1,462 $490 3306.06 Total_Inv_Cap -$2,685 $16,245 $572 $77 1743.51 Total_Inv_Cap $48 $144,404 $18,299 $21,106 17520.79 EVA -$4,598 $29,865 $8 -$15 2310.68 EVA -$21,860 $8,066 -$354 -$25 2991.36 Financial Leverage 0.21% 209.80% 10.44% 3.68% 0.25 Financial Leverage 1.20% 43.66% 4.22% 2.82% 0.05 Net_Liability -$2,928 $1,798 $43 $7 614.20 Net_Liability -$10,900 $173,830 $10,357 $3,207 23448.60
Table 2 and 3 also show descriptive statistics for variables that include WACC, ROIC, adjusted NOPAT, total invested capital, EVA, financial leverage, and net liability based on the sub-samples of bankrupt and non-bankrupt companies.
3.2 Descriptive statistics by sectors
After presenting descriptive statistics by entire, bankrupt, and non-bankrupt samples, we next present those statistics by sectors to see how the range of those statistics change by sectors. We want to know if some sectors might have better statistics than others and within a sector, if non-bankrupt companies have better statistics than non-bankrupt companies. From Table 4 to 23, we display statistics of companies by sectors based on bankrupt and non-bankrupt status.
Table 4 and Table 5 present min, max, mean, median, standard deviation for variables that include WACC, ROIC, adjusted NOPAT, total invested capital, EVA, financial leverage, and net liability for Consumer Staples companies in bankrupt and non-bankrupt status respectively.
In Consumer Staples sector, WACC is positive for both bankrupt and non-bankrupt companies. The mean of WACC is 5.61% in bankrupt companies and 6.22% in non-bankrupt companies. The cost of capital in average is almost the same no matter if companies are bankrupt or non-bankrupt in the Consumer Staples sector. The mean of financial leverage for both
bankrupt and non-bankrupt companies are also close to each other with 2.79% and 3.17% respectively. Other than two variables, there is a big difference in average value of ROIC, adjusted NOPAT, EVA, and net liability of bankrupt and non-bankrupt companies. The mean of ROIC, NOPAT, EVA, and net liability are all positive in non-bankrupt companies while the
Table 4 Table 5
Consumer Staples - Bankrupt Consumer Staples - Non-Bankrupt
Min Max Mean Median Std. Deviation Min Max Mean Median Std. Deviation WACC 2.07% 8.13% 5.61% 5.74% 0.02 WACC 4.89% 8.21% 6.22% 6.04% 0.01 ROIC -54.99% 69.46% -6.38% -10.62% 0.36 ROIC 1.92% 32.94% 12.54% 12.37% 0.08 NOPAT_adj -$634 $61 -$88 -$11 225.18 NOPAT_adj $93 $9,934 $2,194 $787 3133.14 Total_Inv_Cap -$913 $1,763 $279 $154 757.82 Total_Inv_Cap $21,110 $21,110 $21,110 $21,110 0.00 EVA -$615 $0 -$111 -$47 206.40 EVA -$848 $8,066 $1,298 $450 2507.19 Financial Leverage 2.79% 2.79% 2.79% 2.79% NA Financial Leverage 1.20% 6.27% 3.17% 2.80% 0.01 Net_Liability -$584 $1 -$132 -$23 253.38 Net_Liability -$10,900 $12,810 $4,527 $4,451 5543.58
mean of variables of bankrupt companies are negative except for financial leverage and invested capital, which is understandable because leverage and invested capital are always either equal or above zero for non-bankrupt and bankrupt companies. Thus, we tentatively think that in
Consumer Staples sector, an average bankrupt company usually has negative ROIC, NOPAT, and EVA versus a positive ROIC, NOPAT, and EVA of non-bankrupt companies.
Table 6 and Table 7 present min, max, mean, median, standard deviation for variables that include WACC, ROIC, adjusted NOPAT, total invested capital, EVA, financial leverage, and net liability for Consumer Discretionary companies in bankrupt and non-bankrupt status
respectively.
In Consumer Discretionary sector, the mean of WACC of bankrupt companies is 6.45% compared with 8.75% in non-bankrupt companies. The bankrupt companies consist of negative WACC, which the non-bankrupt companies do not have. It suggests that bankrupt companies might tend to experience loss in equity as this is what drives WACC to be negative. ROIC of bankrupt companies is -62.60% compared to 12.42% in non-bankrupt companies. This suggests than an average non-bankrupt company in the Consumer Discretionary sector generally have a positive return on invested capital while negative for bankrupt companies. Non-bankrupt companies also have a higher NOPAT ($845 vs $5), EVA (-$9 vs -$18), total invested capital ($21,110 vs $374) and more assets ($3853 vs $161) in average than bankrupt companies. Average financial leverage of bankrupt companies (6%) is about 1.5 times bigger than than of non-bankrupt companies (3.58%), meaning bankrupt companies in average tend to have higher financial leverage than non-bankrupt companies. We think that in the Consumer Discretionary
Table 6 Table 7
Consumer Discretionary - Bankrupt Consumer Discretionary - Non-Bankrupt
Min Max Mean Median Std. Deviation Min Max Mean Median Std. Deviation WACC -5.92% 22.22% 6.45% 6.56% 0.02 WACC 5.26% 12.48% 8.75% 8.96% 0.02 ROIC -1013.00% 99.77% -62.60% -2.02% 0.10 ROIC -2.89% 36.89% 12.42% 11.98% 0.10 NOPAT_adj -$218 $348 $5 $0 1281.16 NOPAT_adj -$318 $5,900 $845 $541 1281.16 Total_Inv_Cap -$37 $2,246 $374 $115 549.65 Total_Inv_Cap $21,110 $21,110 $21,110 $21,110 0.00 EVA -$219 $280 -$18 -$10 77.58 EVA -$5,116 $3,719 -$9 $60 1381.48 Financial Leverage 1.24% 60.11% 6.00% 2.60% 0.13 Financial Leverage 1.30% 11.66% 3.58% 2.73% 0.03 Net_Liability -$290 $1,780 $161 $22 393.60 Net_Liability -$5,656 $22,600 $3,853 $1,909 6120.11
sector, non-bankrupt companies in average tend to have have a lower financial leverage and higher ROIC, NOPAT, EVA, total invested capital, and more assets than that of bankrupt companies.
Table 8 and Table 9 present min, max, mean, median, standard deviation for variables that include WACC, ROIC, adjusted NOPAT, total invested capital, EVA, financial leverage, and net liability for Consumer Discretionary companies in bankrupt and non-bankrupt status
respectively.
In Energy sector, bankrupt companies on average tend to experience a negative WACC (-52.86%) and ROIC (-26.09%) as non-bankrupt companies tend to have positive WACC (8.90%) and ROIC (0.15%). Surprisingly, the mean of EVA in bankrupt companies is positive ($218) compared with -$2362 in the non-bankrupt companies. Except for this, bankrupt companies on average have a higher NOPAT, more total invested capital, and more assets. Bankrupt companies on average has 5 times more financial leverage than non-bankrupt companies. From comparing the two tables, we can tell that non-bankrupt companies in the energy sector tend to have a positive and higher NOPAT, more total invested capital, less financial leverage, more assets but maybe a lower EVA than bankrupt companies.
Table 10 and Table 11 present min, max, mean, median, standard deviation for variables that include WACC, ROIC, adjusted NOPAT, total invested capital, EVA, financial leverage, and net
Table 8 Table 9
Energy - Bankrupt Energy - Non-Bankrupt
Min Max Mean Median Std. Deviation Min Max Mean Median Std. Deviation WACC -3363.00% 26.14% -52.86% 6.21% 4.46 WACC 5.53% 13.69% 8.90% 8.89% 0.02 ROIC -797.00% 710.20% -26.09% -9.20% 1.71 ROIC -10.97% 9.29% 0.15% 1.51% 0.06 NOPAT_adj -$4,407 $705 -$257 -$44 713.93 NOPAT_adj -$2,077 $3,848 $272 $135 1384.39 Total_Inv_Cap -$2,685 $16,240 $952 $403 2519.03 Total_Inv_Cap $21,110 $21,110 $21,110 $21,110 0.00 EVA -$4,598 $29,870 $218 -$40 4062.81 EVA -$15,470 -$107 -$2,362 -$1,263 3823.04 Financial Leverage 1.08% 209.80% 15.32% 5.40% 0.37 Financial Leverage 1.32% 14.36% 2.76% 1.97% 0.03 Net_Liability -$2,928 $1,798 -$17 $19 943.22 Net_Liability $2,249 $173,800 $22,780 $9,448 43997.48
Table 10 Table 11
Health Care - Bankrupt Health Care- Non-Bankrupt
Min Max Mean Median Std. Deviation Min Max Mean Median Std. Deviation WACC -169.20% 12.92% -10.95% 4.34% 0.47 WACC 6.67% 18.36% 9.66% 8.55% 0.03 ROIC -1113.00% 461.50% -102.40% -15.67% 4.11 ROIC -25.50% 48.38% 8.74% 10.13% 0.16 NOPAT_adj -$89 $15 -$17 -$10 24.97 NOPAT_adj -$291 $14,620 $2,174 $348 3914.11 Total_Inv_Cap -$5 $532 $64 $9 141.47 Total_Inv_Cap $336 $144,400 $19,880 $2,214 34242.19 EVA -$89 $1 -$23 -$12 25.31 EVA -$5,578 $4,347 $316 $52 2098.28 Financial Leverage 1.72% 11.73% 5.50% 4.45% 0.04 Financial Leverage 1.23% 11.29% 3.22% 2.25% 0.02 Net_Liability -$87 $150 $10 $0 50.27 Net_Liability $88 $76,200 $11,860 $1,118 21044.80
liability for Health Care companies in bankrupt and non-bankrupt status respectively.
In Health Care sector, the average of mean of bankrupt companies is -10.95% compared to 9.66% of non-bankrupt companies. Similar to Consumer Discretionary sector, the average of ROIC (8.74%) of non-bankrupt companies is higher than that of bankrupt companies (-102.40%). Non-bankrupt companies also have a positive and higher NOPAT ($2,174), total invested capital ($19,880), EVA ($316), and more assets ($11,860) than that of bankrupt
companies which on average have a negative ROIC, NOPAT, and EVA. Bankrupt companies on average has about 1.5 times financial leverage than that of bankrupt companies. Thus, on average non-bankrupt companies tend to have a positive and higher ROIC, NOPAT, EVA, and more assets than that of bankrupt companies in the Health Care sector.
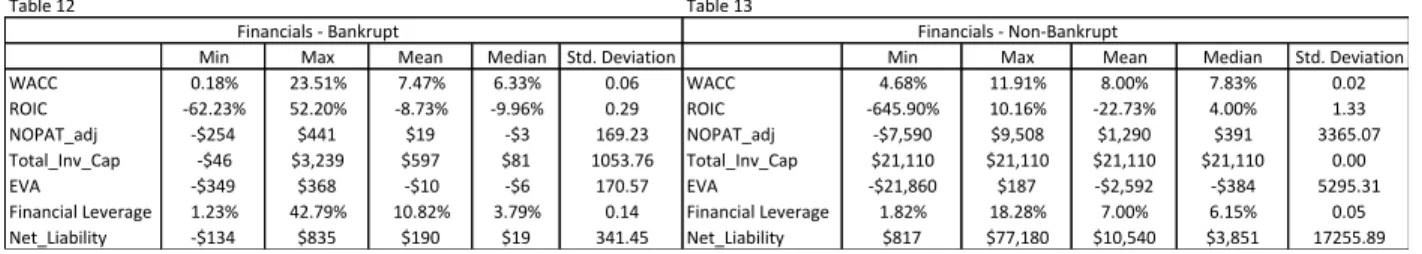
Table 12 and Table 13 present min, max, mean, median, standard deviation for variables that include WACC, ROIC, adjusted NOPAT, total invested capital, EVA, financial leverage, and net liability for Financials companies in bankrupt and non-bankrupt status respectively.
In Financials sector, the mean of WACC is very similar between bankrupt and non-bankrupt companies at about 8%. It seems like both bankrupt and non-bankrupt companies on average have a negative ROIC, however, bankrupt companies this time has a higher ROIC (-8.73%) than that of non-bankrupt companies (-22.73%). Bankrupt companies in the Financials sector also have a higher EVA (-$10) on average than that of non-bankrupt companies (-$2,592). Non-bankrupt companies on average have a higher NOPAT, more invested capital and assets than bankrupt companies. Bankrupt companies has also about 1.5 times financial leverage than that of
Table 12 Table 13
Financials - Bankrupt Financials - Non-Bankrupt
Min Max Mean Median Std. Deviation Min Max Mean Median Std. Deviation WACC 0.18% 23.51% 7.47% 6.33% 0.06 WACC 4.68% 11.91% 8.00% 7.83% 0.02 ROIC -62.23% 52.20% -8.73% -9.96% 0.29 ROIC -645.90% 10.16% -22.73% 4.00% 1.33 NOPAT_adj -$254 $441 $19 -$3 169.23 NOPAT_adj -$7,590 $9,508 $1,290 $391 3365.07 Total_Inv_Cap -$46 $3,239 $597 $81 1053.76 Total_Inv_Cap $21,110 $21,110 $21,110 $21,110 0.00 EVA -$349 $368 -$10 -$6 170.57 EVA -$21,860 $187 -$2,592 -$384 5295.31 Financial Leverage 1.23% 42.79% 10.82% 3.79% 0.14 Financial Leverage 1.82% 18.28% 7.00% 6.15% 0.05 Net_Liability -$134 $835 $190 $19 341.45 Net_Liability $817 $77,180 $10,540 $3,851 17255.89
non-bankrupt companies on average. Thus, it appears that in Financials sector, bankrupt companies on average have a higher EVA and ROIC than non-bankrupt companies but have lower NOPAT, invested capital and less assets.
Table 14 and Table 15 present min, max, mean, median, standard deviation for variables that include WACC, ROIC, adjusted NOPAT, total invested capital, EVA, financial leverage, and net liability for Industrials companies in bankrupt and non-bankrupt status respectively.
In Industrials sector, the mean of WACC for non-bankrupt companies (9.51%) is higher than that of bankrupt companies (5.34%) but non-bankrupt companies have a much higher and positive ROIC (9.85%) than bankrupt companies (-58.01%). Bankrupt companies has slightly higher financial leverage ratio than non-bankrupt companies at 3.25% and 2.83% respectively. On average, non-bankrupt companies have higher and positive NOPAT, total invested capital, EVA, and more assets.
Table 16 and Table 17 present min, max, mean, median, standard deviation for variables that include WACC, ROIC, adjusted NOPAT, total invested capital, EVA, financial leverage, and net liability for Materials companies in bankrupt and non-bankrupt status respectively.
In Materials sector, non-bankrupt companies have slightly higher WACC at 8.14% compared to 6.82% of bankrupt companies. In this sector, both bankrupt companies on average has much
Table 14 Table 15
Industrials - Bankrupt Industrials - Non-Bankrupt
Min Max Mean Median Std. Deviation Min Max Mean Median Std. Deviation WACC -2.95% 9.32% 5.34% 5.61% 0.03 WACC 6.78% 12.64% 9.51% 9.37% 0.02 ROIC -935.20% 180.70% -58.01% -1.41% 2.73 ROIC -5.31% 25.74% 9.85% 9.23% 0.07 NOPAT_adj -$170 $103 -$7 -$3 58.27 NOPAT_adj -$650 $4,526 $1,145 $344 1430.90 Total_Inv_Cap -$11 $1,369 $231 $13 415.77 Total_Inv_Cap $1,050 $38,840 $11,660 $5,277 11778.75 EVA -$180 $101 -$19 -$4 62.47 EVA -$1,728 $1,690 $131 $5 729.87 Financial Leverage 1.91% 4.82% 3.23% 3.25% 0.01 Financial Leverage 1.34% 7.71% 2.83% 2.75% 0.01 Net_Liability -$86 $839 $94 $5 243.14 Net_Liability $550 $19,550 $5,602 $1,851 5710.36
Table 16 Table 17
Materials - Bankrupt Materials - Non-Bankrupt
Min Max Mean Median Std. Deviation Min Max Mean Median Std. Deviation WACC 2.45% 17.52% 6.82% 5.85% 0.04 WACC 6.18% 11.09% 8.14% 8.24% 0.01 ROIC -300.00% 1180.00% 48.39% -30.07% 3.70 ROIC 2.64% 24.60% 11.44% 10.61% 0.06 NOPAT_adj -$3,097 -$1 -$344 -$9 890.38 NOPAT_adj $157 $4,000 $1,128 $731 1015.96 Total_Inv_Cap -$2,400 $1,458 $131 $20 969.74 Total_Inv_Cap $2,869 $20,810 $9,314 $7,003 5302.60 EVA -$2,677 -$4 -$326 -$26 767.49 EVA -$934 $2,536 $362 $162 801.37 Financial Leverage 2.27% 69.37% 25.50% 10.61% 0.29 Financial Leverage 1.99% 43.66% 8.11% 3.67% 0.13 Net_Liability -$172 $1,035 $156 -$1 390.95 Net_Liability $363 $10,390 $3,332 $2,889 2678.68
higher financial leverage at 25.50% than non-bankrupt companies at 8.11%, although they are all higher than other sectors at around 3%-7%. Bankrupt companies on average have a higher ROIC at 48.39% compared to 11.44% of non-bankrupt companies. Other than this, non-bankrupt companies on average have a much higher and positive NOPAT, invested capital, EVA, and more assets than bankrupt companies.
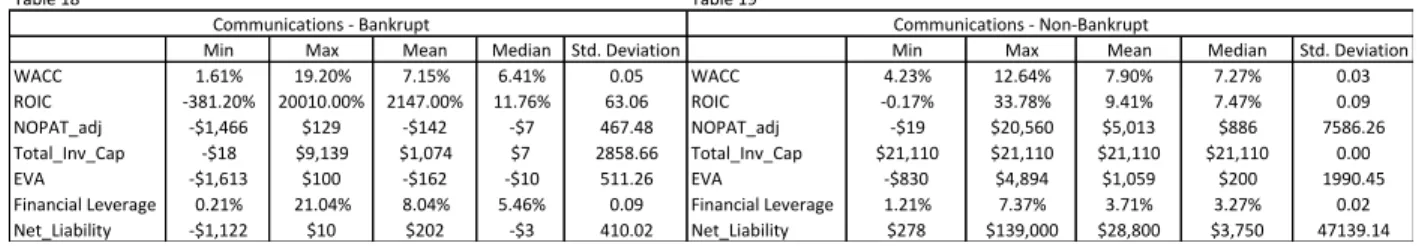
Table 18 and Table 19 present min, max, mean, median, standard deviation for variables that include WACC, ROIC, adjusted NOPAT, total invested capital, EVA, financial leverage, and net liability for Communications companies in bankrupt and non-bankrupt status respectively.
In Communications sector, the average value of WACC are similar to both bankrupt (7.15%) and non-bankrupt companies. (7.90%). Similar to Materials sector, bankrupt companies on average have a higher ROIC at 2147% than 9.41%. In addition, bankrupt companies (8.04%) on average has almost 3 times more financial leverage of non-bankrupt companies (3.71%). In other areas, non-bankrupt companies generally on average have higher and positive NOPAT, invested capital, EVA, and more assets than bankrupt companies in Communications sector.
Table 20 and Table 21 present min, max, mean, median, standard deviation for variables that include WACC, ROIC, adjusted NOPAT, total invested capital, EVA, financial leverage, and net liability for Technology companies in bankrupt and non-bankrupt status respectively.
Table 18 Table 19
Communications - Bankrupt Communications - Non-Bankrupt
Min Max Mean Median Std. Deviation Min Max Mean Median Std. Deviation WACC 1.61% 19.20% 7.15% 6.41% 0.05 WACC 4.23% 12.64% 7.90% 7.27% 0.03 ROIC -381.20% 20010.00% 2147.00% 11.76% 63.06 ROIC -0.17% 33.78% 9.41% 7.47% 0.09 NOPAT_adj -$1,466 $129 -$142 -$7 467.48 NOPAT_adj -$19 $20,560 $5,013 $886 7586.26 Total_Inv_Cap -$18 $9,139 $1,074 $7 2858.66 Total_Inv_Cap $21,110 $21,110 $21,110 $21,110 0.00 EVA -$1,613 $100 -$162 -$10 511.26 EVA -$830 $4,894 $1,059 $200 1990.45 Financial Leverage 0.21% 21.04% 8.04% 5.46% 0.09 Financial Leverage 1.21% 7.37% 3.71% 3.27% 0.02 Net_Liability -$1,122 $10 $202 -$3 410.02 Net_Liability $278 $139,000 $28,800 $3,750 47139.14
Table 20 Table 21
Technology - Bankrupt Technology - Non-Bankrupt
Min Max Mean Median Std. Deviation Min Max Mean Median Std. Deviation WACC 0.47% 19.12% 10.18% 8.49% 0.07 WACC 6.73% 14.78% 10.14% 10.00% 0.02 ROIC -1242.00% 541.20% -243.70% -184.50% 5.06 ROIC -893.00% 21.79% -44.84% 6.90% 2.19 NOPAT_adj -$2,559 -$1 -$282 -$25 800.50 NOPAT_adj -$432 $9,384 $896 $294 293.80 Total_Inv_Cap -$13 $206 $31 $5 64.36 Total_Inv_Cap $48 $143,000 $12,080 $2,870 33937.44 EVA -$2,570 -$1 -$284 -$28 803.50 EVA -$3,740 $1,050 -$215 -$58 989.81 Financial Leverage 1.09% 8.78% 2.86% 1.42% 0.03 Financial Leverage 1.33% 24.71% 3.44% 1.90% 0.06 Net_Liability -$55 $320 $36 $4 103.55 Net_Liability $48 $66,140 $5,837 $1,678 15641.73
In Technology sector, the mean of WACC for bankrupt and non-bankrupt companies are also similar at 10.18% and 10.14% respectively. Bankrupt and non-bankrupt companies also have similar financial leverage at 2.86% and 3.44% respectively. Non-bankrupt companies on average have a higher although negative ROIC than bankrupt companies. In this sector, both
bankrupt and bankrupt companies experience negative EVA on average. In generally, a non-bankrupt company on average have a higher and positive NOPAT, invested capital, and more assets than bankrupt company in the Communications sector.
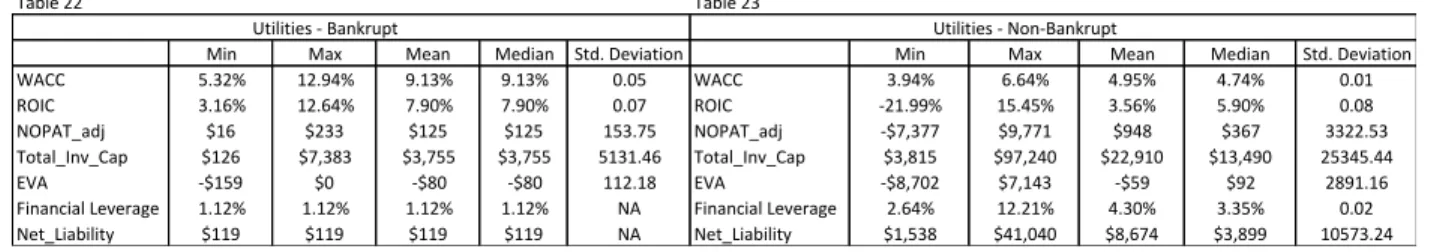
Table 22 and Table 23 present min, max, mean, median, standard deviation for variables that include WACC, ROIC, adjusted NOPAT, total invested capital, EVA, financial leverage, and net liability for Utilities companies in bankrupt and non-bankrupt status respectively.
In the Utilities sector, the WACC of bankrupt companies (9.13%) on average is almost twice bigger than that of non-bankrupt companies (4.95%). Bankrupt companies (1.12%) has less financial leverage than that of non-bankrupt companies (3.35%) on average but a higher ROIC at 7.90% compared to 3.56% of non-bankrupt companies. Both bankrupt and non-bankrupt
companies experience negative EVA on average with non-bankrupt companies on average have a higher EVA. Generally speaking, on average non-bankrupt companies have a higher and positive NOPAT, invested capital, and more assets than bankrupt companies in the Utilities sector.
4.
Univariate grouping test
4.1 Grouping test by entire sample
Table 22 Table 23
Utilities - Bankrupt Utilities - Non-Bankrupt
Min Max Mean Median Std. Deviation Min Max Mean Median Std. Deviation WACC 5.32% 12.94% 9.13% 9.13% 0.05 WACC 3.94% 6.64% 4.95% 4.74% 0.01 ROIC 3.16% 12.64% 7.90% 7.90% 0.07 ROIC -21.99% 15.45% 3.56% 5.90% 0.08 NOPAT_adj $16 $233 $125 $125 153.75 NOPAT_adj -$7,377 $9,771 $948 $367 3322.53 Total_Inv_Cap $126 $7,383 $3,755 $3,755 5131.46 Total_Inv_Cap $3,815 $97,240 $22,910 $13,490 25345.44 EVA -$159 $0 -$80 -$80 112.18 EVA -$8,702 $7,143 -$59 $92 2891.16 Financial Leverage 1.12% 1.12% 1.12% 1.12% NA Financial Leverage 2.64% 12.21% 4.30% 3.35% 0.02 Net_Liability $119 $119 $119 $119 NA Net_Liability $1,538 $41,040 $8,674 $3,899 10573.24
The descriptive statistics in each sector generally give a sense of the trend of financial performance of bankrupt and non-bankrupt companies. We identify 4 variables that we believe are driving bankruptcy and will explore these four variables further in regression analysis in the next section. The 4 variables are WACC, ROIC, EVA, and NOPAT. In the entire sample, from Table 24, we can see that in the first five group, companies that have a higher WACC are usually non-bankrupt while as WACC can lower and even to negative, there are more bankrupt
companies. In Table 25, ROIC also follows a similar patter. There are more non-bankrupt companies in first five groups and in the last five groups in which ROIC is at the lower bound, there are more bankrupt companies. In Table 26, the first three groups and last three groups consist of more bankrupt companies. There are more bankrupt companies and less non-bankrupt companies found in group 4-7. The pattern of EVA suggests that non-bankrupt companies occur when their EVA are around the middle portion of the sample. In table 27, the trend is more obvious as there are more non-bankrupt companies in the first five groups in which NOPAT is at the upper bound and in the last five groups in which is at lower bound, the occurrence of
bankrupt companies is more frequent.
Table 24 Table 25
WACC ranked from highest to lowest ROIC ranked from highest to lowest
Bankrputcy Non-Bankruptcy Bankrputcy% Non-Bankruptcy% Bankrputcy Non-Bankruptcy Bankrputcy% Non-Bankruptcy% Group 1 14 23 3.75% 6.17% Group 1 24 13 6.43% 3.49% Group 2 1 37 0.27% 9.92% Group 2 6 32 1.61% 8.58% Group 3 23 15 6.17% 4.02% Group 3 6 32 1.61% 8.58% Group 4 10 28 2.68% 7.51% Group 4 8 30 2.14% 8.04% Group 5 18 20 4.83% 5.36% Group 5 8 30 2.14% 8.04% Group 6 13 25 3.49% 6.70% Group 6 11 27 2.95% 7.24% Group 7 17 21 4.56% 5.63% Group 7 20 18 5.36% 4.83% Group 8 21 17 5.63% 4.56% Group 8 28 10 7.51% 2.68% Group 9 29 9 7.77% 2.41% Group 9 37 1 9.92% 0.27% Group 10 32 0 8.58% 0.00% Group 10 30 2 8.04% 0.54%
Table 24, 25, 26, and 27 display proportion of bankruptcy in the entire sample divided into 10 groups by WACC, ROIC, EVA and NOPAT ranked from highest to lowest.
4.2 Grouping test by sectors
The results of grouping test by entire sample suggests that majority of bankrupt companies generally have a lower WACC, lower ROIC, and lower NOPAT than non-bankrupt companies with EVA falling neither higher or lower than that of non-bankrupt companies. Next, we perform the same tests by each sector and divide sector specific companies into 5 groups that rank
WACC, ROIC, EVA, and NOPAT from highest to lowest.
Table 28, 29, 30, and 31 display proportion of bankruptcy in the Consumer Staples sector divided into 5 groups by WACC, ROIC, EVA and NOPAT ranked from highest to lowest.
In Table 28, there are more bankrupt companies at the upper and lower bound of WACC as shown in group 1-2 and group 4-5. Generally speaking, more non-bankrupt companies occur at the upper bound of WACC, meaning higher WACC ratio. In Table 29, ROIC also follows
Table 26 Table 27
EVA ranked from highest to lowest NOPAT ranked from highest to lowest
Bankrputcy Non-Bankruptcy Bankrputcy% Non-Bankruptcy% Bankrputcy Non-Bankruptcy Bankrputcy% Non-Bankruptcy%
Group 1 1 36 0.27% 9.65% Group 1 0 37 0.00% 9.92% Group 2 8 30 2.14% 8.04% Group 2 0 38 0.00% 10.19% Group 3 11 27 2.95% 7.24% Group 3 3 35 0.80% 9.38% Group 4 36 2 9.65% 0.54% Group 4 4 34 1.07% 9.12% Group 5 37 1 9.92% 0.27% Group 5 18 20 4.83% 5.36% Group 6 31 7 8.31% 1.88% Group 6 36 2 9.65% 0.54% Group 7 22 16 5.90% 4.29% Group 7 37 1 9.92% 0.27% Group 8 15 23 4.02% 6.17% Group 8 33 5 8.85% 1.34% Group 9 9 29 2.41% 7.77% Group 9 29 9 7.77% 2.41% Group 10 8 24 2.14% 6.43% Group 10 18 14 4.83% 3.75%
Table 28 Consumer Staples Table 29 Consumer Staples
WACC ranked from highest to lowest ROIC ranked from highest to lowest
Bankrputcy Non-Bankruptcy Bankrputcy% Non-Bankruptcy% Bankrputcy Non-Bankruptcy Bankrputcy% Non-Bankruptcy%
Group 1 2 3 8.00% 12.00% Group 1 1 4 4.00% 16.00%
Group 2 2 3 8.00% 12.00% Group 2 0 5 0.00% 20.00%
Group 3 0 5 0.00% 20.00% Group 3 0 5 0.00% 20.00%
Group 4 1 4 4.00% 16.00% Group 4 2 3 8.00% 12.00%
Group 5 3 2 12.00% 8.00% Group 5 5 0 20.00% 0.00%
Table 30 Consumer Staples Table 31 Consumer Staples
EVA ranked from highest to lowest NOPAT ranked from highest to lowest
Bankrputcy Non-Bankruptcy Bankrputcy% Non-Bankruptcy% Bankrputcy Non-Bankruptcy Bankrputcy% Non-Bankruptcy%
Group 1 0 5 0.00% 20.00% Group 1 0 5 0.00% 20.00%
Group 2 0 5 0.00% 20.00% Group 2 0 5 0.00% 20.00%
Group 3 3 2 12.00% 8.00% Group 3 0 5 0.00% 20.00%
Group 4 3 2 12.00% 8.00% Group 4 3 2 12.00% 8.00%
similar pattern in which there are more bankrupt companies that have either very high or low ROIC. In Table 30, non-bankrupt companies occur at the upper bound of EVA suggesting companies that have higher EVA tend to be non-bankrupt. In the last three groups where EVA are lowers, more bankrupt companies occur. In Table 31, distribution of bankruptcy by NOPAT is consistent with that of EVA. In the first three groups where NOPAT are higher that the last two groups, all belong to non-bankrupt companies. From these 4 tables, we can generally find out in the Consumer Staples sector, non-bankrupt companies tend to have higher EVA, ROIC, and NOPAT than bankrupt companies.
Table 32, 33, 34, and 35 display proportion of bankruptcy in the Consumer Discretionary sector divided into 5 groups by WACC, ROIC, EVA and NOPAT ranked from highest to lowest.
In the Consumer Discretionary sector, looking at Table 32, in the last three groups in which WACC is at the lowest bound range, there are more bankrupt companies especially in the last group, all 13 companies are bankrupt companies. In Table 33, there are non-bankrupt companies in the first two groups. In group 5 where ROIC is also at the lowest bound range, all 13
companies are bankrupt. In Table 34, we can find that there are less bankrupt companies in first two groups in which EVA is at the upper bound range. When EVA decreases, we find more bankrupt companies in group 3-5. In Table 35, more non-bankrupt companies in first two groups but more bankrupt companies occur in last three groups in which NOPAT are smaller. From
Table 32 Consumer Discretionary Table 33 Consumer Discretionary
WACC ranked from highest to lowest ROIC ranked from highest to lowest
Bankrputcy Non-Bankruptcy Bankrputcy% Non-Bankruptcy% Bankrputcy Non-Bankruptcy Bankrputcy% Non-Bankruptcy%
Group 1 5 8 7.69% 12.31% Group 1 4 9 6.15% 13.85%
Group 2 6 7 9.23% 10.77% Group 2 6 7 9.23% 10.77%
Group 3 7 6 10.77% 9.23% Group 3 8 5 12.31% 7.69%
Group 4 10 3 15.38% 4.62% Group 4 10 3 15.38% 4.62% Group 5 13 0 20.00% 0.00% Group 5 13 0 20.00% 0.00%
Table 34 Consumer Discretionary Table 35 Consumer Discretionary
EVA ranked from highest to lowest NOPAT ranked from highest to lowest
Bankrputcy Non-Bankruptcy Bankrputcy% Non-Bankruptcy% Bankrputcy Non-Bankruptcy Bankrputcy% Non-Bankruptcy% Group 1 2 11 3.08% 16.92% Group 1 0 13 0.00% 20.00%
Group 2 9 4 13.85% 6.15% Group 2 5 8 7.69% 12.31%
Group 3 12 1 18.46% 1.54% Group 3 13 0 20.00% 0.00% Group 4 12 1 18.46% 1.54% Group 4 12 1 18.46% 1.54%
these 4 tables, we can see that non-bankrupt companies generally have a higher WACC, ROIC, EVA and NOPAT than that of bankrupt companies in the Consumer Discretionary sector.
Table 36, 37, 38, and 39 display proportion of bankruptcy in the Energy sector divided into 5 groups by WACC, ROIC, EVA and NOPAT ranked from highest to lowest.
In the Energy sector, when WACC decreases, the number of non-bankrupt companies generally decreases and that of bankrupt companies increases as seen from Table 36. In Table 37, There are more bankrupt companies occur in Group 1 and Group 4-5. In group 5 in which ROIC are at its lowest bound range, all 16 companies are bankrupt, which is the same as that in Table 36. In Table 38, there are more bankrupt companies in first 4 groups. When EVA
decreases, the number of non-bankrupt companies increases, which is quite different that the traditional pattern where non-bankrupt companies generally take place at the upper bound of EVA instead of lower bound. In Table 39, there are more non-bankrupt companies in Group 1 but as NOPAT becomes smaller, there are more bankrupt companies and less non-bankrupt companies. These four tables together suggest that non-bankrupt companies generally have a higher WACC, lower EVA, and higher NOPAT than bankrupt companies in the Energy sector.
Table 36 Energy Table 37 Energy
WACC ranked from highest to lowest ROIC ranked from highest to lowest
Bankrputcy Non-Bankruptcy Bankrputcy% Non-Bankruptcy% Bankrputcy Non-Bankruptcy Bankrputcy% Non-Bankruptcy% Group 1 5 11 6.25% 13.75% Group 1 13 3 16.25% 3.75%
Group 2 12 4 15.00% 5.00% Group 2 7 9 8.75% 11.25%
Group 3 10 6 12.50% 7.50% Group 3 7 9 8.75% 11.25%
Group 4 14 2 17.50% 2.50% Group 4 14 2 17.50% 2.50% Group 5 16 0 20.00% 0.00% Group 5 16 0 20.00% 0.00%
Table 38 Energy Table 39 Energy
EVA ranked from highest to lowest NOPAT ranked from highest to lowest
Bankrputcy Non-Bankruptcy Bankrputcy% Non-Bankruptcy% Bankrputcy Non-Bankruptcy Bankrputcy% Non-Bankruptcy% Group 1 16 0 20.00% 0.00% Group 1 4 12 5.00% 15.00% Group 2 16 0 20.00% 0.00% Group 2 16 0 20.00% 0.00% Group 3 11 5 13.75% 6.25% Group 3 15 1 18.75% 1.25% Group 4 10 6 12.50% 7.50% Group 4 13 3 16.25% 3.75%
Table 40, 41, 42, and 43 display proportion of bankruptcy in the Communications sector divided into 5 groups by WACC, ROIC, EVA and NOPAT ranked from highest to lowest.
In the Communications sector, there are more non-bankrupt companies at the upper bound of WACC as seen in Group1-4 in Table 40. In Table 41, there are more bankrupt companies occur at the lower and upper bound of ROIC with more non-bankrupt companies occur group 2-4, suggesting in this sector, companies that have average ROIC are usually non-bankrupt
companies. In Table 42, majority of non-bankrupt companies occur in Group 1-2 with a few that are in Group 4-5. In Group 1, there is no bankrupt companies as they mostly occur at the lower bound of EVA. In Table 43, we can see that there are no bankrupt companies in Group 1-2 but occur in Group 3-5. Non-bankrupt companies occur in the first 3 groups in which NOPAT are at the upper bound. From these 4 tables, we can find that non-bankrupt companies generally have a higher WACC, NOPAT. Bankrupt companies generally have a lower EVA but higher ROIC in the Communications sector.
Table 40 Communications Table 41 Communications
WACC ranked from highest to lowest ROIC ranked from highest to lowest
Bankrputcy Non-Bankruptcy Bankrputcy% Non-Bankruptcy% Bankrputcy Non-Bankruptcy Bankrputcy% Non-Bankruptcy%
Group 1 2 3 8.33% 12.50% Group 1 4 1 16.67% 4.17%
Group 2 2 3 8.33% 12.50% Group 2 1 4 4.17% 16.67%
Group 3 1 4 4.17% 16.67% Group 3 1 4 4.17% 16.67%
Group 4 2 3 8.33% 12.50% Group 4 0 5 0.00% 20.83%
Group 5 3 1 12.50% 4.17% Group 5 4 0 16.67% 0.00%
Table 42 Communications Table 43 Communications
EVA ranked from highest to lowest NOPAT ranked from highest to lowest
Bankrputcy Non-Bankruptcy Bankrputcy% Non-Bankruptcy% Bankrputcy Non-Bankruptcy Bankrputcy% Non-Bankruptcy%
Group 1 0 5 0.00% 20.83% Group 1 0 5 0.00% 20.83%
Group 2 1 4 4.17% 16.67% Group 2 0 5 0.00% 20.83%
Group 3 5 0 20.83% 0.00% Group 3 2 3 8.33% 12.50%
Group 4 3 2 12.50% 8.33% Group 4 5 0 20.83% 0.00%
Group 5 1 3 4.17% 12.50% Group 5 3 1 12.50% 4.17%
Table 44 Financials Table 45 Financials
WACC ranked from highest to lowest ROIC ranked from highest to lowest
Bankrputcy Non-Bankruptcy Bankrputcy% Non-Bankruptcy% Bankrputcy Non-Bankruptcy Bankrputcy% Non-Bankruptcy%
Group 1 1 6 2.94% 17.65% Group 1 1 6 2.94% 17.65%
Group 2 3 4 8.82% 11.76% Group 2 1 6 2.94% 17.65%
Group 3 0 7 0.00% 20.59% Group 3 0 7 0.00% 20.59%
Group 4 2 5 5.88% 14.71% Group 4 3 4 8.82% 11.76%
Table 44, 45, 46, and 47 display proportion of bankruptcy in the Financials sector divided into 5 groups by WACC, ROIC, EVA and NOPAT ranked from highest to lowest.
In the Financials sector, majority of bankrupt companies occur at the upper bound of WACC distribution as seen in Group 1-3 in Table 44. In Table 45, in Group 1-3, majority are non-bankrupt companies and in Group 4-5 in which ROIC is at the lower bound, there are more bankrupt companies. In Table 46, bankrupt companies generally occur at the upper bound of EVA distribution with more non-bankrupt companies occur the lower bound. In Table 47, the pattern is at the opposite of EVA. There are more non-bankrupt companies in Group 1-3 while in the last two groups in which NOPAT are at the lower bound, more bankrupt companies occur. From these 4 tables, we find out non-bankrupt companies tend to have higher WACC, higher ROIC, lower EVA, and higher NOPAT.
Table 48, 49, 50, and 51 display proportion of bankruptcy in the Health Care sector divided into 5 groups by WACC, ROIC, EVA and NOPAT ranked from highest to lowest.
In Health Care sector, non-bankrupt companies occur frequently at the upper bound of
Table 46 Financials Table 47 Financials
EVA ranked from highest to lowest NOPAT ranked from highest to lowest
Bankrputcy Non-Bankruptcy Bankrputcy% Non-Bankruptcy% Bankrputcy Non-Bankruptcy Bankrputcy% Non-Bankruptcy%
Group 1 5 2 14.71% 5.88% Group 1 0 7 0.00% 20.59%
Group 2 4 3 11.76% 8.82% Group 2 1 6 2.94% 17.65%
Group 3 1 6 2.94% 17.65% Group 3 0 7 0.00% 20.59%
Group 4 0 7 0.00% 20.59% Group 4 5 2 14.71% 5.88%
Group 5 0 6 0.00% 17.65% Group 5 4 2 11.76% 5.88%
Table 48 Health Care Table 49 Health Care
WACC ranked from highest to lowest ROIC ranked from highest to lowest
Bankrputcy Non-Bankruptcy Bankrputcy% Non-Bankruptcy% Bankrputcy Non-Bankruptcy Bankrputcy% Non-Bankruptcy%
Group 1 1 6 2.86% 17.14% Group 1 3 4 8.57% 11.43%
Group 2 2 5 5.71% 14.29% Group 2 0 7 0.00% 20.00%
Group 3 1 6 2.86% 17.14% Group 3 1 6 2.86% 17.14%
Group 4 3 4 8.57% 11.43% Group 4 5 2 14.29% 5.71%
Group 5 7 0 20.00% 0.00% Group 5 5 2 14.29% 5.71%
Table 50 Health Care Table 51 Health Care
EVA ranked from highest to lowest NOPAT ranked from highest to lowest
Bankrputcy Non-Bankruptcy Bankrputcy% Non-Bankruptcy% Bankrputcy Non-Bankruptcy Bankrputcy% Non-Bankruptcy%
Group 1 0 7 0.00% 20.00% Group 1 0 7 0.00% 20.00%
Group 2 1 6 2.86% 17.14% Group 2 0 7 0.00% 20.00%
Group 3 7 0 20.00% 0.00% Group 3 4 3 11.43% 8.57%
Group 4 6 1 17.14% 2.86% Group 4 7 0 20.00% 0.00%
WACC as seen in Group 1-4 in Table 48. In Group 5 in which EVA is at the lowest bound, all 7 companies are bankrupt. In Table 49, there are more non-bankrupt companies occur in Group 1-3 in which ROIC are at the upper bound compared to more bankrupt companies in Group 4-5 in which ROIC are at the lower bound. In Table 50, the distribution of EVA follows similar pattern as seen Communications sector in which non-bankrupt companies occur in the upper and lower bound of EVA while more bankrupt companies at the middle. In Group 1 and Group 5, there are no bankrupt companies but all are non-bankrupt companies. In Group 2-4, there are more
bankrupt companies. In Table 51, all companies are non-bankrupt in Group 1-2 and more bankrupt companies in Group 3-5 in which NOPAT are at the lower bound. From these 4 tables, we generally find that non-bankrupt companies have higher WACC, higher ROIC, and either higher or lower than average EVA, and higher NOPAT.
Table 52, 53, 54, and 55 display proportion of bankruptcy in the Industrials sector divided into 5 groups by WACC, ROIC, EVA and NOPAT ranked from highest to lowest.
In Industrials sector, non-bankrupt companies occur at the upper bound of WACC again in Group 1-3 as seen in Table 52. More bankrupt companies occur at the lower bound of WACC as seen in Group 4-5. In Table 53, majority of companies in the upper bound of ROIC are non-bankrupt as seen in Group 1-3. In the lower bound specifically in Group 5, all 6 companies are
Table 52 Industrials Table 53 Industrials
WACC ranked from highest to lowest ROIC ranked from highest to lowest
Bankrputcy Non-Bankruptcy Bankrputcy% Non-Bankruptcy% Bankrputcy Non-Bankruptcy Bankrputcy% Non-Bankruptcy%
Group 1 0 7 0.00% 20.59% Group 1 3 4 8.82% 11.76%
Group 2 2 5 5.88% 14.71% Group 2 1 6 2.94% 17.65%
Group 3 1 6 2.94% 17.65% Group 3 0 7 0.00% 20.59%
Group 4 4 3 11.76% 8.82% Group 4 3 4 8.82% 11.76%
Group 5 6 0 17.65% 0.00% Group 5 6 0 17.65% 0.00%
Table 54 Industrials Table 55 Industrials
EVA ranked from highest to lowest NOPAT ranked from highest to lowest
Bankrputcy Non-Bankruptcy Bankrputcy% Non-Bankruptcy% Bankrputcy Non-Bankruptcy Bankrputcy% Non-Bankruptcy%
Group 1 0 7 0.00% 20.59% Group 1 0 7 0.00% 20.59%
Group 2 3 4 8.82% 11.76% Group 2 0 7 0.00% 20.59%
Group 3 6 1 17.65% 2.94% Group 3 2 5 5.88% 14.71%
Group 4 3 4 8.82% 11.76% Group 4 7 0 20.59% 0.00%
bankrupt. In Table 54, the distribution pattern follows that of Health Care sector in which more non-bankrupt companies occur at the upper and lower bound of EVA distribution with majority of bankrupt companies occurring in the middle. In Table 55, there are more non-bankrupt companies occur at the upper bound of NOPAT distribution in Group 1-3 with no bankrupt companies appearing in first two groups. As NOPAT decreases, we see more bankrupt
companies occurring at Group 4-5. From these 4 tables, we find that non-bankrupt companies tend to have a higher WACC, higher ROIC, either higher or lower EVA than average, and higher NOPAT in the Industrials sector.
Table 56, 57, 58, and 59 display proportion of bankruptcy in the Materials sector divided into 5 groups by WACC, ROIC, EVA and NOPAT ranked from highest to lowest.
In the Materials sector, there are more non-bankrupt companies occur at the upper bound of WACC as seen in Group 1-4 in Table 56. In Group 5, all 5 companies are bankrupt companies. In Table 57, majority of companies are non-bankrupt companies in Group 1-3 with no bankrupt companies in Group 2-3, meaning no bankrupt companies have relatively higher ROIC in these groups. In Group 5 in which ROIC are at the lowest bound, all 5 companies are bankrupt as well. In Table 58, there are more non-bankrupt companies occurring at upper and lower bound of EVA distribution as seen in Group 1-2 and Group 4-5. More bankrupt companies accumulate in the middle of the distribution. In Table 59, specifically in Group 1-3, there is only 1 bankrupt
Table 56 Materials Table 57 Materials
WACC ranked from highest to lowest ROIC ranked from highest to lowest
Bankrputcy Non-Bankruptcy Bankrputcy% Non-Bankruptcy% Bankrputcy Non-Bankruptcy Bankrputcy% Non-Bankruptcy%
Group 1 2 4 6.90% 13.79% Group 1 2 4 6.90% 13.79%
Group 2 3 3 10.34% 10.34% Group 2 0 6 0.00% 20.69%
Group 3 0 6 0.00% 20.69% Group 3 0 6 0.00% 20.69%
Group 4 2 4 6.90% 13.79% Group 4 5 1 17.24% 3.45%
Group 5 5 0 17.24% 0.00% Group 5 5 0 17.24% 0.00%
Table 58 Materials Table 59 Materials
EVA ranked from highest to lowest NOPAT ranked from highest to lowest
Bankrputcy Non-Bankruptcy Bankrputcy% Non-Bankruptcy% Bankrputcy Non-Bankruptcy Bankrputcy% Non-Bankruptcy%
Group 1 0 6 0.00% 20.69% Group 1 0 6 0.00% 20.69%
Group 2 0 6 0.00% 20.69% Group 2 0 6 0.00% 20.69%
Group 3 5 1 17.24% 3.45% Group 3 1 5 3.45% 17.24%
Group 4 5 1 17.24% 3.45% Group 4 6 0 20.69% 0.00%
company meaning majority are non-bankrupt companies that have relatively higher NOPAT. In Group 4-5, more bankrupt companies occur. From these 4 tables, we find that non-bankrupt companies generally have higher WACC, higher ROIC, either higher or lower than average EVA and higher NOPAT in the Materials sector.
Table 60, 61, 62, and 63 display proportion of bankruptcy in the Technology sector divided into 5 groups by WACC, ROIC, EVA and NOPAT ranked from highest to lowest.
In Technology sector, there are more bankrupt companies that occur at the upper and lower bound of WACC distribution as see in Group 1 and Group 2-4 in Table 60. There are more non-bankrupt companies in Group 2-4 and in Group 2-3, none are non-bankrupt companies. In Table 61, bankrupt companies occur frequently in Group 1 and Group 4-5. Non-bankrupt companies generally occur at the upper bound of ROIC distribution. In Table 62, majority of companies are non-bankrupt in Group 1-2 and Group 4-5 with more bankrupt companies occur in Group 3-4. In Table 63, more non-bankrupt companies occur in Group 1-3 and specifically in Group 1-2, there are no bankrupt companies. As NOPAT decreases, more bankrupt companies show up in Group 4-5 in which NOPAT are the lower bound of distribution. From these 4 tables, we can see that non-bankrupt companies tend to have higher WACC, higher ROIC, higher or lower than average EVA, and a higher NOPAT in the Technology sector.
Table 60 Technology Table 61 Technology
WACC ranked from highest to lowest ROIC ranked from highest to lowest
Bankrputcy Non-Bankruptcy Bankrputcy% Non-Bankruptcy% Bankrputcy Non-Bankruptcy Bankrputcy% Non-Bankruptcy%
Group 1 4 1 14.81% 3.70% Group 1 2 3 7.41% 11.11%
Group 2 0 5 0.00% 18.52% Group 2 0 5 0.00% 18.52%
Group 3 0 5 0.00% 18.52% Group 3 0 5 0.00% 18.52%
Group 4 2 3 7.41% 11.11% Group 4 2 3 7.41% 11.11%
Group 5 4 3 14.81% 11.11% Group 5 6 1 22.22% 3.70%
Table 62 Technology Table 63 Technology
EVA ranked from highest to lowest NOPAT ranked from highest to lowest
Bankrputcy Non-Bankruptcy Bankrputcy% Non-Bankruptcy% Bankrputcy Non-Bankruptcy Bankrputcy% Non-Bankruptcy%
Group 1 0 5 0.00% 18.52% Group 1 0 5 0.00% 18.52%
Group 2 2 3 7.41% 11.11% Group 2 0 5 0.00% 18.52%
Group 3 5 0 18.52% 0.00% Group 3 1 4 3.70% 14.81%
Group 4 2 3 7.41% 11.11% Group 4 4 1 14.81% 3.70%
Table 64, 65, 66, and 67 display proportion of bankruptcy in the Utilities sector divided into 5 groups by WACC, ROIC, EVA and NOPAT ranked from highest to lowest.
In the Utilities sector, the size of the bankrupt companies is quite small because there are only 2 bankrupt companies in this sector. In Table 64, we can see that all bankrupt companies fall into Group 1-2 in which WACC is at the upper bound. However, there are still more non-bankrupt companies in Group 1-2. In Table 65, the two bankrupt companies fall in Group 1 and Group 4 while other non-bankrupt companies are almost evenly distributed among 5 groups. In Table 66, the bankrupt companies occur in Group 3-4 in which EVA are at the lower bound of distribution. Bankrupt companies also almost distribute evenly among 5 groups. In Table 67, the bankrupt companies only occur in Group 4 while non-bankrupt companies occur among 5 groups with similar frequency. From these 4 tables, we do not see a clear pattern of how bankrupt companies generally perform the in Utilities sector as they virtually occur in all 5 groups with similar occurrence rate. We do see that bankrupt companies generally have a lower EVA and NOPAT compared to its peers in the Utilities sector.
5. Correlation
After looking at the trend of financial performance among sectors, we perform correlation test between variables to better see the relationship between them. In Table 68, we can see that
Table 64 Utilities Table 65 Utilities
WACC ranked from highest to lowest ROIC ranked from highest to lowest
Bankrputcy Non-Bankruptcy Bankrputcy% Non-Bankruptcy% Bankrputcy Non-Bankruptcy Bankrputcy% Non-Bankruptcy%
Group 1 1 3 5.26% 15.79% Group 1 1 3 5.26% 15.79%
Group 2 1 3 5.26% 15.79% Group 2 0 4 0.00% 21.05%
Group 3 0 4 0.00% 21.05% Group 3 0 4 0.00% 21.05%
Group 4 0 4 0.00% 21.05% Group 4 1 3 5.26% 15.79%
Group 5 0 3 0.00% 15.79% Group 5 0 3 0.00% 15.79%
Table 66 Utilities Table 67 Utilities
EVA ranked from highest to lowest NOPAT ranked from highest to lowest
Bankrputcy Non-Bankruptcy Bankrputcy% Non-Bankruptcy% Bankrputcy Non-Bankruptcy Bankrputcy% Non-Bankruptcy%
Group 1 0 4 0.00% 21.05% Group 1 0 4 0.00% 21.05%
Group 2 0 4 0.00% 21.05% Group 2 0 4 0.00% 21.05%
Group 3 1 3 5.26% 15.79% Group 3 0 4 0.00% 21.05%
Group 4 1 3 5.26% 15.79% Group 4 2 2 10.53% 10.53%
ROIC and NOPAT both have positive correlation with WACC with the exception that has a negative correlation with WACC, meaning the higher WACC is, the lower EVA will be. This is normal as EVA is calculated by NOPAT – Invested Capital * WACC. The higher WACC, we can expect a lower EVA. Among WACC, NOPAT, ROIC, and EVA, each of the variable have positive correlation with each other except for that between EVA and WACC.
Table 68 shows correlation between variables that include WACC, ROIC, NOPAT, and EVA in the entire sample.
In the bankruptcy sample, EVA and WACC also has a negative correlation with each other. The correlation becomes stronger in this sample as it changes from -0.57 to -0.97. The
correlation between WACC and ROIC becomes stronger in this sample as it changes from 0.00343 in the entire sample to 0.00524. The correlation between WACC and NOPAT becomes weakening as it changes from 0.02131 in the entire sample to 0.01904. The relationship between ROIC and WACC and NOPAT becomes stronger as correlation increases from 0.00343 to 0.00524 and 0.005 to 0.033 respectively. However, ROIC has weakening correlation with EVA in this sample as correlation decreases from 0.01086 to 0.00397. NOPAT generally has stronger correlation with ROIC but weakening correlation with WACC and EVA. EVA also has
weakening correlation with other variables except for correlation with WACC.
Table 69 shows correlation between variables that include WACC, ROIC,
Table 68
Correlation: Entire Sample
WACC ROIC NOPAT EVA
WACC 1.00000 0.00343 0.02131 -0.57956 ROIC 0.00343 1.00000 0.00504 0.01086 NOPAT 0.02131 0.00504 1.00000 0.22233 EVA -0.57956 0.01086 0.22233 1.00000
Table 69
Correlation: Bankruptcy Sample
WACC ROIC NOPAT EVA
WACC 1.00000 0.00524 0.01904 -0.97262 ROIC 0.00524 1.00000 0.03321 0.00397 NOPAT 0.01904 0.03321 1.00000 0.20322 EVA -0.97262 0.00397 0.20322 1.00000
NOPAT, and EVA in the bankrupt companies sample.
In the non-bankruptcy sample, correlation does not follow the same patter as we see in Table 68 and Table 69. In this sample, WACC has negative correlation with ROIC, NOPAT and EVA. Other than correlation with WACC, variables have positive correlation with each other. The correlation between WACC is EVA is -0.04363, which is much lower than that of the entire sample and bankruptcy sample. NOPAT has the strongest negative correlation with WACC, meaning higher the WACC is, lower the NOPAT will be. ROIC has stronger correlation with NOPAT and EVA in this ample with correlation at 0.18021 and 0.15165, which are all above 0.1. NOPAT has stronger positive correlation with ROIC and EVA compared to that in the entire sample and bankruptcy sample. Similar to EVA, it has stronger positive correlation with ROIC and NOPAT compared to that in the entire and bankruptcy sample.
Table 70 shows correlation between variables that include WACC, ROIC, NOPAT, and EVA in the non-bankrupt company’s sample.
6.
Logistic regression
The correlation tests suggest that between the four variables, a positive correlation usually exists except between WACC and EVA. We next conduct logistic regression analysis to analyze whether these exists significant relationship of each variable with bankruptcy. As bankruptcy is a categorical variable in the entire sample, it is noted as 1 that stands for Bankruptcy or 0 that stands for Non-Bankruptcy.
Table 70
Correlation: Non-Bankruptcy Sample
WACC ROIC NOPAT EVA
WACC 1.00000 -0.01685 -0.12443 -0.04363 ROIC -0.01685 1.00000 0.18021 0.15165 NOPAT -0.12443 0.18021 1.00000 0.30016 EVA -0.04363 0.15165 0.30016 1.00000
In Table 71, we can see a negative correlation between EVA and bankruptcy as the
coefficients is -0.001996. The p-value of EVA is 0.336, which is bigger than 0.05, suggesting no significance in this variable in predicting bankruptcy. The AIC score is lower at 29.743
compared to regression model 2 and regression model 3, meaning better quality of regression model 1. We can also see that in regression model 1-3, EVA generally has a negative correlation to EVA except for in regression model 4. The negative relationship between EVA and
bankruptcy shows that as EVA gets higher, bankruptcy gets lower, which means closer to 0 that stands for non-bankruptcy. This reflects the trend of majority sector performance as there are more non-bankrupt companies occur at upper bound of EVA distribution with some exceptions that also occur the lower bound of distribution.
As we introduce WACC, ROIC, and NOPAT in the regression models, the correlation
between EVA and bankruptcy become lower. All three other variables have negative coefficients with bankruptcy in regression model 3-4. The results also show that all variables are not
significant in predicting bankruptcy in Consumer Staples sector as their p-value is all above 0.05.
Table 71 presents coefficients of variables in 4 regressions model in the Consumer Staples sector. The table also shows 25 companies involved, AIC score which is a score that evaluates the quality of the logistic regression model. AIC is similar to R^2 in linear regression model. A lower AIC implies a better fitness and quality of the model. Pr(>|z|) value is for each new variable introduced into the model.
In the Consumer Discretionary sector, we also see a negative correlation between EVA and bankruptcy in regression model 1-3. In this sector, the correlation between EVA and bankruptcy
Table 71
Regression by Consumer Staples Sector
Regression Intercept EVA WACC ROIC NOPAT # of Observations AIC Pr (>|z|)
1 -0.457951 -0.001996 25 29.743 0.336
2 0.886862 -0.001814 -22.484468 25 31.332 0.532
3 3.034882 -0.001759 -57.041131 -4.989767 * 25 29.01 0.0682
4 494.60 0.71 -4902.00 -498.40 -0.66 25 10 0.999
becomes stronger as we introduce other variables into the models. All va