University of Pennsylvania
ScholarlyCommons
Business Economics and Public Policy Papers Wharton Faculty Research4-2012
Policy Tenure Under the U.S. National Flood
Insurance Program (NFIP)
Erwann Michel-Kerjan
University of Pennsylvania
Sabine Lemoyne de Forges Howard Kunreuther
Follow this and additional works at:http://repository.upenn.edu/bepp_papers
Part of theBusiness Commons,Economics Commons, and thePublic Affairs, Public Policy and Public Administration Commons
This paper is posted at ScholarlyCommons.http://repository.upenn.edu/bepp_papers/38 For more information, please contactrepository@pobox.upenn.edu.
Recommended Citation
Michel-Kerjan, E., Forges, S. L., & Kunreuther, H. (2012). Policy Tenure Under the U.S. National Flood Insurance Program (NFIP). Risk Analysis, 32(4), 644-658.http://dx.doi.org/10.1111/j.1539-6924.2011.01671.x
Policy Tenure Under the U.S. National Flood Insurance Program (NFIP)
AbstractIn the United States, insurance against flood hazard (inland flooding or storm surge from hurricanes) has been provided mainly through the National Flood Insurance Program (NFIP) since 1968. The NFIP covers $1.23 trillion of assets today. This article provides the first analysis of flood insurance tenure ever undertaken: that is,
the number of yearsthat people keep their flood insurance policy before letting it lapse. Our analysis of the entire portfolio of the NFIP over the period 2001–2009 reveals that the median tenure of new policies during that time is between two and four years; it is also relatively stable over time and levels of flood hazard. Prior flood experience can affect tenure: people who have experienced small flood claims tend to hold onto their insurance longer; people who have experienced large flood claims tend to let their insurance lapse sooner. To overcome the policy and governance challenges posed by homeowners’ inadequate insurance coverage, we discuss policy recommendations that include for banks and government-sponsored enterprises (GSEs) strengthening their requirements and the introduction of multiyear flood insurance contracts attached to the property, both of which are likely to provide more coverage stability and encourage investments in risk-reduction measures.
Disciplines
Policy Tenure under the
U.S. National Flood Insurance Program (NFIP)
Erwann Michel-Kerjan
The Wharton School University of Pennsylvania
Sabine Lemoyne de Forges Ecole Polytechnique and
AgroParisTech
Howard Kunreuther
The Wharton School University of Pennsylvania
June 2011
Working Paper # 2011-06
forthcoming in Risk Analysis
_____________________________________________________________________ Risk Management and Decision Processes Center
The Wharton School, University of Pennsylvania
3730 Walnut Street, Jon Huntsman Hall, Suite 500 Philadelphia, PA, 19104 USA Phone: 215‐898‐5688 Fax: 215‐573‐2130 http://opim.wharton.upenn.edu/risk/ ___________________________________________________________________________
THE WHARTON RISK MANAGEMENT AND DECISION PROCESSES CENTER
Established in 1984, the Wharton Risk Management and Decision Processes
Center develops and promotes effective corporate and public policies for low‐probability
events with potentially catastrophic consequences through the integration of risk
assessment, and risk perception with risk management strategies. Natural disasters,
technological hazards, and national and international security issues (e.g., terrorism risk
insurance markets, protection of critical infrastructure, global security) are among the
extreme events that are the focus of the Center’s research.
The Risk Center’s neutrality allows it to undertake large‐scale projects in
conjunction with other researchers and organizations in the public and private sectors.
Building on the disciplines of economics, decision sciences, finance, insurance, marketing
and psychology, the Center supports and undertakes field and experimental studies of
risk and uncertainty to better understand how individuals and organizations make
choices under conditions of risk and uncertainty. Risk Center research also investigates
the effectiveness of strategies such as risk communication, information sharing, incentive
systems, insurance, regulation and public‐private collaborations at a national and
international scale. From these findings, the Wharton Risk Center’s research team – over
50 faculty, fellows and doctoral students – is able to design new approaches to enable
individuals and organizations to make better decisions regarding risk under various
regulatory and market conditions.
The Center is also concerned with training leading decision makers. It actively
engages multiple viewpoints, including top‐level representatives from industry,
government, international organizations, interest groups and academics through its
research and policy publications, and through sponsored seminars, roundtables and
forums.
1
Policy Tenure under the
U.S. National Flood Insurance Program (NFIP)
Erwann Michel-Kerjan1*, Sabine Lemoyne de Forges2 and Howard Kunreuther3
June 28, 2011
forthcoming in Risk Analysis
Abstract
In the United States, insurance against flood hazard (inland flooding or storm surge from hurricanes) has been provided mainly through the National Flood Insurance Program (NFIP) since 1968. The NFIP covers $1.23 trillion of assets today. This paper provides the first analysis of flood insurance tenure ever undertaken: that is, the number of years that people keep their flood insurance policy before letting it lapse. Our analysis of the entire portfolio of the NFIP over the period 2001-2009 reveals that the median tenure of new policies during that time is between 2 and 4 years; it is also relatively stable over time and levels of flood hazard. Prior flood experience can affect tenure: people who have experienced small flood claims tend to hold onto their insurance longer; people who have experienced large flood claims tend to let their insurance lapse sooner. To overcome the policy and governance challenges posed by homeowners’ inadequate insurance coverage, we discuss policy recommendations including for banks and government-sponsored enterprises (GSEs) to strengthen their requirements and the introduction of multi-year flood insurance contracts attached to the property, which is likely to provide more coverage stability and could also encourage investments in risk-reduction measures.
Key Words:
Individual Decision Making; Flood Insurance; NFIP; Catastrophes; Multi-Year Insurance
1
The Wharton School, University of Pennsylvania. 2
Ecole Polytechnique and AgroParisTech, France; visiting the Wharton Risk Management Center in 2010. 3
The Wharton School, University of Pennsylvania.
* Address correspondence to Erwann Michel-Kerjan, 3730 Walnut Street, Huntsman Hall, Suite 500, Philadelphia, PA, 19104, USA. Email: erwannmk@wharton.upenn.edu,
2 1. INTRODUCTION
The economic and insured losses from great natural catastrophes such as hurricanes, earthquakes, and floods worldwide have increased significantly in recent years. According to
reinsurance giant Munich Re, economic losses over the period 2000-2009 were $670 billion,
principally as a result of the 2004, 2005, and 2008 hurricane seasons.(1). There has been also a
significant increase in insured losses during the past 20 years, largely due to the occurrence of severe catastrophes.
Table I reveals that of the twenty-five most costly insured catastrophes from 1970 to 2009 (in
2009 dollars), fourteen have occurred since 2001, twelve of them in the United States.i With the
exception of the terrorist attacks on September 11, 2001, all twenty-five of the most costly catastrophes were natural disasters. More than 85 percent of these were weather-related events— floods, hurricanes, typhoons, storms—with nearly three-quarters of the claims in the United States.(2)
It is difficult to recall that until Hurricane Hugo hit the South Carolina coast in 1989, no
disaster in the United States had cost insurers more than $1 billion in claims payments. But times
have changed: there have been repeated large-scale events in the U.S. and other parts of the world
in recent years where insured losses have far exceeded $1 billion. This change is primarily due to
an increase in the value at risk and insurance density in hazard-prone areas. Possible change in
climate patterns leading to more intense hurricanes may have played a role as well.ii
There was a radical increase in insured losses in the early 1990s due primarily to Hurricane
Andrew in Florida ($24.5 billion in 2009 dollars) and the Northridge earthquake in California
($20.3 billion in 2009 dollars). The four hurricanes in Florida in 2004 (Charley, Frances, Ivan, and
Jeanne) collectively totaled almost $35 billion in insured losses. The last two columns of Table I
indicate the allocation of losses between private insurers and by the federally-managed National Flood Insurance Program (NFIP) in the United States, when this distinction applies. All the hurricanes and storms that made landfall triggered flood insurance payments from storm surge and high levels of precipitation associated with them. Hurricane Katrina alone cost private insurers
and reinsurers an estimated $47.9 billion, and cost the NFIP an additional $17.5 billion.
This paper focuses on homeowners’ behavior with respect to flood insurance in the United States. An important policy challenge lies in the evidence from recent disasters that many residents in flooded areas did not have flood coverage when they experienced a loss. Consider the flood in August 1998 that damaged property in northern Vermont. Of the 1,549 victims of this disaster, FEMA found that 84 percent of the homeowners in flood prone areas did not have insurance, even though 45 percent of these individuals were required to purchase this coverage.
(4)
In the Louisiana parishes affected by Katrina, the percentage of homeowners with flood
insurance ranged from 57.7 percent in St. Bernard Parish to 7.3 percent in Tangipahoa when the
3
Table I. The 25 Most Costly Catastrophe Insurance Losses, 1970-2009
Event
Victims (Dead or missing)
Year Area of Primary Damage private insurance$ Billion paid by $ Billion paid bythe U.S. NFIP Hurricane Katrina 1,836 2005 USA, Gulf of Mexico, et al. 47.9 17.5
9/11 Attacks 3,025 2001 USA 36.7 -
Hurricane Andrew 43 1992 USA, Bahamas 24.5 0.3
Northridge Earthquake 61 1994 USA 20.3 -
Hurricane Ike 348 2008 USA, Caribbean, et al. 15.9 2.6 Hurricane Ivan 124 2004 USA, Caribbean, et al. 14.6 1.8 Hurricane Wilma 35 2005 USA, Gulf of Mexico, et al. 13.7 0.4 Hurricane Rita 34 2005 USA, Gulf of Mexico, et al. 11.1 0.6 Hurricane Charley 24 2004 USA, Caribbean, et al. 9.1 0.06
Typhoon Mireille 51 1991 Japan 8.9 -
Hurricane Hugo 71 1989 Puerto Rico, USA, et al. 7.9 0.64 Winterstorm Daria 95 1990 France, UK, et al. 7.7 - Winterstorm Lothar 110 1999 France, Switzerland, et al. 7.4 - Winterstorm Kyrill 54 2007 Germany, UK, NL, France 6.3 - Storms and floods 22 1987 France, UK, et al. 5.9 - Hurricane Frances 38 2004 USA, Bahamas 5.8 0.2 Winterstorm Vivian 64 1990 Western/Central Europe 5.2 -
Typhoon Bart 26 1999 Japan 5.2 -
Hurricane Gustav 2008 USA, Caribbean, et al. 5.2 0.1 Hurricane Georges 600 1998 USA, Caribbean 4.6 0.3 Tropical Storm Allison 41 2001 USA 4.3 1.34 Hurricane Jeanne 3,034 2004 USA, Caribbean, et al. 4.3 0.2 Typhoon Songda 45 2004 Japan, South Korea 4.0 -
Thunderstorms 45 2003 USA 3.6 -
Hurricane Floyd 70 1999 USA, Bahamas, Columbia 3.5 0.6
Data from Swiss Re, Insurance Information Institute and U.S. Department of Homeland Security
Note: Dollar amounts are indexed to 2009 using inflation rates published by the U.S. Bureau of Labor Statistics.
Uninsured homeowners create a welfare cost to themselves and to all taxpayers if the government provides them with disaster assistance. Under the current U.S. system, the Governor of the state(s) can request that the President declare a “major disaster” and offer special assistance if the damage is severe enough. As depicted in Figure 1, the number of Presidential disaster declarations has dramatically increased over the past 50 years: there were 162 over the period 1955-1965, 282 over 1966-1975, 319 over the period 1986-1995 and 545 during 1996-2005. Figure 1 also depicts the number of those Presidential declarations that were triggered by flooding events (inland flood and storm surge from hurricanes). These flood-related declarations
4 account for nearly two-thirds of all declarations over the period 1958-2009, demonstrating the significance of floods among all U.S. disasters.
Figure 1. Number of U.S. Presidential Disaster Declarations – 1958-2010
0 10 20 30 40 50 60 70 80 90
Total number of declarations Declarations associated with floods
Source: Authors’ calculations with data from the U.S. Department of Homeland Security
In response to Hurricane Katrina in 2005, two emergency supplemental appropriations bills (P.L. 109-61 and P.L. 109-62) were enacted by Congress that provided $67.9 billion for emergency response and recovery needs (in 2009 prices). The following year, another $20.5 billion was appropriated in supplemental legislation (P.L. 109-234; in 2009 prices) for recovery assistance. Taken together, this $88.4 billion federal relief is more than the combined total amount of insurance claims paid by private insurers for wind damage and by the NFIP for flood
damage caused by Katrina.(6)
The paper is organized as follows. Section 2 aims to familiarize the reader on the subject of flood hazard and flood insurance in the United States. It provides a general overview of flood losses in the past decade and of the operation of the NFIP. The authors also present county-level statistics on insurance penetration and the distribution of flood insurance nationwide, based on our analysis of the entire portfolio of the NFIP from January 2001 to December 2009 that was provided to the Wharton Risk Management Center for research purposes, with data from
SHELDUS(7) and the U.S. Bureau of the Census.
Section 3 provides the key contribution of this paper. That is an analysis of the insurance tenure of new policies entering the NFIP in 2001 for all consecutive years until 2009. By “tenure” we mean the number of years that people keep their flood insurance policy before it lapses. The first series of analyses is performed at a national level. We then replicate it at a state level for California, Florida, Louisiana and Texas, which together represent nearly two-thirds of the entire NFIP portfolio, and for several states in the Northeast, another exposed region (Connecticut, Delaware, New Jersey, New York, and Pennsylvania).
5 Our main finding is that the median flood insurance tenure is between 2 and 4 years only. This finding is quite stable over time, across the country, holds for properties located in Special Flood Hazard Areas (SFHAs; high-risk areas) and in non-SFHAs (low-risk areas) alike. We also look at those policyholders who suffered a claim the very first year they entered the program. Such a claim experience can impact their tenure, but only if the claim is small (which increases the tenure) or very high (which decreases it).
Section 4 discusses some reasons why this tenure is so short. Aside from migration, behavioral biases have a negative influence on the length of time that people hold onto their insurance policies. People typically have difficulty understanding the probability of loss. They underestimate their exposure, misjudge the economic and social impact from suffering flood damage and have short memories regarding past catastrophes. There might also be rational economic explanations, for instance, that flood insurance competes with the family’s other expenses.
In section 5, we discuss policy recommendations, among them, our recommendation that Congress and FEMA work more closely with banks and government-sponsored enterprises (GSEs; e.g., Fannie Mae and Freddie Mac) to ensure a much higher compliance rate with the mandatory flood insurance purchase requirement. We also propose the creation of multi-year flood insurance contracts (e.g., 3, 5 or 10 years) attached to the property, not the individual, which would be added to the menu of contracts offered by the NFIP.
2. OVERVIEW: FLOOD LOSSES AND FLOOD INSURANCE IN THE UNITED STATES 2.1. Distribution of Flood Losses by County
Flooding arises from different types of events: coastal surges linked to hurricanes, heavy rains, and large river flows. The distribution of floods in the United States is linked to climatic,
topographic and basin size characteristics.(8) To examine flood damage nationwide, we
constructed two measures of flood experience by using information from the SHELDUS
database(7): the number of floods that occurred between January 1, 2000 and December 31, 2008
in a given county (Figure 2a) and the property losses associated with these floods in that same
county (Figure 2b). In both measures, we consider only flood events that inflict more than
$100,000 in damage (in 2008 prices).
The data from Figure 2a reveals that while floods are often described as low-probability,
high-consequence events, these events occur relatively frequently in some parts of the country, notably southern California, counties in the Great Plains states, counties in the Northeast and those along the coasts of the Gulf of Mexico and Florida. Many of these counties have experienced at least four floods inflicting more than $100,000 in property costs between 2000 and 2008, and a not trivial number of them experienced eight floods or more during this period.
6
Figure 2a. Number of Floods between 2000 and 2008
Figure 2b. Property Losses Due to Floods between 2000 and 2008
Source: Authors’ calculation – Data from SHELDUS --- Note: County level analysis. Included here are only those floods which inflicted more than $100,000 in property costs in a given county (2008 prices). When considering counties that experienced losses, $0.5 million correspond to the first quartile, $1.5 million to the median damage, $5.1 million to the third quartile and $51.1 million to the 95th percentile of the damage distribution (Figure 2b).
7
As shown in Figure 2b, the counties with high property damages correspond to localities
with high flood frequencies, notably in the Northeast. Several counties along the Gulf Coast and
Florida are in the 95th percentile of the damage distribution (represented in black in Figure 2b),
primarily because they experienced severe storm surges from all the major hurricanes that made landfall between 2004 and 2008. This dual characteristic of the flood hazard—frequent but smaller floods, and less frequent but truly devastating ones with a very high degree of loss
concentration—explain why insurers have historically refused to cover flood hazard(9) and the
creation of the federally-run NFIP, to which we now turn.
2.2. The Rationale for the NFIP
The National Flood Insurance Program (NFIP) was ultimately developed due to a widespread belief among private insurance companies that flood peril was uninsurable by the private insurers alone. This lack of coverage by the private sector led the federal government to provide significant relief to victims of Hurricane Betsy in 1965. Discussion took place about the role that the federal government could play in developing some form of public insurance
coverage, which led to the creation of the NFIP in 1968.(10) It was thought that a government
program could potentially be successful because it would have funds to initiate the program, pool risks more broadly, subsidize existing homeowners while charging actuarial rates to new constructions, and tie insurance to land-use changes that might lower risks. The program would also have the capacity to spread losses over time by borrowing money from the federal government to compensate for a deficit, something private insurers cannot do (see
Michel-Kerjan(11) for an analysis of the first 42 years of operation of the program between 1968 and
2009).
The NFIP was originally designed as a voluntary partnership between the federal government and communities: local governments enacted floodplain management regulations; in exchange, property owners in participating communities were eligible for federal flood insurance. The cost of flood insurance is determined by the federal government, which manages the program. The length of the contract is also determined by the government; it is one year. The majority of NFIP policies are written through the Write-Your-Own (WYO) Program, which allows participating property/casualty insurance companies to write and service NFIP’s standard
one-year flood insurance policy.(12) The insurance companies bear no risk and are compensated
for writing policies and settling claims; the Federal Emergency Management Agency (FEMA), which runs the program today under the U.S. Department of Homeland Security, benefits from the private industry’s marketing channels and the presence of private insurers in participating communities. Nearly all flood policies issued today by the NFIP are written by 90 companies that write flood insurance policies through the WYO program. (Note that some additional coverage is offered by private insurers above the current $250,000 maximum building-coverage limit covered by the NFIP for residential property owners and under special commercial insurance policies, but this is not the focus of this paper).
8 2.3. Dataset and Key Statistics
More than 40 years after its inception, the NFIP has grown significantly. As of December 2010, there were 5.65 million NFIP policies-in-force nationwide which generated $3.35 billion in premiums (average annual premium per policy of $593 nationwide), for a total insured value of over $1.23 trillion.
The dataset we accessed comprises the entire portfolio of the NFIP nationwide for nine
consecutive years (2001–2009). The dataset does not provide identifying information of the
homeowner, preventing us from doing a household-level analysis, but it has the ZIP code, city, and county in which the policyholder’s residence is located. It contains a variety of variables relating to the policy such as the date the policy was purchased and when it lapsed. The dataset also has the flood zone, notably if the property is located in a Special Flood Hazard Area (SFHA) defined by FEMA as “the area that will be inundated by the flood event having a 1 percent chance of being equaled or exceeded in any given year.” After we eliminated some policies for
which we do not have complete information over time, our dataset contained 34.4 million
policies-in-force, ranging from 4 million policies-in-force in 2001 to 5.3 million in 2009.
It is interesting to see whether the counties that suffered a large number of floods in past
years and/or high level of damage (Figures 2a and 2b) are also those where the demand for flood
insurance is high. In Figure 3 we construct a measure of insurance penetration at a county level
for the year 2008 that is defined as the ratio of number of flood policies-in-force over number of housing units in that county (as estimated by the U.S. Census; 2008 is the latest data available). We see that insurance penetration rates are very heterogeneous throughout the country. More
than half of the counties have a penetration rate lower than 1 percent. While this is expected for
regions of the country that are not prone to flood hazard (e.g., the Great Plains), this is surprising for counties that have suffered eight floods or more over the period 2000-2008; that is the case for some counties in Ohio, Minnesota and Iowa.
The highest penetration rates are seen in coastal counties where flood damage due to
storm surge has been severe in recent years (see Figure 2b), particularly in Florida, Louisiana and
Texas (86.4 percent of the NFIP policies were situated in coastal counties along the Atlantic and
the Pacific coasts in 2009). As expected, high penetration rates also correspond to more exposed counties along large rivers (e.g., the Mississippi River) or those subject to high precipitation
(e.g., the Northeast). Finally, it is worth mentioning here that 61.1 percent of the NFIP
policies-in-force in 2009 were situated in an SFHA. In other words, nearly 40 percent of the people who
had flood insurance coverage that year were living in an area not considered high risk by
9
Figure 3. Flood Insurance Penetration by County in 2008
Source: Authors’ calculation – Data from NFIP, U.S. Census.
Note: County level analysis. Insurance penetration at a county level that is defined as the ratio number of flood policies over number of housing units in that county
The data we accessed from the NFIP allows us to address questions concerning insurance demand by calculating a proxy of insurance penetration, as we just demonstrated. Through more advanced econometric analyses it is also possible to determine the impact on insurance demand of loss experience, federal relief, period since the last loss, news coverage as well as the effect of
risk reduction measures on flood losses;iv these analyses are undertaken in several companion
papers currently in progress.
Here, we concentrate our analysis on the dynamic of insurance purchase and the following questions: How long do individuals who have purchased flood insurance keep their policy for? Does this insurance tenure depend on the level of flood risk the individuals are subject to? Does this tenure vary over time and across locations? How is it affected by claim experience?
10 3. ANALYSIS OF FLOOD INSURANCE TENURE
3.1. Evolution of inflows and outflows NFIP policies: The Katrina Effect
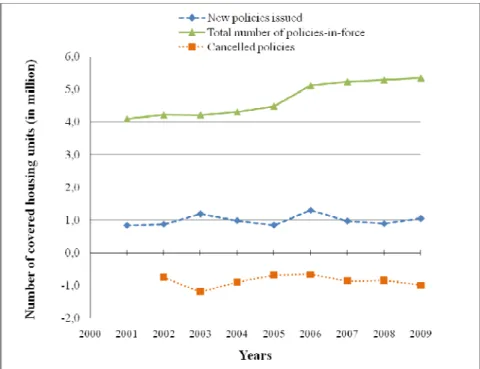
To better appreciate the national dynamic of flood insurance purchases over time, Figure 4 depicts the number of housing units in our sample covered by NFIP policies (solid line; total number of policies-in-force). From this entire portfolio, it is also possible to analyze the inflows
of new policies into the program over the period 2000-2009 (dashed line; new policies issued)
and outflows, that is, the number of policies that lapse each year (dotted line; cancelled policies). Several housing units may be covered under the same NFIP contract, as is the case for condominium associations. For notational simplicity, we call “policy” one housing unit covered by a NFIP contract. In general, the total number of policies-in-force grew at a relatively stable rate between 2001 and 2009 -- between 0 and 4 percent annually (except for the year 2006 which we discuss below). Over this 2001-2009 period, we calculated that the number of new policies issued by the NFIP each year represented, on average, 21.3 percent of the number of policies-in-force.
Figure 4. Number of NFIP Policies-in-Force -- 2001-2009
Source: Authors’ calculation – Data from the NFIP.
In 2006, mostly as a result of historical flood claims due to Hurricanes Katrina, Rita and Wilma and related storm surge that had occurred the year before, the number of policies-in-force
increased by 14.3 percent; that is three to four times the growth rates observed in previous years.
This may be interpreted as a “Katrina Effect”: many more people wanted to be covered right after the disaster. However, this does not imply that they still felt this way several years later. A
11 more detailed investigation of the tenure of new flood insurance contracts is required to better understand this dynamic, to which we now turn.
3.2. Measure of Flood Insurance Tenure
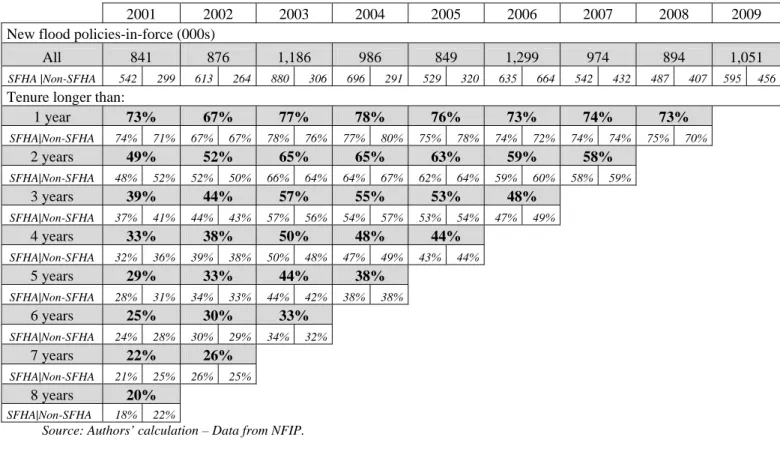
To measure the NFIP insurance tenure, we extract from the entire portfolio all new policies-in-force issued in a given year over the period covered by our sample. By using the unique identification number associated with each new policy and tracking this number over time, it is possible to determine how many times each annual policy was renewed before it
lapsed.v Table II presents the results for our analysis. For each year, we look at the number of
new policies issued by the NFIP and their respective durations through 2009 (bold numbers). (We do not look at policies that were already in the program before 2001 and remained in it after that year.)
Given our interest in analyzing what influence living in a high-risk area could have on
insurance tenure, we also distinguish in Table II between policies in SFHAs and in non-SFHAs
(results are numbers in italics).
Table II. Tenure Results: Duration of New NFIP Policies by Year after First Purchase -- 2001-2009
2001 2002 2003 2004 2005 2006 2007 2008 2009
New flood policies-in-force (000s)
All 841 876 1,186 986 849 1,299 974 894 1,051
SFHA |Non-SFHA 542 299 613 264 880 306 696 291 529 320 635 664 542 432 487 407 595 456
Tenure longer than:
1 year 73% 67% 77% 78% 76% 73% 74% 73% SFHA|Non-SFHA 74% 71% 67% 67% 78% 76% 77% 80% 75% 78% 74% 72% 74% 74% 75% 70% 2 years 49% 52% 65% 65% 63% 59% 58% SFHA|Non-SFHA 48% 52% 52% 50% 66% 64% 64% 67% 62% 64% 59% 60% 58% 59% 3 years 39% 44% 57% 55% 53% 48% SFHA|Non-SFHA 37% 41% 44% 43% 57% 56% 54% 57% 53% 54% 47% 49% 4 years 33% 38% 50% 48% 44% SFHA|Non-SFHA 32% 36% 39% 38% 50% 48% 47% 49% 43% 44% 5 years 29% 33% 44% 38% SFHA|Non-SFHA 28% 31% 34% 33% 44% 42% 38% 38% 6 years 25% 30% 33% SFHA|Non-SFHA 24% 28% 30% 29% 34% 32% 7 years 22% 26% SFHA|Non-SFHA 21% 25% 26% 25% 8 years 20% SFHA|Non-SFHA 18% 22%
Source: Authors’ calculation – Data from NFIP.
Table II can be interpreted as follows: of the 841,000 new policies entering the NFIP in
2001, only 73.2 percent (rounded to 73 percent in the table) were still in force one year later.
12
(eight years after 2001), only 19.6 percent of them were still in place. In 2004, there were
986,000 new flood insurance policies issued by the NFIP. And we see a similar trend: only
77.7 percent of them (rounded to 78 percent) were still in place one year later. Five years later, in
2009, only 38.3 percent of them were still in force.
The tenure of all these flood insurance policies follows a similar pattern. The most
important drop is observed after just one year (ranging from 20.7 percent in 2008 to 32.7 percent
in 2002). After the first year, the cancellation rate is lower but still quite significant. As shown in Table II, the median tenure from policies issued between 2001 and 2006 is between 2 and 4 years. This is an important result of this study.
The evolution of that median tenure over time can be partially attributed to steps taken by FEMA to encourage individuals to purchase flood insurance. Prior to 2003, tenure was 2 years on average. For new policies issued between 2003 and 2006, it is longer (3 to 4 years), then it declines again to less than 3 years in 2007. This temporary increase in the length of the tenure is
likely due to an extensive advertising campaign undertaken by FEMA, the Floodsmart
(www.floodsmart.gov) public awareness campaign, which was launched in 2004.(15)
Comparison between SFHA and non-SFHA --- Do residents in an SFHA keep their flood
insurance policy longer than people living outside a high-risk flood-prone area? Since non-SFHA policies represented 38 percent of the NFIP in 2009, this comparison is of some interest in understanding factors that could influence individuals to cancel their policy.
On the one hand, homeowners with a federally-backed mortgage living in SFHAs are required to buy flood insurance. However, some banks and government-sponsored enterprises (GSEs) such as Fannie Mae and Freddie Mac might fail to enforce this requirement. Furthermore, mortgages are often transferred to other banks (and then to the secondary market) in non-flood-prone regions of the country, where there is less awareness of either the flood risk or the requirement that homeowners may be required to have this coverage. In other words, banks require proof of flood insurance coverage at the time the original mortgage is issued, but
may not check to see that insurance policies are renewed.(16) This may account for the large drop
after just one year.vi
On the other hand, one might argue that those residents in non-SFHAs who decided to purchase flood insurance even though they were not required to do so, might simply be more risk averse and thus keep their insurance longer for that reason.
Table II presents the tenure pattern for SFHA (left column) and non-SFHA residents (right column). Somewhat surprisingly, these results do not show any statistically significant difference between the tenure behavior of SFHA residents and non-SFHA residents. That suggests that the tenure of flood insurance under the NFIP is independent of the level of
exposure to the hazard; we find that this result is robust over the period 2001-2009.
We also analyzed the tenure for policies located specifically in flood zone A and flood zone V (SFHAs) and those located in zones B, C and X (non-SFHAs). The findings on SFHAs (not reported here) indicate that a slightly higher percentage of policies remain in effect after a
13 given period of time (1, 2, 3 years, etc.) for those in V zones (coastal areas) than those in A zones. The difference is, on average, 1 to 3 percentage points. Interestingly, for non-SFHAs where insurance is not required, the median tenure is longer for those insured living in X zones (4 to 8 percentage point higher). X zones are areas determined to be outside the 500-year flood and those protected from a 100-year flood by levees. As a result, FEMA considers the risk to be moderate; therefore flood insurance is cheaper, which might induce policyholders to keep their coverage. The presence of the levee might make some residents more sensitive to flood risk (even though, as we discuss later, the levee can also provide a false sense of security to many others, who would then not purchase insurance at all).
Impact of flood experience --- We also looked at whether the policy tenure was different for policyholders who filed a claim. Here, we restrict our descriptive analysis to homeowners who experienced a claim the very first year they entered the program so we have the longest time
horizon to look at in our dataset.vii We find that, on average, the tenure was not different than for
those without claims.viii
However, looking more precisely at different sizes of claims, we find that the tenure is
affected by the level of claims. Figure 5 below compares three categories of policyholders: those
with no claim the first year, those who filed a relatively small claim (below 10 percent of their limit) and those who filed a very large claim (higher than 75 percent of their limit). We analyze what percentage of these policyholders kept their policy for one, three and five years.
Figure 5. Impact of Claims on Policy Tenure
Source: Authors’ calculation – Data from NFIP.
Note: This figure show what percentage of NFIP policies were still in the program one, three and five years after they were first introduced depending on the level of claim the policy sustain in its first year (average
percentage over the period 2000-2009). Very high claim refers to a claim higher than 75 percent of the flood
policy limit; relatively low claim refers to a claim which was lower than 10 percent of the policy limit.
The pattern is the same: a small claim the first year leads to longer policy tenure. One possible explanation is that those policyholders realize the benefit of flood insurance very soon
14 and see it as a good investment because they can collect rapidly on their insurance (see our discussion on that point in section 4). This positive effect fades, however, as claims increase (results not reported here), and then reverses for very high claims. Indeed, policies that had a
claim the first year higher than 75 percent of the insurance limit showed a much lower tenure
than those with no claim. One possible explanation is that those residents relocated elsewhere, either because the damage from the flood made the house unlivable or because the disaster experience was so traumatizing. In both cases, the residents would terminate their policy.
Another explanation relates to the gambler’ fallacy;(19) some insureds might think that since they
just experienced a major flood, they will not be flooded again for many years; they feel they don’t need coverage anymore and let their policy lapse.
In summary, it appears that flood experience has a positive impact on flood insurance tenure, but only for relatively small claims. These results need to be viewed with caution, though, since we look only at policies with a claim the first year; claims experience will be analyzed in more detail in companion papers.
Comparison across locations --- We were also interested in testing whether calculating tenure at the national level would hide important differences across regions, and to some extent it does. In
Figure 6 we focus on new policies issued in 2001 and compare the tenure for the entire dataset
(the United States), with the tenure of new policies issued that same year in California, Florida, Louisiana, and Texas. We also calculated the tenure for a group of states in the Northeast (Connecticut, Delaware, New Jersey, New York, and Pennsylvania).
While there are some important differences between states (for instance, residents in the Northeast region keep their flood policies longer than those in California), all the tenure curves
in Figure 6 show a similar decrease over time, with the most important drop always being after
15
Figure 6. Tenure of Policies Purchased in 2001 (Different Regions)
Source: Authors’ calculation – Data from the NFIP.
Accounting for migration --- In considering why individuals let their insurance lapse, it is important to integrate migration into the analysis. When a family with flood insurance changes residence, their policy is terminated. So an important question is how much of the lapse we
observe in Table II can be attributed to people moving from their home. How long do people stay
in their home, on average, nationwide? The American Community Survey undertaken every year provides some insights into this question for each year between 2001 and 2008. When asked “Were you in a different residence one year ago?”, fewer than one-sixth of the respondents said they were. This result remains stable over the period 2001-2009 (the average over this time
period was 15.6 percent and was slightly higher in Florida than it was in the Northeast). This is
an upper-bound of the ratio of people whose duration of residence is one year or less in the same
house: that can explain part of the important lapse after one year in NFIP policies.
While there is no data that replicate this survey for migration rates two, three or four years after one has lived in a specific residence, the ACS provides another insightful data point: the median length of residence in one place. Over the period covered by our flood insurance dataset, the median length of residence at a national level was between 5 and 6 years. These median durations are higher than the median tenure of flood insurance we discussed in Table II (2 to 4 years). So while migration patterns explain some of the drop in flood insurance policies, a large part remains unexplained.
Why do so many people let their flood policy lapse so quickly if they are still living in their residence? Is it rational to buy a flood policy just to cancel it two or three years later given the exposure the flood hazard probably remains the same?
16 4. EXPLAINING SHORT FLOOD INSURANCE TENURE: BEHAVIORAL ASPECTS
There might of course be economic reasons as to why many residents cancel their flood policy. A proportion of the population lives on a fixed income, and many depend on some form of government assistance each month. Many people who work live from paycheck to paycheck and often find themselves short of cash for necessities (or what they perceive as such). Given constrained resources, some residents may also be forced in some cases to choose between alternative protective behaviors, such as buying healthier food, or replacing bald tires, or purchasing health insurance, or auto insurance, or fire insurance. Finances can also be volatile,
with lean times requiring hard choices among competing protective actions.ix
The discussion of behavioral aspects might provide another set of reasons as to why
many people (those who do not move) do not keep their coverage for very long after they first
bought it and why many others do not purchase flood insurance at all.
Decisions about protection are rarely based on formal beliefs about probabilities. Magat,
Viscusi and Huber(20) and Camerer and Kunreuther(21) for example, provide considerable
empirical evidence that individuals do not seek out information on probabilities in making their
decisions.x Huber, Wider and Huber(23) showed that only 22 percent of subjects sought out
probability information when evaluating risk managerial decisions. In another study, when consumers are asked to justify their decisions on purchasing warranties for products that may
need repair, they rarely use probability as a rationale for purchasing this protection.(24) The fact
that there was no statistical difference in our analysis in tenure behavior between residences in SFHA and those in non-SFHA provides additional support for this finding.
Since people are not good at using probability data, the way information about flood risk
is typically presented to individuals, such as “you are in a 100-year return period floodplain”
(i.e., the aforementioned SFHA), is not very helpful for making decisions as to whether or not to
undertake protective measures. And if one is told “you are not in a 100-year return period
floodplain” this may imply to a person that he or she is not at risk, because s/he is not required to
have purchase insurance under FEMA’s rules. But of course, being outside of a SFHA does not make one immune to flooding.
Unless the risk is communicated effectively, levees and other flood control projects are also likely to give residents a false sense of security with respect to suffering damage from floods or hurricanes. In fact, Gilbert White pointed out many years ago that when these projects are constructed, there is increased development in these “protected” areas. Should a catastrophic disaster occur so that residents of the area are flooded, the damage is likely to be considerably greater than before the flood-control project was initiated. This behavior and its resulting
consequences have been termed the levee effect. Evidence along these lines has been offered by
Burby(25) who argues that actions taken by the federal government, such as building levees, make
17 breached or overtopped. As our analysis also shows, however, other people might view the levee as a daily reminder of the risk they face and hence keep their insurance coverage longer.
There is also evidence that people tend to ignore risks whose subjective odds are seen as falling below a certain level. In a laboratory experiment on purchasing insurance, many individuals bid zero for coverage, apparently viewing the probability of a loss as sufficiently
small that they were not interested in protecting themselves against it.(26) Prior to a disaster,
many individuals perceive its likelihood as sufficiently low that they contend “it will not happen
to me” (probability neglect). Because of that, saying “you have a 1 percent chance of being
flooded this year” (because the house is in a SFHA) seems like a very low number, certainly below many people’s threshold of concern. As a result, they do not feel the need to invest voluntarily in protective measures, such as making their house more resilient against floods, or maintaining flood insurance coverage.
After the disaster occurs, however, these same individuals express remorse that they didn’t undertake protective measures. After Hurricane Katrina, a common theme heard from survivors who had not bought insurance to protect their house, was, “Had I known it would be this bad, I would have purchased it.” The reality, of course, was that they were told many times
in the preceding yearsthat it could be that bad.(27,28) This may be a reason why we observe many
more new policies entering the NFIP as a result of the 2005 hurricane seasons, which triggered historical flood losses, than in previous years (see Figure 4). It is also likely that there might be some form of “availability bias” (personal flood experience of relatively small claims as we showed in section 3). Knowing someone who has suffered a loss or extensive media coverage of flood events can change ones’ risk perception even though statistically there may not be a change
in the probabilities of future flooding.(19). The sharp increase in purchase of flood insurance
policies in 2006 after historical flooding in Louisiana and Mississippi illustrates this phenomenon. Quantifying all these possible effects requires a more advanced econometric treatment, which as noted above is currently being undertaken in companion papers.
Even for those who have suffered from flooding, the impact of the disaster quickly fades over time. To illustrate: a survey of 1,100 adults living along the Atlantic and Gulf Coasts undertaken in May 2006 (nine months after Hurricane Katrina) revealed that 83 percent had taken no steps to fortify their home, 68 percent had no hurricane survival kit, and 60 percent had
no family disaster plan.(29) Table II illustrates this lack of concern. While many more people
purchased flood insurance right after the 2005 hurricane season, they did not keep their coverage longer than those who purchased a policy prior to 2005.
5. OVERCOMING SHORT INSURANCE TENURE BY DEVELOPING MULTI-YEAR CONTRACTS
To overcome these behavioral biases that lead to cancellation or lapses in flood insurance policies after just a few years, several actions could be taken. First, Congress and FEMA should
18 work more closely with banks and GSEs to ensure a much higher compliance rate with the mandatory purchase requirement, and fine those who do not meet this requirement.
Based on our discussion of behavioral biases toward catastrophe, another option would be to introduce a different type of flood insurance contract to the current menu sold by the NFIP and WYO insurers: multi-year flood insurance contracts of 3, 5, or even 10 years tied to the
property, not the individual; that is, multi-year flood insurance, as introduced in Kunreuther(30),
Kunreuther and Michel-Kerjan(16) and Jaffee, Kunreuther and Michel-Kerjan (31).xi
With multi-year insurance, if the homeowner sold his or her property before the end of the policy period, then the insurance policy would automatically be transferred to the new owner at the same (fixed or indexed) rate. This would certainly help ensure more properties stay covered given the migration effect we discussed in section 3. If the risk changed after this fixed time period, then the increased risk would be reflected in a new premium when the multi-year policy is up for renewal. Private insurers currently participating in the Write-Your-Own-program would add a menu of multi-year contracts to the menu of one year contracts they currently offer
on behalf of the federal government. Our analysis of the flood insurance tenure (Table II) shows
that even a 5-year contract would have tremendous benefits in keeping hundreds of thousands of properties covered.
The NFIP could also work more closely with financial institutions that could provide home improvement loans to make insured properties more resilient to future floods. Such loans could be made available to spread the cost of the adaptation measure over time. For example, a homeowner with a 10-year mortgage and a 10-year flood insurance policy could obtain a 10-year home improvement loan. The financial arrangement could be such that the annual home-improvement loan payments are less than the rebate the property owner obtains from the NFIP in the form of an annual premium reduction, because the house is less exposed to flood damage. These risk reduction measures would likely have the added benefit of increasing property values.xii
The combination of multi-year flood insurance and multi-year loans for reducing future flood losses promises to improve both individual and social welfare from the perspective of all the relevant stakeholders—homeowners, FEMA, banks and other financial institutions, and the taxpayer. Indeed, homeowners would be protected much longer and pay less by investing in risk reduction measures; the NFIP is thus less exposed to damage; the bank has safer mortgages; and the general taxpayer will pay less for post-disaster relief. Everybody is better off with this proposal. Finally, there is another important reason why such multi-year flood insurance policies attached to the property would be a great improvement over annual policies. It would ensure the spread of risk within the program and over time. This effect would be even stronger if all properties in flood-prone areas were required to have long-term coverage and this requirement were well enforced. One way to enforce this would be to link it to real estate taxes. This would provide much-needed financial revenue for the program over time because it would create a
19
Acknowledgements -- We are indebted to the NFIP for providing us with the dataset on which this study
is based, and to Tim Scoville and Ed Pasterick for the many discussions we had together on the practical operation of the program over the past several years. The three referees provided insightful comments on an earlier version of this paper. Partial funding for this research was provided by: the Wharton Risk Management and Decision Processes Center’s “Extreme Events” project, the AXA Chair on Major Risks at the Ecole Polytechnique (France); the center for Climate and Energy Decision Making (SES-0949710), through a cooperative agreement between the National Science Foundation and Carnegie Mellon
University; the Center for Risk and Economic Analysis of Terrorism Events (CREATE) at the University of Southern California; CRED at Columbia University; National Science Foundation (NSF grant # SES-1061882); and the Travelers Companies, Inc.
20
References
1. Munich Re. Topics Geo. Natural Catastrophes 2009. Munich: Munich Re.
http://www.munichre.com/publications/302-06295_en.pdf. Access on June 15, 2011.
2. Kunreuther H, Michel-Kerjan E. At War with the Weather: Managing Large-Scale Risks in a New Era of Catastrophes, Cambridge, MA: MIT Press, 2009.
3. Pielke R Jr, Gratz J, Landsea C, Collins D, Saunders M, Musulin R.. Normalized hurricane
damage in the United States: 1900–2005. Natural Hazards Review,2008; 9(1):29-42.
4. Tobin R, Calfee C. 2005. The national flood insurance program’s mandatory purchase requirement: Policies, processes, and stakeholders. Washington, DC: American Institutes for Research.
5. Bayot J, Payouts Hinge on the Cause of Damage. New York Times, August 31, 2005.
6. Emergency Supplemental Appropriations for Hurricane Katrina Relief. Washington, DC: U.S. Congressional Research Service, August 22, 2006.
7. Hazards & Vulnerability Research Institute. 2009. The Spatial Hazard Events and Losses
Database for the United States, Version 7.0 [Online Database]. Columbia, SC: University of South Carolina. Available at http://www.sheldus.org
8. O’Connor JE, Costa JE. Large floods in the United States: Where they happen and why. U.S. Geological Survey Circular 1245. 2003 p. 13
9. Grossman DA. Flood Insurance: Can a Feasible Program Be Created? Land Economics, 1958; 34(4):352–357.
10. Kunreuther H, Ginsberg R, Miller L, Sagi P, Slovic P, Borkan B, Katz N. Disaster Insurance Protection: Public Policy Lessons. New York, NY: Wiley, 1978.
11. Michel-Kerjan E. Catastrophe Economics: The National Flood Insurance Program. Journal of Economic Perspectives, 2010; 24(4):165–86.
12. Pasterick E. The National Flood Insurance Program. In: Kunreuther H and Roth R, Sr. editors. Paying the Price: The Status and Role of Insurance Against Natural Disasters in the United States. Washington, DC: Joseph Henry Press, 1998.
13. Dixon L, Clancy N, Seabury SA, Overton A. The National Flood Insurance Program’s Market Penetration Rate: Estimates and Policy Implications. Santa Monica, CA: RAND Corporation, 2006.
14. Michel-Kerjan E, Kousky C. Come Rain or Shine: Evidence for Flood Insurance Purchases in Florida. Journal of Risk and Insurance, 2010; 77(2): 369-398.
15. Walker DM. Federal Emergency Management Agency, Challenges for the National Flood Insurance Program. Washington, DC: U.S. Government Accountability Office. GAO-06-335T, January 25, 2006.
16. Kunreuther H, Michel-Kerjan E. Market and Government Failure In Insuring U.S. Natural
Catastrophes: How Long-Term Contracts Can Help. In:Brown J, editor. Private Markets and
Public Insurance Programs. Washington, DC: American Enterprise Institute Press, 2010. 17. Flood Insurance. Extent of Noncompliance with Purchase Requirements Is Unknown.
21 18. Kousky C, Michel-Kerjan E, Raschky P. The Demand for Flood Insurance: Uncovering the
Effects of Damage, News, and Governmental Relief over Time and Space. Wharton Risk Center, The Wharton School, University of Pennsylvania. In preparation.
19. Tversky A, Kahneman D. Judgment under Uncertainty: Heuristics and Biases. Science, News Series, 1974; 185 (4157), 1124-1131.
20. Magat W, Viscusi KW, Huber J. Risk-dollar Tradeoffs, Risk Perceptions, and Consumer
Behavior. In: Viscusi W, Magat W, editors, Learning About Risk(p. 83-97). Cambridge, MA:
Harvard University Press, 1987.
21. Camerer C, Kunreuther H. Decision Processes for Low Probability Events: Policy Implications.
Journal of Policy Analysis and Management, 1989; 8:565-592.
22. Kunreuther H, Meyer RJ, Michel-Kerjan E. Strategies for better protection against catastrophic
risks. In: Shafir E, editor.Behavioral Foundations of Policy. Princeton NJ: Princeton University
Press. In press.
23. Huber O, Wider R, Huber O. Active Information Search and Complete Information Presentation in Naturalistic Risky Decision Tasks. Acta Psychologica, 1997; 95:15-29.
24. Hogarth R, Kunreuther H. Decision Making Under Ignorance: Arguing with Yourself. Journal
of Risk and Uncertainty, 1995;10:15-36.
25. Burby R. Hurricane Katrina and the Paradoxes of Government Disaster Policy: Bringing About Wise Governmental Decisions for Hazardous Areas. The ANNALS of the American Academy
of Political and Social Science2006; 604:171-191.
26. McClelland G, Schulze W, Coursey D. Insurance for Low-Probability Hazards: A Bimodal Response to Unlikely Events. Journal of Risk and Uncertainty, 1993; 7: 95-116.
27. Fischetti M. Drowning New Orleans. Scientific American. October, 2001. 28. Bourne J Jr. Gone with the Water. National Geographic, October. 2004.
29. Goodnough A. As Hurricane Season Looms, State Aim to Scare. The New York Times, May 31, 2006
30. Kunreuther H. Reducing Losses from Catastrophic Risks through Long-term Insurance and Mitigation. Social Research, 2008; 75(3):905–930.
31. Jaffee D, Kunreuther H, Michel-Kerjan E. Long Term Property Insurance. Journal of Insurance Regulation. 2010; 29(7):167-187.
22
Endnotes
i
Several large-scale disasters have also occurred in regions where the insurance penetration is very low, so they do not appear here. That is the case, for instance, of the December 2004 tsunami in Southeast Asia that killed over 250,000 and the 2010 earthquake in Haiti that killed nearly 300,000.
ii
See Kunreuther and Michel-Kerjan(2) and Pielke et al.(3) for a discussion on the question of attribution. iii
A study of the flood insurance penetration rates which could be associated at a much more granular level with local exposure to flood hazard would be highly valuable, but this would require a precise estimate of the number of housing units situated in all floodplains across the United States. To our knowledge, this has not been done at a national level, yet, even though more NFIP zone maps have now been digitalized. A 2006 RAND report (13), based on a random sample study of 100 NFIP communities (out of 20,000), estimates that 49 percent of single family homes in SFHAs purchased insurance, with an important heterogeneity among communities.
iv
See for instance, Michel-Kerjan and Kousky(14) v
We do not know from our dataset whether the policy lapsed because the policyholder terminated it, or moved elsewhere, or changed to a different WYO insurer.
vi
No precise analysis at a national level has been able to measure the real degree of (non)compliance with the flood insurance mandatory requirement. This issue has been the subject of debate for many years, but has not been fully resolved. The situation was best described in a 2002 GAO report: “Property-specific data on mortgages, flood zone determinations, and flood insurance policies—compiled at loan origination and at various points during the life of the loan—would be needed to fully measure compliance. These data are needed to ensure that homeowners purchase, maintain, and do not terminate flood insurance when it is required. Comparing these data would allow the computation of compliance rates nationally, regionally, or locally and would—with an additional piece of data, the mortgage lender identification numbers—identify specific noncomplying lenders. However, there are a number of challenges to obtaining and analyzing these data. These challenges include establishing reporting requirements on lenders to provide relevant mortgage data, determining an appropriate authority to receive and compare these data, and determining the costs and benefits of obtaining these data. The regulators, and GSEs, on the one hand, and FEMA, on the other, have differing viewpoints of the viability of and the need for obtaining these data.”(17). More recently, Dixon et al.(13) find a 20 to 25 percent non-compliance rate across the nation under a set of specific assumptions, but also indicate that the data they were able to collect did not allow for determination of a precise estimate.
vii
We do this so there is no selection bias; for instance, looking at those who experienced a claim in year 5 artificially increases the policy tenure of those in our sample. In a companion paper we provide an advanced econometric analysis not only to test the effect of claim experience, but also how to determine whether the magnitude of claims impacts insurance demand over time (see Kousky, Michel-Kerjan and Raschky(18)).
viii
We would like to thank one of the referees for suggesting this point to us. ix
We appreciate the input from one of the three referees on these aspects. x
This section is partially based on Kunreuther, Meyer and Michel-Kerjan.(22) xi
See these other publications for a more detailed discussion of this concept, potential applications and implementation challenges.
xii
Note here that the annual cost of such a long-term contract might be higher than for the one year contract since the NFIP would have to factor in the uncertainty that exists today about future risks which could change as a result of new developments or a modification of current climate patterns.