Procedia Technology 10 ( 2013 ) 20 – 27
2212-0173 © 2013 The Authors. Published by Elsevier Ltd. Open access under CC BY-NC-ND license.
Selection and peer-review under responsibility of the University of Kalyani, Department of Computer Science & Engineering doi: 10.1016/j.protcy.2013.12.332
International Conference on Computational Intelligence: Modeling, Techniques and Applications
(CIMTA) 2013
An Improved Minimum Redundancy Maximum Relevance
Approach for Feature Selection in Gene Expression Data
Monalisa Mandal∗, Anirban Mukhopadhyay
Department of Computer Science and Engineering, University of Kalyani, Kalyani - 741235, India
Abstract
In this article, an improved feature selection technique has been proposed. Mutual Information is taken as the basic criterion to find the feature relevance and redundancy. The mutual information between a feature and class labels defines the relevance of that feature. Again, the mutual information among different features defines the correlation i.e., the redundancy among those features. Now our objective is to find such a feature set for which the mutual information among the features and the class labels are maximized and the mutual information among the features are minimized. Therefore, the goal of the proposed method is to find the most relevant and least redundant feature set. The number of output features is provided by the user. First the most relevant feature is added to the empty final feature set. Then in each iteration a non-dominated feature set with respect to relevance and redundancy is generated and from this set of features, the most relevant and non-redundant feature is included in the final feature set. Thereafter, in an incremental way a feature is added in every iteration and this step is repeated while the size of the final feature set is equal to the user given number of features. The features contained by the final feature set have maximum relevance and least correlation. The proposed method is applied on microarray gene expression data to find the most relevant and non-redundant genes and the performance of the proposed method is compared with that of the popular mRMR (MIQ) and mRMR (MID) schemes on several real-life data sets.
c
2013 The Authors. Published by Elsevier Ltd.
Selection and peer-review under responsibility of the University of Kalyani, Department of Computer Science & Engineering.
Keywords: Mutual Information, Relevance, Redundancy, Non-dominated Features.
1. Introduction
Data dimensionality reduction [1] is one of the important machine learning tasks while facing data with enormity on size, missing values and noise. Feature selection is one of the ways to reduce the dimensionality of the data. It is an essential step in successful data mining applications, which can efficiently reduce data dimensionality by removing the irrelevant and redundant features from the original data [2,3]. At present there are various kinds of methods to deal with the feature selection problem [4–10].
∗Corresponding author
E-mail address:[email protected]
© 2013 The Authors. Published by Elsevier Ltd. Open access under CC BY-NC-ND license.
Selection and peer-review under responsibility of the University of Kalyani, Department of Computer Science & Engineering
ScienceDirect
The feature selection can be supervised or unsupervised. In a supervised scenario [11], the correct class labels of all samples are additionally known and the feature evaluation criterion is based on the known class labels of the sam-ples. In Unsupervised [12–15] case, the feature selection is performed on the basis of some distribution function or clustering in the absence of class label information. In another context, the feature selection technique can be divided into two categories namely filter-based and wrapper-based. Feature selection methods that make use of a proxy mea-sure to estimate utility are termed ‘filter’ approaches [8,9,16] and feature selection methods that assess feature utility with respect to a given classifier or clustering method, are referred to as ‘wrapper’ [7,11] approaches. Filter-based approaches usually have good generalization properties, but may be less effective at decreasing the dimensionality of the feature space and boosting classification accuracy. Filter-based approaches are computationally cheaper than the wrapper approaches. The real-life data sets frequently contain attributes that are redundant or have a low information content for which the attributes introduce noise and may slow down the classification process gradually. Moreover, they also can introduce high cross-validation errors. Hence selecting the most discriminative attributes [17] may therefore yield significant gains in terms of classification performance.
Whatever the way is, the focus of feature selection should be to select the features that are most relevant to clas-sification while minimizing the redundancy [3]. But in most of the cases, it has been seen that the basic objective of these methods is either relevance or redundancy. Motivated by this fact, we have proposed a method where both relevance and redundancy are taken care of simultaneously. In the proposed method, the problem of feature selection is modeled as a problem of identifying most relevant and nonredundant subset of features [2,3]. Here the relevance of a feature is calculated as the mutual information [18,19] between the feature and the class label vector which is to be maximized. The feature redundancy of a feature is calculated as the mutual information among the feature and other features which is to be minimized. The number of output features is a user input. Let the number of the output features isn. The final solution set is initially empty. At first the most relevant feature is added to the final solution. Then a non-dominated solution set with respect to the two objectives is generated and from this solution set the most relevant and minimum correlated feature is added to the final solution set. Thereafter, this step is repeated until the size of the final solution set becomesn.
The performance of the proposed method has been demonstrated on several real-life microarray gene expression datasets for selecting most relevant and nonredundant genes. Moreover, its performance is compared with that of the well-known minimum Redundancy Maximum Relevance with (MIQ) and (MID) schemes [20] on these datasets.
2. Microarray Gene Expression Data
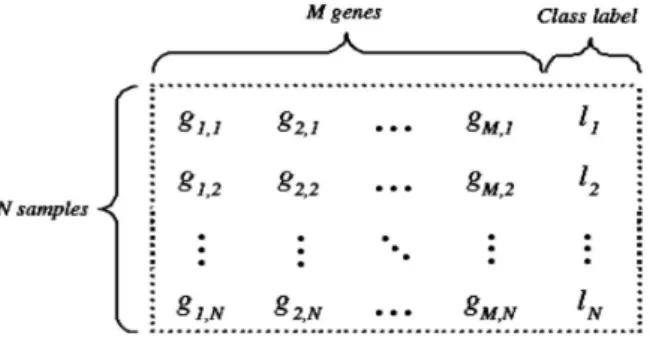
The recent advent of microarray gene expression [21,22] data has made it possible to measure and analysis the high dimensional gene expression data. Moreover it enhances the field of genetic research. In fact, for molecular classification of cancer, microarray gene expression analysis has taken an important role in these days. In raw level, it can be seen as a sample versus gene two dimensional matrix with an additional column representing the corresponding classes of samples. The rows of the microarray data sometimes contain the experimental condition instead of samples. Most of the cases the unrefined data have noise or missing values. Again the enormous size of the dataset increases the difficulty for the researcher. Yet again some genes are not significant to the corresponding class labels and although make the data size bigger. Therefore before applying the microarray data it must be preprocessed with some technique.
3. Mutual Information as relevance and redundancy computation metric
It is very important to find the features which have the maximum information content. With respect to microarray gene expression data, the goal of any relevant gene selection procedure is to identify genes having maximum infor-mation with respect to the class labels of the samples. For identifying these genes, feature entropy is a suitable metric. The initial uncertainty of the output class which is termed as the entropy [18] is defined as in Equation 1:
H(X)=−
Nx
x=1
Fig. 1. An example ofN×Mmicroarray dataset whereNis the number of samples,Mis the number of genes and{li|i=1,2,· · ·,N}is the class
labels.
where{Px(x)|x =1,2,· · ·,Nx}is the probabilities for the different classes, such asPxis the probability density for classx. Then the average uncertainty with respect to the input feature vector calculated as the conditional entropy which is defined as in Equation 2:
H(X|S)= Ns s=1 P(s) Nx x=1 Px(x|s)log(Px(x|s)) . (2)
Here the sis the input feature vector havingNs samples andPx(x|s) is the conditional probability for class xfrom the input vectors. Usually, the conditional entropy will be less than or equal to the initial entropy. If there is total independence between feature and output class then the conditional entropy is equal to the initial entropy. Therefore, the mutual information [18,19] is defined by the quantity of uncertainty reduced. The mutual informationI(X;S) [18,19] between variablesxandscan be defined as:
I(X;S)=H(X)−H(X|S). (3)
The above Equattion 3 can be rewritten as:
I(X;S)=I(S;X)=
x,s
P(x,s)log P(x,s)
P(x)P(s). (4)
As the function of mutual information is symmetric with respect toXandS soI(X;S) is equal toI(S;X).
4. Existing mRMR Technique
In this section the popular minimum redundancy maximum relevance with MIQ and MID scheme [20] is described in detail. The genes with significantly different expressions in two different classes (normal and tumor or two different subtypes of cancer) are called differentially expressed genes [17]. The relevance of a gene is referred as the degree of differentially expression of that gene. The relevance of gene can be calculated by mutual information [18,19]. If the expression of a gene has randomly or uniformly distributed in different classes, its mutual information with these classes is zero. If a gene is strongly differentially expressed for different classes, it should have large mutual information. Here we consider mutual information for discrete variable only. For discrete variables, the mutual informationIof two variablesXandS is defined in Equation 4. The basic concept of minimum redundancy is to select the genes such that they are mutually maximally dissimilar to other genes. Letsdenote the subset of genes that we are seeking. The average minimum redundancy is given as Equation 5:
MinimumW= 1
|s|2
i,j∈s
Algorithm 1Maximum relevance and minimum redundancy feature selection
Input: Discretized datad, classc, number of output featuresn, number of features indisg. Output: Output feature setF.
1: idle f t=[1 :g] 2: for i=1 :gdo 3: relevance(i)=mutual-info(d(:,i),c); 4: end for 5: [R,id]=Max(relevance); 6: F[1]=id; 7: idle f t=idle f t−F; 8: for i=2 :ndo 9: ob j1=relevance(idle f t); 10: for j=1 :|idle f t|do
11: sum=Fk=1(mutual-info(d(:,k),d(:,idle f t)));
12: redun(j)=sum/|F|;
13: end for
14: ob j2=relevance(idle f t)/(redun+0.0001);
15: [newid,ob j2]=Nondominated-FeatureSelection(ob j1,ob j2,idle f t); 16: [R,id]=Max(ob j2);
17: F[i]=id;
18: idle f t=idle f t−F; 19: end for
whereI(i,j) presents the mutual information betweeni-th gene and j-th gene and|s|is the number of genes inS. To select the differentially expressed gene, again the mutual information can be used. The discriminant powers of a genes by the mutual informationI(h,gi) is calculated as Equation 6. That means the mutual information between targeted
classesh = h1,h2,· · ·,hkand the gene expressiongiis the measure of relevance of that gene. Thus the maximum
relevance condition is to maximize the average relevance of all genes insis Equation 6: MaximumV= 1
|s|
i∈s
I(h,i). (6)
Therefore, the redundancy of a gene has to be minimized and relevance of a gene has to be maximized. Two conditions are combined into a single criterion function in mRMR. As two conditions are equally important, then two simplest combined criteria are: Max(V−W), andMax(V/W). Here we describe the mRMR for discrete variable in form of mRMR mutual information difference (mRMR MID) and mRMR mutual information quotient (mRMR MIQ). The mRMR with MID Scheme is formulated as Equation 7 and mRMR with MIQ Scheme is formulated as Equation 8
mRMRMID=maxi∈Ωs[I(i,h)− 1 |s| j∈s I(i,j)], (7) mRMRMIQ=maxi∈Ωs{I(i,h)/[ 1 |s| j∈s I(i,j)]}. (8) 5. Proposed Method
The data matrix has been preprocessed and discretized with respect to the mean of each gene’s expression (column). The number of output features (genes) sayn is provided from outside by the user. The data matrix with classes
c={1,2,· · ·,C}are the inputs. At the beginning, the first objective (obj1) i.e., the relevance of each gene is calculated by mutual information as per Equation 6. From the relevance score, the highest scorer gene id is extracted and added
Algorithm 2Non-dominated Feature Selection
Input: The feature ididle f t, first objectiveob j1, second objectiveob j2,|ob j1|=|ob j2|=|idle f t|. Output: Non-dominated feature ididns, the second objectiveob j2nsof non-dominated features.
1: k=1; 2: for i=1 :|idle f t|do 3: t=0; 4: for j=1 :|idle f t|do 5: if then(i!= j) 6: if then(ob j1(i)≤ob j1(j)&ob j2(i)≤ob j2(j));
7: else if then(ob j1(i)<ob j1(j)&ob j2(i)>ob j2(j)||ob j1(i)>ob j1(j)&ob j2(i)<ob j2(j));
8: else 9: t=1; 10: break; 11: end if 12: end if 13: end for
14: if then(t==0&j==|idle f t|)
15: idns(k)=i;
16: ob j2ns(k)=ob j2(i);
17: k=k+1;
18: end if
19: end for
in the final solution set. Next a looping is performed for the remaining output features. Now the redundancy between the output feature and the remaining features (idle f t) is calculated as per Equation 5. If the output feature set contains more than one feature then the mean is considered as the redundancy score as in Equation 9.
mean-redundancy(i)=
F k=1
(mutual-info[xk,xi]))/|F|), (9)
whereFis output feature set,Xk is output feature vector andxiis theith feature vector. Then the second objective (obj2) is modeled as the ratio of relevance to the redundancy and it is to be maximized. After calculating the two objectives for each feature the non-dominated features are identified. A reference feature is called the non-dominated feature if it satisfies the following conditions: 1) if the obj1 of the reference feature is greater than or equal to all the other futures’ obj1 and the obj2 of the reference feature is greater than or equal to all the other features’ obj2 2) if the obj1 of the reference feature is greater than all the other features’ obj1 and the obj2 of the reference feature is less than all the other features’ obj2 and vice-versa. Afterwards, from the non-dominated features, the feature having maximum obj2 is included in the output feature set. Thus an incremental procedure is adapted for finding the remaining output features. The proposed algorithm is described in Algorithm 1 and the algorithm of ruling features or non-dominated feature selection is illustrated in Algorithm 2.
6. Datasets and Results
Four real life data sets are used for the comparative study. The Overian Cancer dataset and ALL/AML Leukemia dataset are obtained from the website: datam.i2r.a-star.edu.sg/datasets/krbd/, and Prostate Cancer dataset and Child-hood ALL dataset are collected from the website: www.biolab.si/supp/bi-cancer/projections/info/. All the datasets contain two classes of samples.
1. Prostate: Gene expression measurements for samples of prostate tumors and adjacent prostate tissue not contain-ing tumor were used to build this classification model. It contains 50 normal tissue and 52 prostate tumor sample. The expression matrix consists of 12533 numbers of genes and 102 numbers of samples.
Table 1. Performance Analysis among Proposed method, mRMR(MID) and mRMR(MIQ) using different real-life datasets.
Data Set method Sensitivity Specificityy Accuracy Fscore Avg Corr AUC
Proposed 0.98 0.9423 0.9608 0.9608 0.23 0.9892 method Prostate mRMR 0.96 0.9038 0.9314 0.932 0.322 0.9592 Cancer (MID) mRMR 0.978 0.923 0.951 0.9513 0.237 0.983 (MIQ) Proposed 0.9833 0.76 0.8818 0.9 0.443 0.949 method Childhood mRMR 0.8167 0.74 0.7818 0.8033 0.454 0.8497 ALL (MID) mRMR 0.832 0.74 0.7909 0.813 0.457 0.8717 (MIQ) Proposed 1 1 0.998 1 0.442 1 method Overian mRMR 0.9783 1 0.982 0.988 0.515 0.97 Cancer (MID) mRMR 0.989 1 0.986 0.9641 0.4602 0.987 (MIQ) Proposed 1 1 1 1 0.288 1 method ALL/AML mRMR 0.96 0.9787 0.9722 0.96 0.3531 0.99 (MID) mRMR 0.96 1 0.9861 0.9796 0.297 0.989 (MIQ)
2. Child-ALL (GSE412): This data includes genes expression information on 110 childhood acute lymphoblastic leukemia samples. The dataset describes childhood acute lymphoblastic leukemia cells based on changes in gene expression before and after treatment, regardless of the type of treatment used. The dataset has 50 examples of type before therapy and 60 examples of type after therapy. The number of genes is 8280.
3. Ovarian Cancer (NCI PBSII Data): It contains 91 controls (Normal) and 162 ovarian cancers (benign) samples. Therefore, total of 253 samples are there in the dataset. Also the dataset has 15154 genes.
4. ALL/AML Leukemia: This dataset consists of two classes of leukemia (1) Acute Lymphoblastic Leukemia (ALL) (2) Acute Myeloblastic Leukemia (AML). The number genes and samples in the data matrix are 7129 and 72 respectively.
The above described real-life datasets are first normalized with Min-Max normalization technique. Then with respect to the mean of each feature (gene) or column the data is discretized. In this article, the number of output features is taken 100 for all the algorithms. Using 10-fold cross-validation, sensitivity, specificity, accuracy and fscore are computed. Then the average correlation for assessing the redundancy of the selected features is also calculated. Smaller value of correlation indicates that the selected features are less redundant. In addition, the area under ROC curve (AUC) is also reported.
The performance metric values of the proposed method, mRMR(MID) and mRMR(MIQ) on the different real-life datasets are reported in Table 1. It is evident from table that for the prostate cancer dataset the sensitivity, speci-ficity, accuracy, fscore and AUC are 0.98, 0.9423, 0.9608, 0.9608, and 0.9892, respectively which are better than mRMR(MID) and mRMR(MIQ) schemes in every case. Besides this, the average correlation of the proposed method is 0.23 which is less than the other two methods and it indicates that the resultant features given by the proposed method are least correlated.
Secondly, for the childhood ALL dataset, the sensitivity is 0.9833, the specificity is 0.76, the accuracy is 0.8818, the fscore is 0.9 and AUC is 0.949 which are again better than the other two comparative methods in every respect. The average correlation of the proposed method is 0.443 which is less than 0.454 and 0.457 produced by mRMR(MID) and mRMR(MIQ), respectively.
For overian cancer dataset, the table shows that proposed method results [1, 1, 0.998, 1 and 1] as sensitivity, specificity, accuracy, fscore and AUC, respectively. Although, the specificity is same for all the methods but with respect to all other performance metrics our method outperforms the two schemes of mRMR. The average correlation which is the evidence of non-redundancy is 0.442 for the proposed method and is much less than other two methods. Lastly, it is clear from the table that the outcome of the proposed method on ALL/AML dataset is [1, 1, 1, 1 and 1] with respect to sensitivity, specificity, accuracy, fscore and AUC. Therefore, the result is better than [0.96, 0.9787, 0.9722, 0.96 and 0.99] and [0.96, 1, 0.9861, 0.9796 and 0.989] generated by the two schemes of mRMR, respectively. The resultant average correlation of the proposed method is also less than the other two methods. Hence the table clearly demonstrates that the proposed method constantly outperforms the other techniques in all respects.
7. Conclusion
There are different kinds of feature selection methods available in the existing literature. But in most of the cases it has been seen that the basic objective of the method is either relevance or redundancy. In this article, we have proposed a method where both relevance and redundancy are taken care of parallely. For measuring the relevance and redundancy of a feature or gene, the mutual information has been considered. The relevance is defined as mutual in-formation between a feature vector and the class labels. The redundancy is described as the mutual inin-formation among the features. The number of resulting features is provided by the user. The performance of the proposed technique is evaluated based on some real-life microarray gene expression datasets for selecting non-redundant and relevant genes. Moreover the performance of the proposed method is compared with that of very well-known mRMR(MID) and mRMR(MIQ) schemes and the results show that the proposed method outperforms the mRMR schemes for all the datasets.
References
[1] Pena, J.M., Lozano, J.A., Larranaga, P., Inza., I.. Dimensionality reduction in unsupervised learning of conditional gaussian networks. IEEE Transactions on Pattern Analysis and Machine Intelligence 2001;23(6):590–603.
[2] Kurun, O., Akar, C.O., Favorov, O., Aydin, N., Urgen, F.. Using covariates for improving the minimum redundancy maximum relevance feature selection method. Turkish Journal of Electrical Engineering and Computer Sciences 2010;18(6):975–987.
[3] Kamandar, M., Ghassemian, H.. Maximum relevance, minimum redundancy band selection for hyperspectral images. In: 19th Iranian Conference on Electrical Engineering (ICEE),. 2011,.
[4] Dy, J.G., Brodley, C.E., Kak, A., Broderick, L.S., Aisen, A.M.. Unsupervised feature selection applied to content-based retrieval of lung images. IEEE Transaction on Pattern Analysis and Machine Intellegence 2003;25(3):373–378.
[5] Zhang, Z., R.Hancock, E.. A graph-based approach to feature selection. In: International Workshop on Graph-Based Representations in Pattern Recognition. 2011,.
[6] Cai, D., Zhang, C., He, X.. Unsupervised feature selection for multi-cluster data. In: 16th ACM SIGKDD International Conference on Knowledge Discovery and Data mining. 2010,.
[7] Ruiza, R., Riquelmea, J.C., Aguilar-Ruizb, J.S.. Incremental wrapper-based gene selection from microarray data for cancer classification. Pattern Recognition 2006;39(12):2383–2392.
[8] Mitra, P., Murthy, C., Pal, S.K.. Unsupervised feature selection using feature similarity. IEEE Transaction on Pattern Analysis and Machine Intellegence 2002;24(3):301–312.
[9] Sondberg-Madsen, N., Thomsen, C., Pena, J.M.. Unsupervised feature subset selection. In: In Proc. of the Workshop on Probabilistic Graphical Models for Classification. 2003,.
[10] Ding, C.H.Q.. Unsupervised feature selection via two-way ordering in gene expression analysis. Bioinformatics 2003;19(10):1259–1266. [11] Kohavi, R., John., G.. Wrapper for feature subset selection. Artificial Intelligence 1997;97:273–324.
[12] Jiang, S., Wang, L.. An unsupervised feature selection framework based on clustering. In: New Frontiers in Applied Data Mining. 2008,. [13] Morita, M., Oliveira, L.S., Sabourin, R.. Unsupervised feature selection for ensemble of classifiers. In: Frontiers in Handwriting Recognition.
2004,.
[14] Handl, J., Knowles, J.. Feature subset selection in unsupervised learning via multiobjective optimization. International Journal of Computa-tional Intelligence Research 2006;2(3):217–238.
[16] Lee, I.H., Lushington, G.H., Visvanathan, M.. A filter-based feature selection approach for identifying potential biomarkers for lung cancer. Journal of Clinical Bioinformatics 2011;1(11).
[17] Li, J., Tang, X., Zhao, W., Huang, J.. A new framework for identifying differentially expressed genes. Pattern Recognition 2007;40:3249– 3262.
[18] Cover, T.M., Thomas, J.A.. Entropy, relative entropy and mutual information. Elements of Information Theory, John Wiley & Sons 2006;. [19] Battiti, R.. Using mutual information for selecting features in supervised neural net learning. IEEE Transactions on Neural Networks
1994;5(4):537–550.
[20] Ding, C., Peng, H.. Minimum redundancy feature selection for microarray gene expression data. Journal of Bioinformatics ans Computational Biology 2005;3(2):185–205.
[21] Paul, T.K., Iba, H.. Extraction of informative genes from microarray data. In: GECCO ’05 Proceedings of the 2005 conference on Genetic and evolutionary computation. 2005,.
[22] Gordon, G.J., Jensen, R.V., Hsiao, L.L., Gullans, S.R., Blumenstock, J.E., Ramaswamy, S., et al. Translation of microarray data into clinically relevant cancer diagnostic tests using gene expression ratios in lung cancer and mesothelioma. Cancer Research 2002;62:4963–4967.