Stem Cell Reports
Resource
Taming Human Genetic Variability: Transcriptomic Meta-Analysis Guides the
Experimental Design and Interpretation of iPSC-Based Disease Modeling
Pierre-Luc Germain1,*and Giuseppe Testa1,2,*1Department of Experimental Oncology, Istituto Europeo di Oncologia (IEO), Via Adamello 16, 20139 Milan, Italy 2Department of Oncology and Hemato-Oncology, Universita` degli Studi di Milano, Via Santa Sofia 9, 20122 Milan, Italy
*Correspondence:[email protected](P.-L.G.),[email protected](G.T.) http://dx.doi.org/10.1016/j.stemcr.2017.05.012
SUMMARY
Both the promises and pitfalls of the cell reprogramming research platform rest on human genetic variation, making the measurement of its impact one of the most urgent issues in the field. Harnessing large transcriptomics datasets of induced pluripotent stem cells (iPSC), we investigate the implications of this variability for iPSC-based disease modeling. In particular, we show that the widespread use of more than one clone per individual in combination with current analytical practices is detrimental to the robustness of the findings. We then proceed to identify methods to address this challenge and leverage multiple clones per individual. Finally, we evaluate the specificity and sensitivity of different sample sizes and experimental designs, presenting computational tools for power analysis. These findings and tools reframe the nature of replicates used in disease modeling and provide important resources for the design, analysis, and interpreta-tion of iPSC-based studies.
INTRODUCTION
Induced pluripotent stem cells (iPSCs), and more broadly the technologies emerging around cell reprogramming, have developed rapidly and are already transforming biomedical research. The defining, paradigm-shifting innovation of the iPSC-based research platform is the possibility of repeating development, which should be understood not merely as the in vitro reproduction of developmental processes, but as the feat of making it repeatable, i.e., transforming hitherto unique organismal processes—the development of a given individual—into something experimentally and statistically tractable. As such, cell reprogramming has made human genetic variability amenable to experimentation. Indeed, as was emphasized early on (Colman, 2008), a key asset of iPSCs is that, contrary to embryonic stem cells (ESCs), they are associated with medical histories and thus pave the way to what we previously described as the functional annotation of human genomes (Adamo et al., 2015), in terms of genotype-phenotype correlation and disease impact.
Yet at the same time the extent of human variability, of which we are only beginning to take the full measure, poses an important practical problem for the field of iPSC-based modeling. Given background genetic differences between individuals, the key question is which experimental de-signs and degrees of replication are necessary for robust and sensitive results, and what are the best measures to guide their selection. Here, we address such questions by harnessing the large datasets recently made available by the Human Induced Pluripotent Stem Cell Initia-tive (HipSci; Streeter et al., 2016; Kilpinen et al., 2016)
and the National Heart, Lung, Blood Institute (NHLBI) NextGen consortium (Carcamo-Orive et al., 2016). We derive empirically grounded methodological recommenda-tions for the design and analysis of iPSC-based studies.
Given the accessibility of expression profiling and the critical importance of gene expression for the regulation of cellular identity and function, transcriptomic dysregula-tions have emerged for their rapid and informative insight into the molecular underpinning of diseases, representing for many a first high-content in vitro phenotype. This is especially true for many diseases such as neurodevelop-mental disorders, for which the iPSC technology is of prime relevance due to the inaccessibility of the relevant tissues, and whose main disease-associated genes are strongly en-riched for transcription factors and chromatin regulators (De Rubeis et al., 2014). Transcription is therefore of key importance in itself, as well as representing a powerful stand-in for other, more directly functional assays.
RESULTS
Differences between Individuals Dominate the iPSC Transcriptional Variance
In addition to the condition under study, transcriptomes from iPSC lines can vary because of several factors that can coarsely be boxed into genetic, epigenetic, and tech-nical. Although skin biopsies harbor somatic mutations (Young et al., 2012) and a minority of epigenetic marks can be retained upon reprogramming (Kim et al., 2010), the majority of differences between individuals are most likely due to genetic variation. Conversely, while different iPSC clones from the same individual tend to have minor
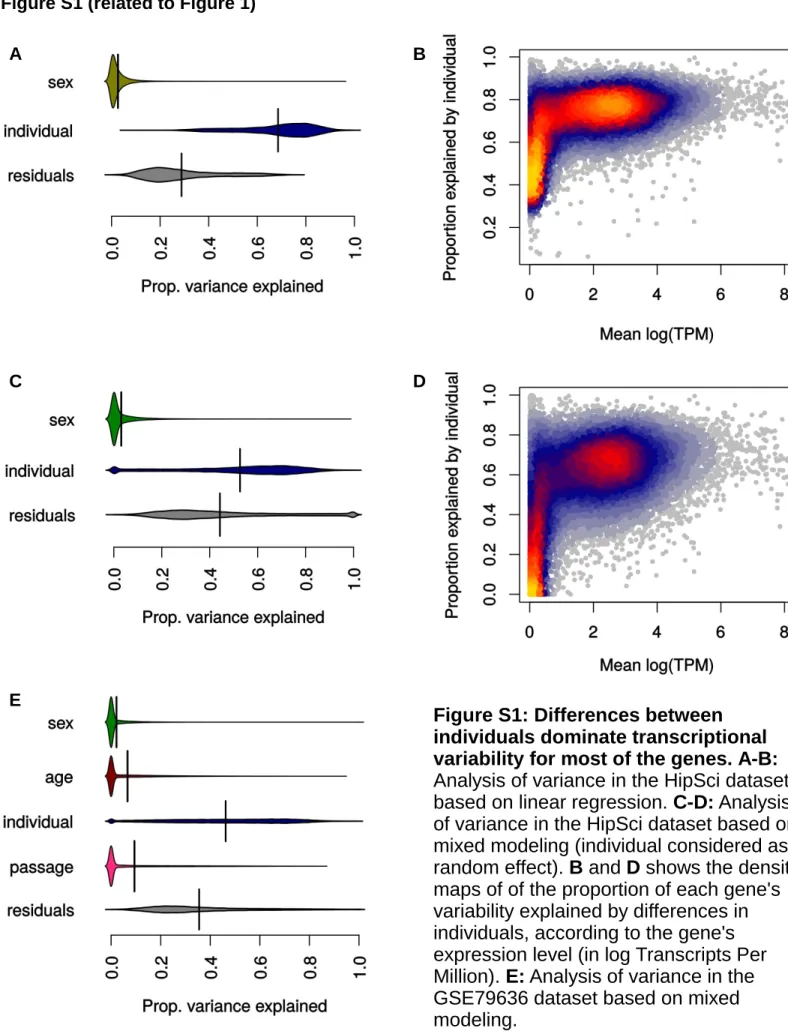
genetic differences chiefly due to mosaicism in the initial sample (Young et al., 2012; Ji et al., 2012) and ensuing se-lection (Kilpinen et al., 2016), most of the variability is likely related to differences in the epigenetic state of the cells (Salomonis et al., 2016). Finally, differences between RNA-sequencing (RNA-seq) libraries of the same clone are most likely to capture essentially technical sources of variation. As previously reported (Kilpinen et al., 2016; Car-camo-Orive et al., 2016), ANOVA reveals that transcrip-tomic variance is dominated by genetic differences, or at any rate differences between donors’ specimens, which holds not only for the whole transcriptome but also for the majority of genes taken individually (Figure S1). The proportion of variance explained by differences between individuals increased with expression levels (Figures S1B and S1D), suggesting that genes not showing high suscep-tibility to genetic differences due to their low expression in iPSC are likely to do so in other tissues.
Spurious Differential Expression Is Exacerbated by Including Multiple iPSC Clones per Individual
Given the very large number of genes showing individual-dependent differential expression, the comparison of
unre-lated individuals—as in the traditional and currently most prevalent design of iPSC-based modeling studies—will inevitably lead to the identification of differentially ex-pressed genes (DEGs) that are only spuriously associated to the comparison of interest. This risk is further com-pounded by the fact that, very often, in-house controls or standard ESC lines are compared with samples received from collaborating centers, introducing a further con-founding factor for the conditions under study.
To assess the risk of such spurious results depending on different experimental designs, we performed a series of per-mutation analyses on both iPSC datasets. We performed more than 15,000 differential expression analyses (DEAs) be-tween random sex-balanced groups of varying sizes and de-signs (illustrated inFigure 1A). In particular, we tested three types of experimental design: (1) comparisons between un-related individuals using a single clone per individual, (2) comparison between unrelated individuals using two clones per individual, and (3) comparison between a group of indi-viduals and different clones from the same indiindi-viduals.
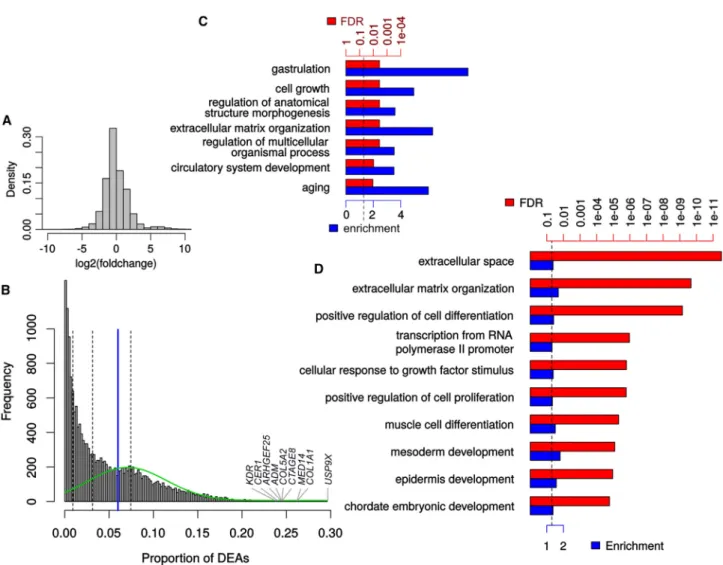
Random comparisons showed a surprisingly high fre-quency of ‘‘spurious’’ differentially expressed genes ( Fig-ures 1B and 1D). In contrast, basic measurements on
Figure 1. Spurious Differential Expres-sion between Groups of Random Individuals
Scheme of the types of permutations (A), below which are shown the corresponding distributions of the number of spurious DEGs in the HipSci (B and C; 500 permuta-tions each) and NHLBI/GSE79636 (D and E; 50 permutations each) datasets. For reasons of visibility, the y axis of (D) is on a log scale. Red bars indicate the mean of each distribution. See alsoFigures S1–S4.
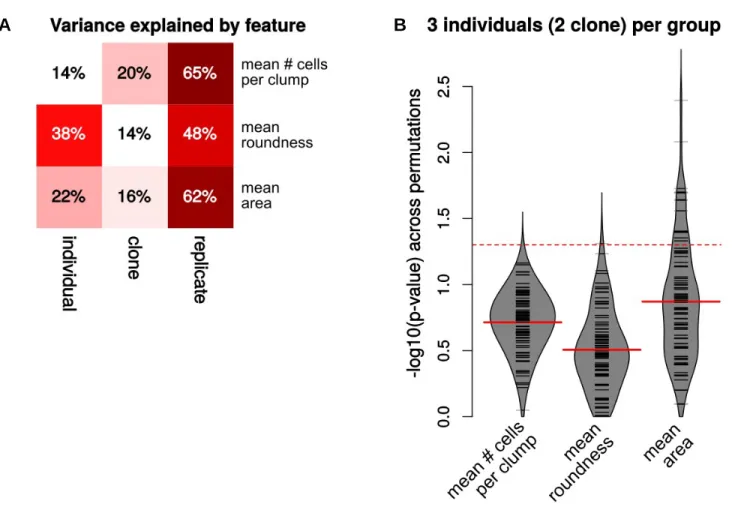
cell morphology, which are available for a small subset of the HipSci samples (28 clones from 14 individuals), did not show such a dominant dependence on genetic differ-ences (Figure S2B), although this can reflect the technical or intrinsic variability of the measurements (Figure S2A). The fact that the comparisons between isogenic clones (Figures 1C and 1E) show very little spurious DEGs even at small sample sizes indicates that the much higher spurious results in the other two comparisons are related to genetic differences. In addition, it warrants the use of controls established by genetic correction of the patient-derived cells when this is cost-effectively commensurate to the specific objective.
Most notably, using more than one iPSC clone per individual results in a major increase in spurious DEGs ( Fig-ures 1B and 1D). Furthermore, and in contrast to comparisons involving single clones which show a clear downward trend upon increasing sample size, such a trend appears absent from the comparisons with two clones per individual. As expected given the much higher genetic het-erogeneity of the NHLBI dataset (Figure S3), the distribu-tion of ‘‘spurious’’ DEGs was considerably higher ( Fig-ure 1D). Nevertheless, we could observe the same pattern as in the HipSci dataset, albeit stronger, when using one versus two clones per individual. Importantly, when manu-ally adding ‘‘true’’ differential expression (see below), using two clones per individual resulted in a dramatic increase of the false discovery rate (FDR) (Figure S4). Together, these re-sults call into question the widespread habit (also en-trenched thus far in the guidelines of this journal) of including more than one iPSC clone per patient.
This finding, however, should not come as a surprise, for the statistical methods commonly used in gene expression analysis assume that replicates are independent. For instance, the edgeR manual recommends summing the read counts of technical replicates before DEA instead of treating them as bona fide replicates. The reason is simple: treating technical replicates as independent artificially re-duces the variability of the group’s mean. The same applies to treating iPSC clones from the same individual as inde-pendent when they are clearly not (at least in terms of the overriding contribution of genetic makeup to the vari-ance under study). While multiple clones per individual improve the internal robustness of the results, their inclu-sion hampers their generalizability to other individuals, unless appropriate methods are employed (see below).
Genes Recurrently Found Differentially Expressed across Random Individuals Are Related to
Fundamental Developmental Processes
Importantly, the spurious DEGs are not limited to modest fold changes, and nearly half (48%) of them change by a fac-tor of more than 2 (Figure 2A), indicating that a simple
fold-change threshold cannot adequately address the problem. Some genes are found differentially expressed in the permu-tation DEAs much more often than others—in fact 98 genes are differentially expressed in more than 20% of the compar-isons (Figure 2B)—which prompted us to investigate the nature of these recurrent DEGs in the HipSci dataset. Surpris-ingly, the top 100 DEGs show very strong enrichment for genes associated with both early developmental processes (nearly 9-fold enrichment for gastrulation-related genes) and aging (6-fold) (Figure 2C). In addition, and as previously reported (Adamo et al., 2015), genes related to the extracel-lular matrix (ECM) organization were also strongly enriched. The same enrichment for ECM-related genes appears in the larger set of all recurrent DEGs (Figure 2D), as well early developmental processes. Since the background used for the enrichment analysis excludes genes that are not ex-pressed in iPSC, we can exclude that these enrichments are merely due to the pluripotent state, and instead must conclude that they reveal instead an unexpected degree of genetic variability in the expression of these genes, possibly linked to an evolutionarily selected increased robustness of the system to their variation. This result is in line with the enrichment, among iPSC-specific expression quantitative trait loci, for targets of pluripotency factors (Kilpinen et al., 2016).
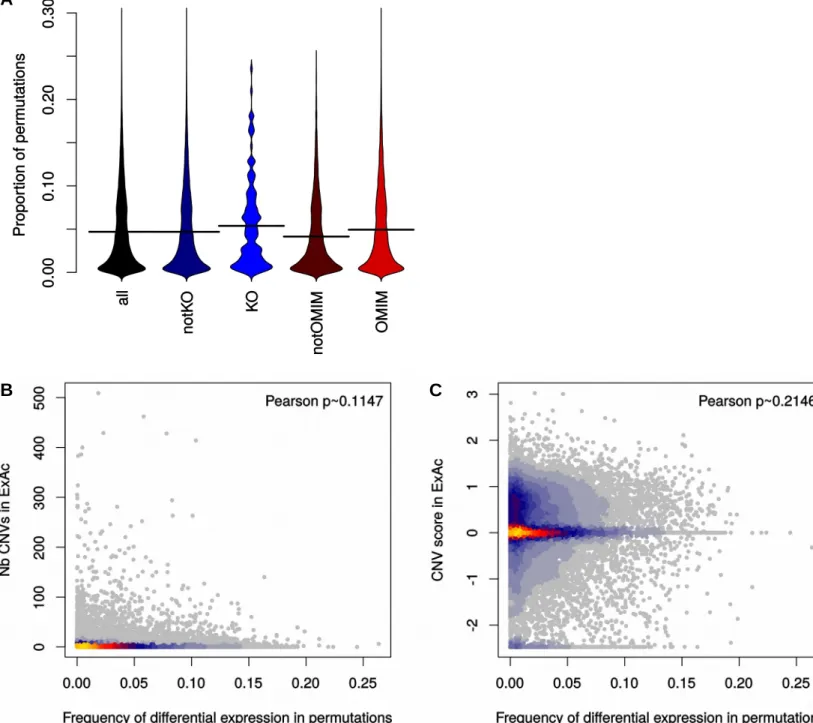
Despite the significance of these enrichments, it would be still theoretically possible that these genes are largely irrelevant to the fully formed organism. To assess this pos-sibility, we tested whether the recurrent DEGs as well as the top 100 recurrent ones were enriched for genes found to be homozygously knocked out in healthy individuals (Sulem et al., 2015), but could find no significant relationship (Figure S5A). Nor was there any significant relationship between the frequency of a gene being differentially ex-pressed across permutations and the prevalence of CNVs affecting that gene in the general population based on Exome Aggregation Consortium (ExAC; Kosmicki et al., 2017) data (Figures S5B and S5C).
Thus, the fact that some genes are recurrently found differ-entially expressed between random individuals does not necessarily mean that they are medically irrelevant. Indeed, pathogenic mechanisms might well be related to similar but subclinical phenotypic variations in healthy individuals. An interesting example is the recent finding that variation in theGTF2Igene, a transcription factor hemizygously deleted in Williams-Beuren syndrome and associated with its socio-cognitive phenotype, is associated with anxiety in the gen-eral population (Jabbi et al., 2015). Therefore, we estimated the likelihood of recurrent genes being disease-significant by looking at their overlap with known disease genes from the database of Online Mendelian Inheritance in Man (OMIM). While OMIM genes were more likely to be differentially expressed between random individuals (p331016by
Mann-Whitney test), the enrichment was very small ( Fig-ure S5A). Together, these results suggest that genes recur-rently found differentially expressed across individuals are neither depleted nor considerably enriched for genes more likely to be medically relevant.
Sensitivity across Experimental Designs and Sample Sizes
We next assayed to what extent different experimental de-signs and sample sizes could detect input differential expres-sion. To this end we repeated the permutation analysis, each time introducing a total of 100 DEGs at five different fold
changes, and distributed across different expression levels (see Experimental Procedures). Notably, the two datasets showed large differences in overall sensitivity (Figures 3
andS6), possibly owing in part to differences in coverage and different degrees of technical standardization.
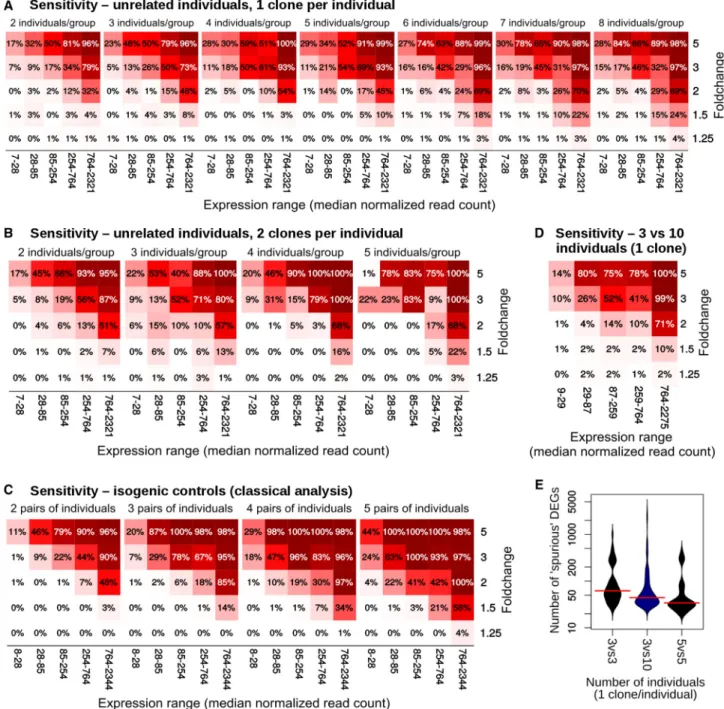
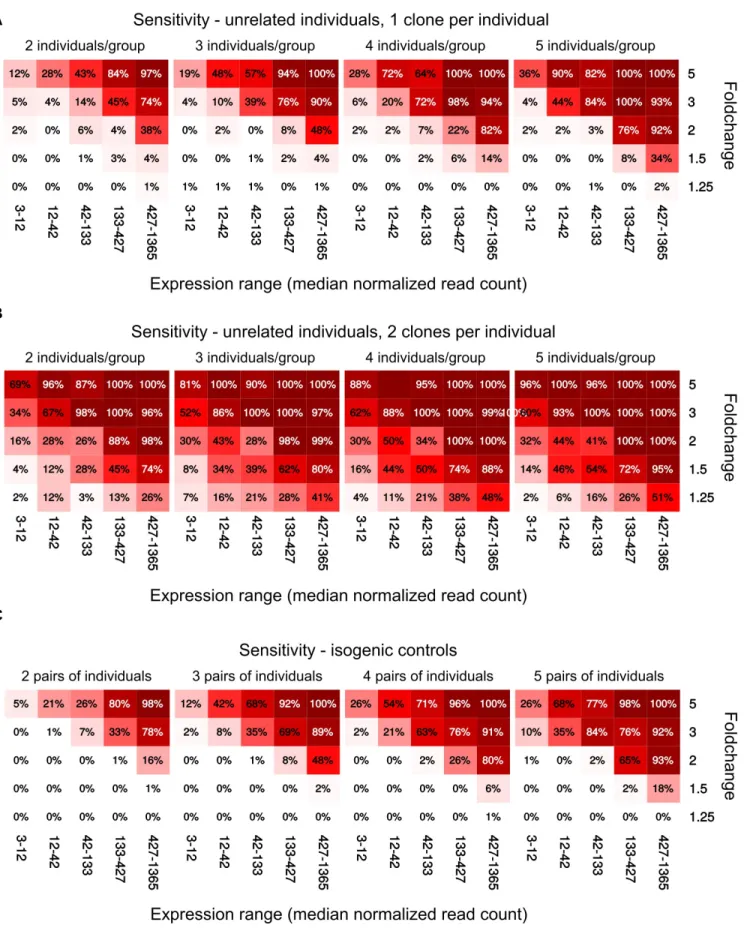
When comparing single clones from unrelated individ-uals, the sensitivity seemed to largely plateau after six indi-viduals per group (Figure 3A). Using two clones per individ-ual resulted in an increase in sensitivity, albeit at the cost of a massive loss in specificity, as shown above (Figures 1and
S4). Isogenic controls also showed a marked improvement in sensitivity in one of the datasets (Figure 3C).
Figure 2. Description of the Genes Recurrently Found Differentially Expressed across iPSC from Groups of Random Individuals
(A) Distribution of fold changes across spurious DEGs of all HipSci permutations.
(B) Distribution of the proportion at which each gene appears differentially expressed. Dashed lines delineate the quartiles while the blue line indicates the threshold for ‘‘recurrent genes.’’ The green line represents the distribution of particularly recurrent genes found by expectation maximization-based mixture modeling.
(C) Most specific enriched gene ontology terms among the top 100 most recurrent genes. FDR, false discovery rate.
(D) Top most specific enriched gene ontology terms among the recurrent genes (>6% chance being found differentially expressed). In (C) and (D) FDR is shown in red and fold enrichment in blue. See alsoFigure S5.
In all cases, the sensitivity was quite good for high fold changes, but rapidly decreased with fold change and read count. Fold changes of 1.5, which are especially relevant in the context of gene duplications, were particularly difficult to detect, and most of them are unlikely to be
detected unless the genes are very stable or highly ex-pressed. This is particularly relevant given the importance of copy-number alterations for a variety of diseases (McCarroll and Altshuler, 2007; Cook and Scherer, 2008; Luo et al., 2012).
Figure 3. Sensitivity of Different Experimental Designs across Fold Change and Expression of the DEGs in the HipSci Dataset
(A–C) Using a single clone per individual (A), using two clones per individual (B), and comparing isogenic clones (C). Each square rep-resents the average across 300 permutations.
(D) Sensitivity when comparing a small cohort with a large set of unrelated controls.
(E) Distribution of false positives when comparing a small cohort with a large set of unrelated controls. See alsoFigure S6.
Finally, since it is relatively common for laboratories specialized in cell reprogramming to have assembled banks of control iPSC lines against which disease-specific lines can be compared, we also evaluated the sensitivity of de-signs comparing only three patient-specific lines with a larger set of controls (n = 10). While such design provided fair sensitivity (Figure 3D), it could not achieve the same degree of spurious DEG minimization as more balanced groups (Figure 3E).
A good experimental design should optimize both sensi-tivity and specificity. While the ideal tradeoff between the two ultimately depends on the context, specificity (type I error) is most often considered at least as important, if not more so, than sensitivity (type II error). Therefore, while using multiple clones per individual increased sensi-tivity (albeit not necessarily more so than using more indi-viduals), it did so at a much larger cost in specificity. This favors increasing the number of individuals instead of the number of clones per individual. Whenever this is not possible, or when the data have already been generated, analysis methods ought to be used that take into account the samples’ interdependence.
Comparison of Methods for Dealing with Multiple Clones
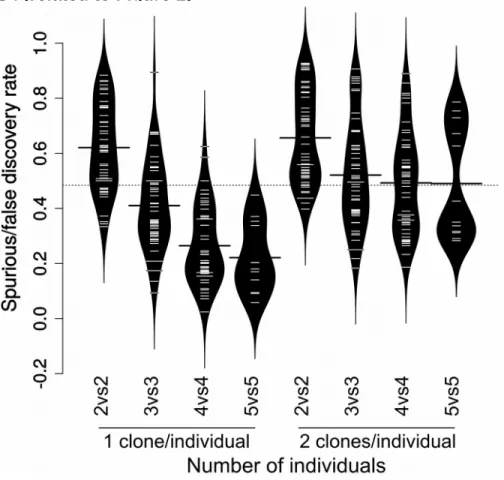
Although multiple iPSC clones per individual cannot be considered full replicates, they nevertheless provide useful information on some aspects of the variability. We therefore tested whether more appropriate statistical methods, in particular approaches based on mixed models and treating the individual as a random-effect variable, could harness the availability of additional clones while keeping good control of false positives. Since such modeling methods are not typically implemented in RNA-seq anal-ysis packages, we tested alternative methods of applying or approximating them in this context (see Experi-mental Procedures), and compared their ability to distin-guish ‘‘true’’ inputted DEGs from ‘‘spurious’’ ones ( Fig-ures 4A and 4B). The first implementation relies on the duplicateCorrelationfunction of the limma R package (Law et al., 2014), which approximates mixed models, in
combi-nation with a voom-based analysis (Ritchie et al., 2015). This was compared with a standard voom-based analysis of one or two clones per individual, as well as to a voom-based analysis previously summing the clones of each indi-vidual (sumReps), as recommended for technical replicates. Finally, we also tried alternative implementations of mixed models, in particular: (1) a glmm-based application of mixed models using the quasi-Poisson distribution (the negative binomial not being implemented in the glmmML package) on normalized counts; (2) a lme4-based applica-tion of mixed models on voom-transformed normalized counts; and (3) a lme4-based application of mixed models on DESeq2’s variance-stabilizing transformation (Love et al., 2014). As expected, using one clone per patient re-sulted in the smallest spurious/FDR at a nominal FDR < 0.05, which was instead very high when using two clones per patient without special treatment. This effect could be mitigated to different extents, and with different impacts on sensitivity, by the different approaches. In particular, limma’sduplicateCorrelationappeared to offer the best per-formance at nominal FDR < 0.05 (Figure 4B) and the best receiver-operating characteristic (ROC) curve at high speci-ficity (Figure 4A), followed by the sum of replicates. While none of these approaches yielded a specificity equivalent to the use of single clones per individual at nominal FDR < 0.05, the last two came very close, enabling a consid-erable gain in sensitivity and having a superior net area un-der the ROC curve, indicating that they are advisable, espe-cially with a slightly more stringent threshold. Indeed, using limma’sduplicateCorrelation approach with an FDR threshold of 0.01 retained much of the increase in sensi-tivity of using two clones with a specificity superior to using a single clone (Figures 4B and 4C). We therefore recommend this approach, i.e., limma’s duplicateCorrelation with a slightly more stringent significance threshold, for analyses of datasets involving more than one clone per individual.
Paired Analysis in the Context of Isogenic Controls Results in Increased False Discoveries
Popular differential expression methods, such as edgeR (Robinson et al., 2010), DESeq2 (Anders and Huber, 2010; Figure 4. Comparison of Analysis Methods
(A and B) Sensitivity and specificity of analysis methods when dealing with multiple clones per patient (three individuals per group). Shown are the averages of 30 permutations for each method. The glmm-based method is not shown in (B) because it led to no positive at this FDR threshold.
(C) Sensitivity when using the dupCor approach and an FDR < 0.01 threshold.
(D–G) Comparison of edgeR’s classic (exact test) and paired analysis (GLM-based) for paired experimental designs. At a q < 0.05 threshold, paired analysis leads to a major increase in ‘‘spurious’’ DEGs (D) for a very modest increase in sensitivity (E), resulting in a massive increase in the FDR (F) but little impact on the ROC curve (G).
(H) Adjusting the FDR of differentially expressed genes on the basis of their frequency in the permutations results in a considerable improvement in the FDR (based on 300 permutations of comparisons between two groups of four individuals, using two clones per individual, HipSci dataset).
Love et al., 2014), and limma/voom (Law et al., 2014; Ritchie et al., 2015), implement generalized linear models to provide the possibility to analyze more complex experi-mental designs than a binary comparison between two groups. In the context of studies involving isogenic or half-matched controls (i.e., unaffected sibling or parent), this permits comparison of each patient-derived line with its matched control and the gauging of consistent relative changes (i.e., background + condition). Such a paired analysis naturally increases sensitivity, but at the cost of increasing the degrees of freedom of the tested model. We therefore compared the sensitivity and occurrence of spurious DEGs in paired versus classical analysis (Figures 4D–4G). Of note, while paired analysis did indeed result in an increase in sensitivity (Figure 4E), it also massively increased the detection of spurious DEGs (Figure 4D), lead-ing to an important net increase in the FDR (Figure 4F). This, however, had no noticeable impact on the ROC curve (Figure 4G), indicating that the paired analysis can be used provided that an accordingly more stringent FDR threshold is adopted.
Knowledge of Variable Genes Can Improve the False Discovery Rate
Since genes are variously likely to be found differentially expressed across random groups of individuals, we assessed whether the knowledge of this probability for each gene could help adjust the FDR of differential expression anal-ysis. Using a very simple approach based on the frequency of the gene and fold change among spurious differential expression across permutations (seeExperimental Proced-ures), we adjusted the nominal FDR of the differential expression analysis on the basis of the results of our permu-tation analysis, which resulted in a considerable
improve-ment of the effective FDR (Figure 4H). This approach thus offers a proof of concept of the utility of such large datasets in the interpretation of iPSC-based studies, paving the way to more complex approaches, for instance involving hy-pothesis weighting or Bayesian updating, which can prob-ably make even greater use of this information on variable genes. This being said, such corrections should be inter-preted with care given that, as emphasized earlier, it could well be that genes whose expression is highly variable in the general population are nevertheless associated with the conditions under study or related subclinical traits.
A Considerable Proportion of Published iPSC-Based Disease-Modeling Studies Has Insufficient Precision
To assess the impact of our observations for the iPSC modeling field, we sampled the most recent iPSC disease-modeling literature, selecting 77 studies published in 2016 (see Experimental Procedures and Table S1). The vast majority (79%) of the studies relied on unrelated con-trols, with 10% using a combination of unrelated and half-matched controls and 10% using isogenic controls. The distribution of the total number of individuals (all con-ditions pooled) from which the iPSC lines were derived and the total number of iPSC clones used are plotted inFigures 5A and 5B. Importantly, 41% of the studies used more than one clone per individual (the proportion increases to 51% in studies involving at least six individuals in total) without adopting appropriate statistical methods, which as we have shown can artificially inflate significance and lead to many false positives.
As an example, we took two studies focusing on the tran-scriptome as relevant endophenotype and that reported lists of DEGs (several studies involving transcriptomics did not report such a list, and some did not even make
Figure 5. Survey of the 2016 iPSC Dis-ease-Modeling Studies
(A) Total number of individuals (all condi-tions pooled) from which the studied iPSC lines were derived.
(B) Total number of iPSC clones studied (all conditions pooled). The dashed lines in (A) and (B) indicate the median and the solid lines indicate the mean.
(C) Distribution of the probability of genes to be found differentially expressed in random permutations, comparing all genes (left) with the DEGs of two sample iPSC-based studies from our survey (right). The red line indicates the mean and the blue line indicates the median. The p values were calculated from a Mann-Whitney test comparing the distributions.
the data available). The first (PubMed ID 27846841) involved a rather large number of individuals per group (eight versus seven), while the second (PubMed ID 27662211) included a fairly small number of individuals (three per group). Despite the difference in cell type, the genes reported as differentially expressed by these studies had a significantly higher probability of being differentially expressed in our random permutations (Figure 5C), partic-ularly for the study involving a small sample size, which questions the specificity of at least a subset of these genes for the disease under study.
This being said, it must be emphasized that many of the studies reviewed were not exclusively based on (and in some cases not even involving) transcriptional pheno-types. In light of some of the results described here ( Fig-ure S2) as well as evolutionary considerations, it is possible that lower-content assays measuring, for instance, cellular phenotypes could show a lower rate of spurious results due to genetic differences. Moreover, the combination of independent lines of evidence can often strengthen results obtained from weak (from an intrinsic statistical point of view) studies. Nevertheless, the present results indi-cate that a considerable proportion of iPSC-based disease-modeling studies, especially when based on next-genera-tion sequencing experiments, may present a high rate of false positives and (unless one focuses on very highly ex-pressed genes and/or fairly large fold changes, i.e., >2) be underpowered.
An R Package to Estimate the Power of iPSC Study Designs
Lastly, we provide the R packageiPSCpoweR, available on gi-thub, to reproduce all of the analyses performed in the pre-sent study (including multi-threaded DEA permutations, plots, etc.) and conduct further power analysis. We hope that this resource can help scientists in the field to make more informed decisions regarding the design of future iPSC-based studies.
DISCUSSION
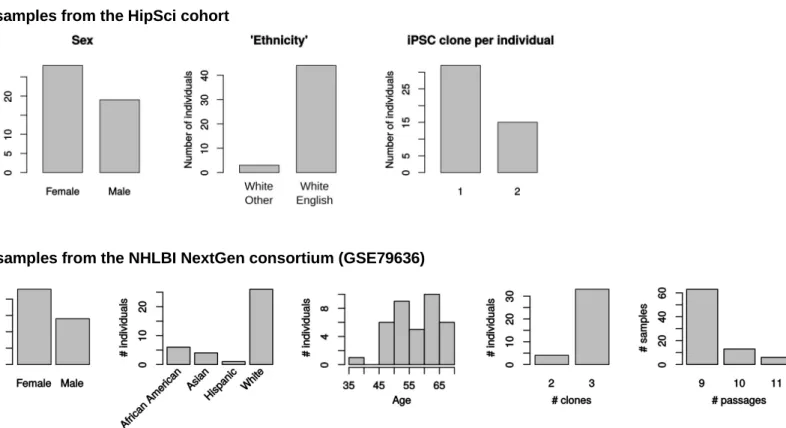
The predominance of inter-individual differences in explaining transcriptional variability has already been reported (Rouhani et al., 2014; Burrows et al., 2016; Carcamo-Orive et al., 2016). These datasets are likely to un-derestimate human genetic variability due to the popula-tions sampled (Figure S3); in particular, all individuals from which the HipSci lines used were derived are described by the consortium as ‘‘white,’’ and most of them are labeled as being of English origin. The predomi-nance of inter-individual differences is in line with the surprising degree of genetic variation in human gene
expression regulation (Kasowski et al., 2013; Mele´ et al., 2015; Barrera et al., 2016). Indeed, Barrera et al. (2016)
showed that the median human genome harbors 60 het-erozygous and 20 homozygous missense SNPs that change the amino acid sequence of transcription factor (TF) DNA binding domains, resulting in changes in affinity and/or specificity in at least 75% of the cases. Together with varia-tions in TF target sites and other changes affecting DNA conformation, these can lead to wide differences in gene expression.
While the present results were obtained from the tran-scriptome of pluripotent cells, the impact is unlikely to be smaller in differentiated cell types. Indeed, Banovich et al. (2016) recently reported that regulatory variation between individuals is lower in iPSCs than in two differen-tiated cell types. Furthermore, given the difficulty in ob-taining samples from patients harboring rare mutations, it is not uncommon for probands’ and control lines to have different origins, and hence potentially confounding background genomic differences. It is therefore likely that the ‘‘spurious’’ differences observed here in the permuta-tion DEAs are relatively conservative estimates. On the other hand, while the present study aimed at measuring the impact of spurious differential expression, it is possible that spurious differences passing multiple testing correc-tion in this context, namely with little real differences be-tween groups, might not necessarily pass it if the two groups show overriding transcriptional differences related to the condition of interest. This is due to the fact that popular correction methods (e.g., Benjamini-Hochberg) are rank based; hence the larger the transcriptional effect of the studied condition, the smaller the number of spurious DEGs will be. Finally, for specific cellular or func-tional assays with a proven more direct relationship to the ultimate traits under fitness selection, it is plausible that compared with transcription they are more robust and less influenced by genetic variation.
A key observation of the present study is that, contrary to a widespread practice, using multiple clones per individual can be very detrimental to the robustness of the study unless appropriate statistical methods are adopted. This represents a critical warning for the iPSC modeling field, since most leading studies, including our own work (Adamo et al., 2015), in a large number of publications have embraced the thus far current standard of including multiple clones per individual without accounting for their interdepen-dence in the statistical analysis. One way of doing so, harnessing the additional power of multiple clones while keeping a good control of false positives, was through the combination of thevoomandduplicateCorrelationfunctions implemented in the limma package (Law et al., 2014; Ritchie et al., 2015) used with a slightly more stringent significance threshold (here FDR < 0.01). This approach dramatically
reduces the rate of false or spurious discovery, making the design equivalent to an isogenic experimental design, albeit with a much larger total number of clones profiled.
On the basis of our results (summarized inFigure 6), we propose the following recommendations. Isogenic controls corrected for the mutation, which we modeled here using different clones from the same individual, represent an ideal albeit cost- and time-intensive experimental design. Using two clones per individual with the aforemen-tioned mixed-models approach offered a comparable per-formance. In both these cases, using at least three individ-uals per group (ideally four or more) offered a decent control of false positives, with additional individuals offer-ing increases in sensitivity. When soffer-ingle clones from unrelated individuals are used, a strict minimum of four individuals per group should be used. In general (and to the extent that such comparisons were made possible by the current datasets), more than six to seven individuals per group offered only marginal improvements. Finally, the use of multiple clones per individual without adequate statistical treatment of their interdependence is strongly
discouraged. Just like technical replicates, different clones from the same individuals capture only a portion of the biological variability, and treating them as statistically in-dependent artificially reduces the variability of the group’s mean.
Part of the problem therefore lies in deep ambiguities regarding the meaning of technical and biological replicates. Indeed, whether a replicate is biological or technical has become an increasingly vague notion that thrives in the di-versity of possible answers, and partly for good reasons: there are not two but diverse possible degrees of replication, each capturing different layers of variability. Moreover, as biolog-ical processes have gradually been mastered in the labora-tory, they have increasingly ceased to be in themselves ob-jects of investigation and have joined the scientist’s toolkit, so that in many contexts biological processes have become purely technical operations. In the language of the historian of science Hans-Jo¨rg Rheinberger, they went from ‘‘epistemic things’’ to ‘‘technical objects’’ (Rheinberger, 1997). It might therefore be useful to replace the distinction between tech-nical and biological replicates for one inspired by these categories. In this view, technical replicates are replicates capturing the variability of (all or some of) the processes throughwhich we study a phenomenon, whereas epistemic replicates capture, in addition to this technical variability, the variability in the phenomenon itself under study. The concepts are therefore relative to the questions being asked. Insofar as the aim of a study is to uncover disease-relevant ef-fects of, say, a pathogenic mutation or copy-number alter-ation, epistemic replicates should capture the variability of the patients harboring the disease, and hence iPSC clones represent technical replicates. If, instead, the aim is to learn about the effects a given genetic lesion against a specific back-ground genome, or about the impact of reprogramming-induced changes on the expressivity of that lesion, iPSC clones represent epistemic replicates.
More clarity in choosing and reporting the type and degree of replication would greatly help to improve the robustness of findings in iPSC-based studies.
EXPERIMENTAL PROCEDURES
Samples Used
The description of the HipSci samples used can be obtained using the getSamplesInfo function of the package. A summary of the samples is shown inFigure S3, and the SRA-run IDs are listed in Table S2. All the samples not cultivated on feeders, not associated to a disease, and available on open access at the time of this study were used (a total of 62 lines from 47 individuals, including 15 in-dividuals with two clones).
From the NHLBI NextGen consortium dataset, we included only lines that have been reprogrammed from the same type of cells (Erythroblasts) using the same rna method (Life-Tech GITC) and Figure 6. Summary of the Precision and Sensitivity of the Main
Experimental and Computational Designs
The numbers in the data points represent the number of individuals per group. Triangles indicate isogenic lines, squares indicate unrelated individuals with one clone per individual, and circles indicate unrelated individuals with two clones per individual, with standard (green) or mixed-models (pink) analysis (through limma’s
duplicateCorrelation). With a standard analysis, using two clones
per individual has a catastrophic impact on the FDR. Using mixed models, however, dramatically improves the FDR, making the design equivalent (albeit with a much larger total number of clones profiled) to an isogenic experimental design.
cultured in the same Matrigel preparation (a total of 107 lines from 37 individuals were used). These are listed inTable S2, and are available (both counts and annotation) in the R package (data(‘‘GSE79636’’)).
RNA-Seq Quantification
For the HipSci data, RNA-seq quantification was performed using Salmon v6.1 (Patro et al., 2016), using FMD indexes and the Refseq transcript annotation. The expression matrix is available through thegetTxExprandgetGeneExprfunctions of the package. For all analyses, the TMM normalization was used (Robinson and Oshlack, 2010). For the NHLBI NextGen data, we used the quantification made available by the authors on the GEO (GEO: GSE79636).
ANOVA
The analysis of transcriptional variance (Figure S1) was performed on log-transformed transcripts per million (TPM) values aggre-gated at the gene level. Both linear models (Figures S1A and S1B) and mixed random-effect models implemented by thelme4 R package (Figures S1C–S1E) were used. The analysis can be repro-duced using thetranscriptionalVarianceExplained function of the package.
For the ANOVA in cell morphology, we used only the data collected on the middle concentration of fibronectin. The data can be accessed from the cellpheno data object of the package, and the ANOVA can be reproduced using the cellphenoVarianceExplainedfunction.
Differential Expression Analysis
With the exception of the mixed-models approaches (Figures 4A, 4B, and 6), all differential expression analysis was performed with edgeR v.3.12.1, which has among the most robust perfor-mances (Germain et al., 2016). For testing, only genes for which at least two samples had more than ten reads were considered. For the paired analysis, generalized linear models and the likeli-hood-ratio test was used; otherwise the exact test was used. See theedgeRwrapperfunction for the exact code.
In the comparison of approaches to dealing with multiple clones per individual (Figures 4A and 4B, pink data points in Figure 6), we used limma v.3.28.5. The dupCor method, as implemented in the voomWrapper function of the iPSCpoweR package, uses a two-step voom transformation (before calling duplicateCorrelation, and after, including the output of the function). The SumReps method simply sums, for each indi-vidual, the read counts of all clones, and is implemented in the voomWrapperSumRepsfunction. The lmer- and glmm-based methods are respectively implemented in thevoomLmerWrapper, vstLmerWrapper, andglmmWrapperfunctions, and use the individ-ual as a random-effect variable (i.e.,1 + [1jindividual] + group). The lmer-based methods rely on thedrop1approach with a chi-squared test for statistical significance.
Input/‘‘True’’ Differential Expression
To assess sensitivity, we introduced differences between the groups by enabling theaddDEoption of the package’s permutation func-tions, with default settings. The differences are introduced
multi-plying a gene’s read count, in each sample of one of the groups, by a predefined fold change. For each fold change (1.25, 1.5, 2, 3, 5, and their inverse), ten genes were randomly selected spanning the range of expression levels of the tested transcriptome, for a total of 100 introduced DEGs in each analysis. Importantly, this is making the assumption that, all other things being equal, ‘‘real’’ differentially expressed genes have an intra-group variability comparable with other genes.
Permutation Analysis
Permutation DEA analyses were performed using the DEA.permutateIndividuals and DEA.permutateClones functions of the package, using the default setting except for the addition of the expression filter (at least two samples having more than ten reads). Permutations that were not balanced for sex were discarded. For the NHLBI dataset, we instead ensured that the comparisons were balanced for technical batches. For comparisons involving 12 or fewer total individuals, only the individuals with more than one available iPSC clone were used in order to maximize the comparability with other experimental designs. For compari-sons involving more than 12 individuals in total it was, however, necessary to use the whole cohort of samples to have a sufficient number of valid comparisons.
The permutation analysis of cellular morphology (Figure S2) can be reproduced with thecellpheno.permutateIndividualsfunction.
Data-Informed Correction of the Q Values
ForFigure 4H, the nominal FDR values reported by edgeR were cor-rected using themultiProbSpuriousfunction of the package. The function reports, for each tested gene, the frequency of the gene’s absolute fold change or higher in the distribution of fold changes of the spurious DEG, as well as the frequency at which the given gene was found differentially expressed, in the union of all permu-tations of the HipSci dataset. For genes whose fold change was plausible in the distribution of spurious fold changes (p > 0.05), we then replaced edgeR’s FDR by the frequency of the given gene in the permutations, if greater.
Gene Ontology Enrichment Analysis
Gene Ontology enrichment analyses were performed using the goseq R package (Young et al., 2010) against the background of tested genes (passing the filter of >10 reads in >2 samples), correct-ing for eventual RNA-seq transcript length bias, and excludcorrect-ing genes without annotation. Categories with at least ten genes and maximum 1,000 genes were considered. To increase the informa-tiveness of the terms, we removed terms with significantly en-riched children terms.
Selection of iPSC-Based Disease-Modeling Studies
For the brief review of experimental designs used in recent iPSC disease-modeling studies, a PubMed search for ‘‘Induced pluripo-tent stem cells’’ OR ‘‘iPSC’’ was performed and publications pub-lished in 2016 were considered. Only studies performing human iPSC-based modeling of specific diseases were considered (reviews, studies involving therapeutic application of iPSC derivatives; using direct conversion or reporting the development/improvement of technologies were discarded), and reports of the mere generation
of single lines were discarded. For a large number of studies, the number of individuals/lines had to be inferred from the figures (lines were considered if at least some of the assays were performed on them beyond the validation of their pluripotency). Of the 81 publications meeting these criteria (see Table S1), three were excluded as not indicating the number of lines involved and four more were considered ambiguous in this respect, so that 74 studies were finally used to compile the number of clones/individuals (see Table S1).
SUPPLEMENTAL INFORMATION
Supplemental Information includes six figures and two tables and can be found with this article online athttp://dx.doi.org/10.1016/ j.stemcr.2017.05.012.
AUTHOR CONTRIBUTIONS
P.L.G. and G.T. conceived and designed the study; P.L.G. per-formed the analyses and made the figures; and P.L.G. and G.T. wrote the paper.
ACKNOWLEDGMENTS
This work was supported by the European Research Council (ERC) grant DISEASEAVATARS 616441 (G.T.); the Telethon Foundation (grant GGP14265 to G.T.); the Italian Association for Cancer Research (AIRC) (IG grant to G.T.); the Umberto Veronesi Founda-tion (P.L.G.); the ERANET-Neuron grant from the Italian Ministry of Health (P.L.G.); The Italian Ministry of Health (Ricerca Corrente grant to G.T.); and the Regione Lombardia (grant Ricerca Indipen-dente 2012) (G.T.). Received: March 29, 2017 Revised: May 10, 2017 Accepted: May 11, 2017 Published: June 6, 2017 REFERENCES
Adamo, A., Atashpaz, S., Germain, P., Zanella, M., D’Agostino, G., Albertin, V., and Testa, G. (2015). 7q11.23 dosage-dependent dys-regulation in human pluripotent stem cells affects transcriptional programs in disease-relevant lineages. Nat. Genet.47, 132–141. Anders, S., and Huber, W. (2010). Differential expression analysis for sequence count data. Genome Biol.11, R106.
Banovich, N.E., Li, Y.I., Raj, A., Ward, M.C., Greenside, P., Cal-deron, D., Gilad, Y. (2016). Impact of regulatory variation across human iPSCs and differentiated cells.http://dx.doi.org/10.1101/ 091660.
Barrera, L.A., Vedenko, A., Kurland, J.V., Rogers, J.M., Gisselbrecht, S.S., Rossin, E.J., and Bulyk, M.L. (2016). Survey of variation in hu-man transcription factors reveals prevalent DNA binding changes. Science351, 1450–1454.
Burrows, C.K., Banovich, N.E., Pavlovic, B.J., Patterson, K., Gallego Romero, I., Pritchard, J.K., and Gilad, Y. (2016). Genetic variation, not cell type of origin, underlies the majority of identifiable regu-latory differences in iPSCs. PLoS Genet.12, 1–18.
Carcamo-Orive, I., Hoffman, G.E., Cundiff, P., Beckmann, N.D., D’Souza, S.L., Knowles, J.W., and Lemischka, I. (2016). Analysis of transcriptional variability in a large human iPSC library reveals genetic and non-genetic determinants of heterogeneity. Cell Stem Cell20, 518–532.
Colman, A. (2008). Induced pluripotent stem cells and human dis-ease. Cell Stem Cell3, 236–237.
Cook, E.H., Jr., and Scherer, S.W. (2008). Copy-number varia-tions associated with neuropsychiatric condivaria-tions. Nature 455, 919–923.
De Rubeis, S., He, X., Goldberg, A.P., Poultney, C.S., Samocha, K., Ercument Cicek, A., and Buxbaum, J.D. (2014). Synaptic, tran-scriptional and chromatin genes disrupted in autism. Nature
515, 209–215.
Germain, P.L., Vitriolo, A., Adamo, A., Laise, P., Das, V., and Testa, G. (2016). RNAontheBENCH: computational and empirical re-sources for benchmarking RNAseq quantification and differential expression methods. Nucleic Acids Res.44, 5054–5067.
Jabbi, M., Chen, Q., Turner, N., Kohn, P., White, M., Kippenhan, J.S., and Berman, K.F. (2015). Variation in the Williams syndrome GTF2I gene and anxiety proneness interactively affect prefrontal cortical response to aversive stimuli. Transl. Psychiatry5, e622. Ji, J., Ng, S.H., Sharma, V., Neculai, D., Hussein, S., Sam, M., and Ba-tada, N.N. (2012). Elevated coding mutation rate during the re-programming of human somatic cells into induced pluripotent stem cells. Stem Cells30, 435–440.
Kasowski, M., Kyriazopoulou-panagiotopoulou, S., Grubert, F., Zaugg, J.B., Kundaje, A., Liu, Y., and Snyder, M. (2013). Exten-sive variation in chromatin states across humans. Science342, 750–752.
Kilpinen, H., Goncalves, A., Leha, A., Afzal, V., Danecek, P., Faul-conbridge, A., and Kolb-Kokocinski, A. (2016). Common genetic variation drives molecular heterogeneity in human iPSCs. bioRxiv http://dx.doi.org/10.1101/055160.
Kim, K., Doi, A., Wen, B., Ng, K., Zhao, R., Cahan, P., and Daley, G.Q. (2010). Epigenetic memory in induced pluripotent stem cells. Nature467, 285–290.
Kosmicki, J.A., Samocha, K.E., Howrigan, D.P., and Sanders, S.J. (2017). Refining the role of de novo protein-truncating variants in neurodevelopmental disorders by using population reference samples. Nat. Genet.49, 504–510.
Law, C.W., Chen, Y., Shi, W., and Smyth, G.K. (2014). voom: Preci-sion weights unlock linear model analysis tools for RNA-seq read counts. Genome Biol.15, R29.
Love, M.I., Huber, W., and Anders, S. (2014). Moderated estimation of fold change and dispersion for RNA-seq data with DESeq2. Genome Biol.15, 1–34.
Luo, R., Sanders, S., Tian, Y., and Voineagu, I. (2012). Genome-wide transcriptome profiling reveals the functional impact of rare de novo and recurrent CNVs in autism spectrum disorders. Am. J. Hum. Genet.91, 38–55.
McCarroll, S.A., and Altshuler, D.M. (2007). Copy-number varia-tion and associavaria-tion studies of human disease. Nat. Genet. 39, S37–S42.
Mele´, M., Ferreira, P.G., Reverter, F., DeLuca, D.S., Monlong, J., Sammeth, M., Young, T.R., Goldmann, J.M., Pervouchine, D.D., and Sullivan, T.J. (2015). The human transcriptome across tissues and individuals. Science348, 660–665.
Patro, R., Duggal, G., Love, M.I., Irizarry, R.A., and Kingsford, C. (2016). Salmon provides accurate, fast, and bias-aware transcript expression estimates using dual-phase inference. bioRxivhttp:// dx.doi.org/10.1101/021592.
Rheinberger, H.J. (1997). Toward a History of Epistemic Things: Synthesizing Proteins in the Test Tube (Stanford University Press). Ritchie, M.E., Phipson, B., Wu, D., Hu, Y., Law, C.W., Shi, W., and Smyth, G.K. (2015). Limma powers differential expression ana-lyses for RNA-sequencing and microarray studies. Nucleic Acids Res.43, e47.
Robinson, M.D., and Oshlack, A. (2010). A scaling normalization method for differential expression analysis of RNA-seq data. Genome Biol.11, R25.
Robinson, M.D., McCarthy, D.J., and Smyth, G.K. (2010). edgeR: a Bioconductor package for differential expression analysis of digital gene expression data. Bioinformatics26, 139–140.
Rouhani, F., Kumasaka, N., de Brito, M.C., Bradley, A., Vallier, L., and Gaffney, D. (2014). Genetic background drives transcriptional
variation in human induced pluripotent stem cells. PLoS Genet.
10, e1004432.
Salomonis, N., Dexheimer, P.J., Omberg, L., Schroll, R., Bush, S., Huo, J., and Lutzko, C. (2016). Integrated genomic analysis of diverse induced pluripotent stem cells from the progenitor cell biology consortium. Stem Cell Rep.7, 110–125.
Streeter, I., Harrison, P.W., Faulconbridge, A., The HipSci Con-sortium, Flicek, P., Parkinson, H., and Clarke, L. (2016). The hu-man-induced pluripotent stem cell initiative-data resources for cellular genetics. Nucleic Acids Res.45, D691–D697.
Sulem, P., Helgason, H., Oddson, A., Stefansson, H., Gudjonsson, S.A., Zink, F., and Stefansson, K. (2015). Identification of a large set of rare complete human knockouts. Nat. Genet. 47, 448–452.
Young, M.D., Wakefield, M.J., Smyth, G.K., and Oshlack, A. (2010). Gene ontology analysis for RNA-seq: accounting for selection bias. Genome Biol.11, R14.
Young, M.A., Larson, D.E., Sun, C.-W., George, D.R., Ding, L., Miller, C.A., and Ley, T.J. (2012). Background mutations in parental cells account for most of the genetic heterogeneity of induced pluripotent stem cells. Cell Stem Cell10, 570–582.