1
Aude Kienzler, Marlies Halder, Andrew Worth
Scientific options for avoiding chronic
fish testing on the basis of existing
data and extrapolation approaches
2016
This publication is a Technical report by the Joint Research Centre, the European Commission’s in-house science service. It aims to provide evidence-based scientific support to the European policy-making process. The scientific output expressed does not imply a policy position of the European Commission. Neither the European
Commission nor any person acting on behalf of the Commission is responsible for the use which might be made of this publication.
Contact information
European Union Reference Laboratory for Alternatives to Animal Testing Address: Joint Research Centre, Via Enrico Fermi 2749, 21027 Ispra (VA), Italy E-mail: [email protected] JRC Science Hub https://ec.europa.eu/jrc JRC101327 EUR 27907 ISBN 978-92-79-58167-0 (PDF) ISSN 1831-9424 (online) doi:10.2788/546221 (online) © European Union, 2016
Reproduction is authorised provided the source is acknowledged.
All images © European Union 2016 cover photo of fish ©edumansur and molecule © 123dartist.
How to cite: Kienzler Aude, Halder Marlies, Worth Andrew; Scientific options for avoiding chronic fish testing on the basis of existing data and extrapolation approaches; EUR 27907; doi:10.2788/546221
1
Table of contents
Abstract ... 3
1. Introduction ... 4
2. Regulatory and scientific background ... 6
2.1. REACH requirements and guidance on aquatic toxicity testing ... 6
2.2. Scientific background ... 7
2.2.1. Importance of Mode of Action and mechanistic understanding in environmental risk assessment ... 7
2.2.2. Mode of Action, QSARs and grouping of chemicals ... 7
3. Methodology ... 9
3.1. Extraction of data ... 9
3.1.1. Databases ... 9
3.1.2. Species... 9
3.1.3. Endpoint and duration of exposure ... 9
3.1.4. Quality check ... 9
3.2. Treatment of data prior to analysis ... 9
3.2.1. Lowest value and geometric mean approaches ... 9
3.2.2. Assignment of Modes of Action ... 10
3.3. Analysis ... 10
4. Results and discussion ... 11
4.1. Interspecies extrapolation (quantitative activity-activity relationships) ... 11
4.1.1. Daphnid to chronic fish relationships – irrespective of the MOA ... 11
4.1.1.1. Relationships ... 11
4.1.1.2. Discussion of outliers ... 13
4.1.1.3. Interspecies sensitivity ratio ... 14
4.1.2. Daphnid to chronic fish relationships by MOA ... 18
4.1.2.1. Relationships ... 18
4.1.2.2. Outliers ... 20
4.1.2.3. Sensitivity ratios ... 21
4.2. Acute to chronic fish data ... 21
4.2.1. Acute to chronic fish relationships – irrespective of the MOA ... 21
4.2.1.1. Relationships ... 21
4.2.1.2. Discussion of outliers ... 23
4.2.1.3. Acute to chronic ratio ... 23
4.2.2. Acute to chronic fish relationship by MOA ... 28
4.2.2.1. Relationships ... 28
4.2.2.2. Discussion of outliers ... 28
2
5. Conclusions and recommendations ... 31
References ... 33
List of abbreviations and definitions ... 38
List of figures ... 39
List of tables ... 40
Appendix I. Examples of EU regulatory information requirements for Daphnia and/or fish toxicity ... 41
3
Abstract
The assessment of aquatic toxicity is an important component of the environmental hazard and risk assessment of all types of chemicals, and is therefore included in several pieces of EU chemicals legislation. Aquatic toxicity refers to the effects of chemicals on organisms living in the water and is usually determined by testing on organisms representing three trophic levels, i.e. plants (or algae), invertebrates (crustaceans such as Daphnia spp.) and vertebrates (fish). Whereas acute aquatic toxicity testing is a basic requirement in most pieces of EU chemicals legislation, chronic aquatic toxicity testing may be required when the outcome of the acute testing indicates a risk, or in the case that long-term exposure is expected. EU chemicals legislation encourages the use of all available information for hazard and risk assessment before new tests on vertebrates are proposed or conducted. In this context, scientific options for avoiding chronic fish testing on the basis of existing data and extrapolation approaches have been explored.
For the purposes of this work, data on acute and chronic aquatic toxicity (Daphnia and fish) from several databases (US EPA Ecotox database, Aquatic ECETOC, Aquatic OASIS, Aquatic Japan MoE databases and ECHA database as implemented in the OECD QSAR Toolbox Version 2.3) were collated and analysed. Simple linear relationships and interspecies sensitivity ratios were calculated using either acute Daphnia data (48h LC50)
or chronic Daphnia data (14 days NOEC) and chronic fish data (>21 days NOEC). Acute to chronic relationships and acute to chronic ratios (ACR) were also calculated based on acute fish data (96h LC50) and chronic fish data. These analyses were carried out on the
whole set of chemicals and on subgroups of chemicals classified according to the Verhaar mode of action (MOA) scheme, which attribute general mode of acute aquatic toxic action based on the chemical structure of the molecule. Outliers were identified applying the Robust regression and Outlier removal (ROUT) method.
Our results show that the best fitted relationships for the prediction of chronic fish toxicity are obtained based on acute fish data (r2=0.87) and acute Daphnia data
(r2=0.64) when dealing with the whole set of chemicals regardless of the MOA. The
quality of the relationships was increased by using the geometric mean (calculated across all the values extracted for a given chemical and a given endpoint) instead of the lowest value for a given endpoint.
When considering the MOA, MOA 3 and MOA 1 chemicals give the strongest acute Daphnia to chronic fish relationship and chronic Daphnia to chronic fish relationship; however the relationships obtained with acute Daphnia data are better (r2= 0.83 and
0.69 for MOA 3 and MOA 1 respectively) than the one obtained with chronic Daphnia data (r2= 0.66 and 0.65 for MOA 1 and 3 respectively). When considering acute fish
data, all the MOA classes give strong relationships (r2=0.88 for MOA 3 and MOA 5
chemicals, 0.85 for MOA 4 chemicals and 0.83 for MOA 1 and MOA 2 chemicals). Therefore when acute toxicity data on fish are available, they might give a reliable basis to extrapolate the chronic toxicity on fish as a first tier assessment or within a weight of evidence approach.
There is a correlation between chemicals with high ACR values or interspecies sensitivity ratios and the outliers identified in the above-mentioned relationships. When considering chemicals with a high interspecies sensitivity ratio, Daphnia being more sensitive than fish, several aniline derivatives and pesticides acting through cholinesterase inhibition were identified. When considering high interspecies sensitivity ratio chemicals for which Daphnia is less sensitive than fish, we found pesticides and known endocrine disruptors such as ethynil oestradiol and 17ß-oestradiol. Extreme (i.e. <1 or > 100) interspecies sensitivity ratios were mainly evident for MOA 2, 4 and 5 chemicals. Regarding ACR for fish, around 50% of the chemicals in each MOA class have an ACR within a factor of 10; whereas 100% of MOA 3, 90.9% of MOA 2, 88.3% of MOA 4 and 85.5% of MOA 1 chemicals have an ACR within a factor of 100. Therefore, the safety factor of 100 commonly applied in environmental risk assessment does not seem to be equally protective for every MOA.
4
1.
Introduction
The assessment of aquatic toxicity is an important component of the environmental hazard and risk assessment of all types of chemicals, and is therefore included in several pieces of EU chemicals legislation. These include the Regulation concerning the Registration, Evaluation, Authorisation and Restriction of Chemicals (REACH, EC, 2006), the Biocidal Products Regulation (EU, 2012), the Plant Protection Products Regulation (EC, 2009a) and data requirements (EU, 2013a, 2013b), pharmaceuticals (EMEA, 2006, 2004), feed additives (EC, 2008a; EFSA, 2008) and others. In addition, the Cosmetics Regulation (EC, 2009b) states that environmental concerns of cosmetic ingredients and products should be addressed through REACH. Information requirements according to the different regulations are summarised in Annex I.
Aquatic toxicity refers to the effects of chemicals on organisms living in the water and is usually determined by testing on organisms representing the three trophic levels, i.e. plants (or algae), invertebrates (crustaceans such as Daphnia spp.) and vertebrates (fish). The information on aquatic toxicity is used for classification and labelling (EC, 2008b), the derivation of Predicted No Effect Concentration (PNEC) values for use in risk assessment, and for the assessment of PBT substances. In general, the lowest of the available toxicity values is used to define the hazard category, derive the PNEC or "Toxicity" criterion of the different trophic levels (fish, crustacean, algae or aquatic plants): 50% effective concentration [EC50] or 50% lethal concentration [LC50] for acute
aquatic toxicity; x% effective concentration [ECx], Lowest Observed Effect Concentration
[LOEC], No Observed Effect Concentration [NOEC] for chronic aquatic toxicity.
Whereas acute aquatic toxicity testing is a basic requirement in most pieces of EU chemicals legislation, chronic aquatic toxicity testing may be required when the outcome of the acute testing indicates a risk, or in the case that long-term exposure is expected. Regulatory aquatic risk assessment schemes require toxicity testing of chemicals on a limited number of laboratory species; thus, extrapolation from the obtained toxic responses to all species representing that trophic level in the environment is a fundamental tenet of regulatory risk assessment. To derive the PNEC for aquatic toxicity, safety factors are applied to the laboratory data. These factors are intended to account for interspecies differences in sensitivity, extrapolation from acute to chronic effects, the physicochemical complexity of natural water versus laboratory test media, and the complexity of the ecosystem versus single species laboratory tests. The choice of the factor (10, 100 or 1000) depends on the quality and quantity of the available data. Moreover, differences in species sensitivity regarding acute aquatic toxicity have been well described (Hoekzema et al., 2006; Hutchinson et al., 2003; Jeram et al., 2005; Tebby et al., 2011; Weyers et al., 2000). To address the question of whether it is possible to predict acute toxicity in fish from non-vertebrate species, Netzeva et al. (2007) reviewed several Quantitative Activity-Activity Relationships between species, the most relevant and reliable relationship for acute fish toxicity being between Daphnia and rainbow trout (n=360), with an r2 value of 0.67. More recent studies have confirmed the
good correlation between acute fish and Daphnia toxicity data, especially for organothiophosphates (0.74<r2<0.94) and (benzo)triazoles (r2=0.87) (Cassani et al.,
2013; Kar and Roy, 2010; Zhang et al., 2010; Zvinavashe et al., 2009). The correlation depends on both the bio-uptake process and the MOA of the chemical (Zhang et al., 2010), as well as its physicochemical properties (Tebby et al., 2011). The US EPA has also developed a specific tool, the Interspecies Correlation Estimation (ICE) tool (implemented as WebICE; Raimondo et al., 2010) to predict acute toxicity to three relevant fish species (fathead minnow, rainbow trout, and common carp) on the basis of Daphnia toxicity, with the strongest correlation being evident between Daphnia and rainbow trout (r2=0.51). However, there is little work on the potential to predict chronic
5
Therefore, and in the light of the EU Directive on the protection of animals used for scientific purposes (EU, 2010) and the EURL ECVAM strategy to replace, reduce and refine the use of fish in aquatic toxicity and bioaccumulation testing (EURL ECVAM, 2014) we have been exploring whether interspecies extrapolations and acute to chronic relationships can be used for supporting the waiving of chronic fish tests. For this purpose, data (LC50, NOEC) for Daphnia and fish have been extracted from various
databases and analysed to identify possible relationships taking into consideration different mode of actions. We discuss these approaches in particular in the context of REACH since the REACH regulation states in §25 that testing on vertebrate animals shall be undertaken only as a last resort (EC, 2006).
6
2.
Regulatory and scientific background
2.1.
REACH requirements and guidance on aquatic toxicity testing
Chronic or long-term aquatic toxicity testing is required for chemicals covered under REACH Annexes VIII-X (10-100, 100-1000, >1000 tonnes per year), if the chemical safety assessment according to Annex I indicates the need to investigate further the effects on aquatic organisms. A potential environmental risk would be evident if the Predicted No Effect Concentration / Predicted Environmental Concentration ratio (PNEC/PEC) is greater than 11 (EC, 2006; ECHA, 2012) (see Appendix I).REACH further states that The choice of the appropriate test(s) depends on the results of the chemical safety assessment (EC, 2006). The appropriate tests listed are long-term testing on invertebrates, preferable Daphnia (TG211; OECD, 2012) and fish, e.g. the Fish Early-Life Stage (FELS) Toxicity Test (TG210; OECD, 2013), the Fish Short-term Toxicity Test on Embryo and Sac-Fry Stages (TG212; OECD, 1998), and the Fish Juvenile Growth Test (TG215; OECD, 2000).
Independent of the tonnage level, long-term aquatic toxicity testing on invertebrates or fish may be preferred to acute aquatic tests if a substance is poorly water soluble.
The ECHA Endpoint Specific Guidance on Aquatic toxicity (ECHA, 2012) details on how the information requirements on aquatic toxicity for the purpose of REACH can be met. If information on long-term aquatic toxicity is needed but a NOEC value from long-term toxicity testing on fish is not available, several options can be considered:
1. The use of other available long-term toxicity data: Standard testing data might be substituted by other reliable experimental data on aquatic invertebrates or fish (e.g. data from non-standard studies or non-standard organisms).
2. The use of reliable QSAR results, although this document also states that "currently reliable QSAR models for chronic toxicity are rare and thus reliable QSAR results will be seldom available".
3. Reliable read-across from available experimental data on a structurally related substance.
When considering long-term testing in fish, the relative sensitivity of fish and other species should also be compared (ECHA, 2012). If there is “compelling evidence” to suggest that the fish value is likely to be at least a factor of about 10 less sensitive than invertebrates or algae, there are no further requirements for fish testing. If invertebrates are likely to be more sensitive than fish and algae then a testing proposal for a long-term toxicity study on Daphnia (OECD TG211) should be submitted to ECHA.
If fish are likely to be more sensitive than invertebrates and algae or the relative sensitivity of fish cannot be predicted, a testing proposal for a long-term study on fish should be submitted; alternatively, risk management measures reducing exposure and hence risk sufficiently might be considered (ECHA, 2012).
1 i.e. if the LC
50 of the short-term fish test divided by 1000 is greater than the Predicted Environmental Concentration (PEC)
7
2.2.
Scientific background
2.2.1.
Importance of Mode of Action and mechanistic understanding in
environmental risk assessment
Extrapolation has always been a key component of criteria setting and risk assessment, and became important in both the quantitative and qualitative relationships between effect measures and assessment endpoints (Solomon et al., 2008). Acute to Chronic Ratios (ACRs), which are empirically derived from a toxicological database, provide simple rules-of-thumb for extrapolating from acute to chronic effects. Being applicable to a broad range of substances, ACRs justify the application of standard assessment factors in the risk assessment process. Therefore, those practices allows the uses of already existing data on a chemical toxicity for a given endpoints and/or species to predict its potential toxicity to another given endpoints/species.
The Mode of Action (MOA) describes the understanding of selected key events that lead to toxic effects, whereas the mechanism of action refers to a comprehensive understanding of the entire sequence of events that results in toxicity (ECETOC, 2006). One complexity of environmental risk assessment is that it should address all the various components of the ecosystem, i.e. all the species with their respective sensitivity to the chemical. To achieve this, the most sensitive species is usually chosen, with the hypothesis that if the most sensitive species is protected, the other species would be protected as well.
In the context of a testing strategy, the mechanistic understanding could allow testing the chemical only on the most sensitive species when there is a shared MOA, i.e. Daphnia toxicity tests could be preferred to fish toxicity tests for ion channel mediated neurotoxicity of pyrethroids, knowing that Daphnia will likely be amongst the most sensitive aquatic organisms although the target protein is found in crustacean, fish, insects and molluscs. In contrast, a very different MOA specific to vertebrates (i.e. receptor mediated feminisation of fish by steroidal oestrogens) would indicate fish testing (ECETOC, 2007). For the same reason, interspecies sensitivity factors can also greatly depend on the MOA. For instance, the acute "base set" (Daphnia, fish and algae) interspecies sensitivity factor for cypermethrin was found to be nearly 463000, a value much higher than typical for MOA 1-3 chemicals, as the target protein is not found in algae.
2.2.2.
Mode of Action, QSARs and grouping of chemicals
In order to develop and apply QSARs for specific MOAs, several attempts have been made to develop structure-based classification schemes. Based on Verhaar et al. (1992) and Enoch et al. (2008), the following classification scheme was proposed (Table 2.1):
Table 2.1: Verhaar Classification Scheme for aquatic modes of action (MOA). Class 1 chemicals acting by nonpolar narcosis (or baseline toxicity)
Class 2 chemicals acting by polar narcosis (including (substituted) phenols and (substituted) anilines)
Class 3 chemicals with non-specific reactivity (including aldehydes and epoxides) Class 4 chemicals with specific reactivity (including pesticides, polychlorinated
biphenyls and some polycyclic aromatic hydrocarbon metabolites) Class 5 all the other chemicals that have not been classify in the previous class
Strictly, the fifth class is not a distinct class, but rather a set of miscellaneous chemicals not covered by MOAs 1-4. It has to be noted that this scheme is based on acute toxicity.
8
Russom et al. (1997) further extended the Verhaar classification scheme and distinguished eight modes of toxic action: base-line narcosis or narcosis I, polar narcosis or narcosis II, ester narcosis or narcosis III, uncoupling of oxidative phosphorylation, respiratory inhibition, electrophile/proelectrophile reactivity, acetylcholinesterase inhibition, and central nervous system seizure.
QSAR models can be used for the prioritisation of chemicals (Salvito et al., 2002; Sanderson et al., 2004) and are useful in cases where data availability is incomplete for a test or when there are differences in test methods. In practice, QSAR predictions for acute aquatic toxicity and bioconcentration in fish are commonly used and widely accepted for regulatory purposes. Models for acute aquatic toxicity are especially useful for chemicals with the least reactive acute MOA (MOA 1 and MOA 2); highly reactive chemicals are more problematic. Netzeva et al. (2007) summarised the features of several fish acute toxicity QSARs and found that r2 values for most narcosis QSARs were
around 0.9. The evidence for the predictive power of acute fish baseline or narcotic toxicity QSARs is therefore strong, and acute ecotoxicity QSARs for non-polar and polar narcotic compounds have been used frequently over the last decades. However, there are few examples of QSARs for chronic fish toxicity, with the exception of those developed for endocrine disrupting chemicals (Grindon et al., 2006). For instance, chronic fish toxicity models have been developed for predicting chronic narcosis to fish (Claeys et al., 2013) and sub-lethal NOEC values for non-polar narcotics (Austin and Eadsforth, 2014).
Several freely available and user-friendly tools and information sources are available, such as the OECD QSAR Application Toolbox, the JRC QSAR models database (http://ihcp.jrc.ec.europa.eu/facilities/JRC_QSAR_Model_Database.htm), Toxtree (http://sourceforge.net/projects/toxtree/), and US EPA’s ECOSAR (http://www.epa.gov/tsca-screening-tools/ecological-structure-activity-relationships-ecosar-predictive-model). This tool, which aims at estimating short-term and chronic toxicity to aquatic organisms, including fish, has been shown to be reliable for neutral organics (de Haas et al., 2011). However, its reliability is not satisfactory if used with chlorinated anilines, although those are polar narcotics (Dom et al., 2012), or if simply used as a black box, which is widely done in the absence of clear guidance (de Roode et al., 2006).
9
3.
Methodology
3.1.
Extraction of data
3.1.1.
Databases
In a first step, organic chemicals with chronic fish toxicity data were selected, and then data sets including acute fish toxicity data as well as acute and chronic toxicity data on Daphnia extracted from the Aquatic ECETOC, the Aquatic OASIS, the Aquatic Japan MoE databases, the ECHA database and the US EPA database, using the OECD QSAR Toolbox 2.32.
3.1.2.
Species
Daphnia (D.) magna was the only species retained for Daphnia spp, while for fish preference was given to OECD freshwater fish species (zebrafish [Danio rerio], fathead minnow [Pimephales promelas], common carp [Cyprinus carpio], Japanese medaka [Oryzias latipes], guppy [Poecilia reticulata], bluegill [Lepomis macrochirus], rainbow trout [Onchorhynchus mykiss], three-spined stickleback [Gasterosteus aculeatus]) as well as the saltwater species sheepshead minnow (Cyprinodon variegatus). Data from other species of freshwater fish or from saltwater or estuarine species were considered only if there were no data available on the preferred species.
3.1.3.
Endpoint and duration of exposure
The LC50 was chosen as the endpoint for acute toxicity tests. The duration of acute
toxicity tests is typically 48h for Daphnia and 96h for fish. The acute effects taken into account in this study were immobilisation and mortality for Daphnia, and mortality for fish.
The NOEC was chosen as the endpoint for long-term toxicity tests. The minimum duration of exposure considered was 21 days for Daphnia; and 21, 28 or more days for fish. The chronic effects taken into account were mortality, reproduction, growth and development.
3.1.4.
Quality check
Data were checked for duplicates (i.e. if the same data were extracted from several databases), and it was checked that the toxicological value was below the solubility limits of the substances. Only data ranked Klimisch score 1 or 2 from the ECHA database were considered.
3.2.
Treatment of data prior to analysis
3.2.1.
Lowest value and geometric mean approaches
If there was more than one value per endpoint of interest for a given chemical, either the lowest toxicological value was identified or the geometric mean was calculated for the given endpoint and used for the analysis. The use of the lowest value is often recommended in environmental risk assessment in order to favour a conservative approach; however when it comes to conclude on a relationship, the use of the geometric mean, by giving less weight to the extreme value, can improve the quality of the relationship.
2The extraction was made in July 2014 for the Aquatic ECETOC, the Aquatic OASIS, the Aquatic Japan MoE databases, and the US EPA database.
10
Both approaches were applied when analysing the whole set of chemicals (i.e. irrespective of the MOA), whereas only the geometric mean approach was applied to the chemicals subdivided according to their MOA (see below).
3.2.2.
Assignment of Modes of Action
The selected chemicals were profiled with the QSAR Toolbox and classified into five MOA classes according to the Verhaar classification scheme (see Table 2.1). To complete the classification they were further profiled with Toxtree and the post-processing filter encoded as a KNIME workflow (Ellison et al., 2015) that has recently been developed in order to improve the predictivity of the Toxtree scheme. In case of conflicting results or MOA 5 chemicals, other data from literature has been used to attribute a final MOA (Barron et al., 2015; ECETOC, 2007; Russom et al., 1997).
3.3.
Analysis
A simple linear regression on log10-transformed data was used (GraphPad Prism 5) to obtain the interspecies relationships and the corresponding r2 values (measures of
goodness-of-fit) for the whole set of chemicals or subsets of chemicals according to their MOA. The Robust regression and Outlier removal (ROUT) method to identify potential outliers was used (Motulsky and Brown, 2006); the r2 given are the r2 after elimination
of the outlier(s). For the interpretation of regression data it was assumed that a regression coefficient r2 of >0.6 corresponds to a moderate correlation whereas a value
of about 0.8 and more corresponds to a reliable prediction.
The interspecies sensitivity ratio for each chemical (SRacute=LC50Daphnia/NOECFish;
SRch=NOECDaphnia/NOECFish) and the acute to chronic ratio for fish (ACRfish) were also
calculated to compare the respective sensitivity of fish and Daphnia. The statistical result was characterised by the median and 90%-ile value as well as by their minimum and maximum values. The distribution of the sensitivity ratio (<10; 10<<100; 100<<1000; >1000) were also analysed, taking the MOA into account.
11
4.
Results and discussion
This chapter describes our own derivation of interspecies extrapolation and interspecies sensitivity ratio in 4.1; and focuses on acute to chronic relationship based on fish toxicity data and ACRs for fish in 4.2. We further discuss possible reasons for outliers.
4.1.
Interspecies extrapolation (quantitative activity-activity
relationships)
Chronic fish toxicity data have been compared with acute and chronic Daphnia data, in order to better characterise the relationship existing between those data. The ratio sensitivity has also been calculated for each chemical to compare the respective sensitivity of the two species.
4.1.1.
Daphnid to chronic fish relationships – irrespective of the MOA
4.1.1.1. Relationships
There were 246 substances with matched Daphnia acute data (LC50 48h) and chronic fish
data (NOEC >21 days); and 193 substances with matched Daphnia chronic data (NOEC - 21 days), and chronic fish data. There was a significant relationship between Daphnia data and chronic fish toxicity data with both approaches (p<0.0001). However, in both cases (acute Daphnia and chronic Daphnia data), the goodness-of-fit was improved by using geometric means instead of the lowest values (r2 of logged data = 0.64 and 0.61
respectively for acute Daphnia data; 0.59 and 0.57 respectively for the chronic Daphnia data) (see
Table 4.1). Data are plotted in Figure 4.1 and Figure 4.2.
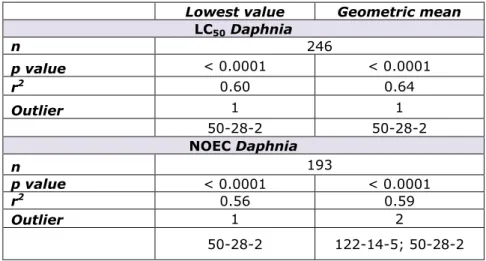
Table 4.1:Linear relationships between Daphnia acute or chronic toxicity data and fish chronic toxicity data.
Lowest value Geometric mean
LC50Daphnia n 246 p value < 0.0001 < 0.0001 r2 0.60 0.64 Outlier 1 1 50-28-2 50-28-2 NOEC Daphnia n 193 p value < 0.0001 < 0.0001 r2 0.56 0.59 Outlier 1 2 50-28-2 122-14-5; 50-28-2
12
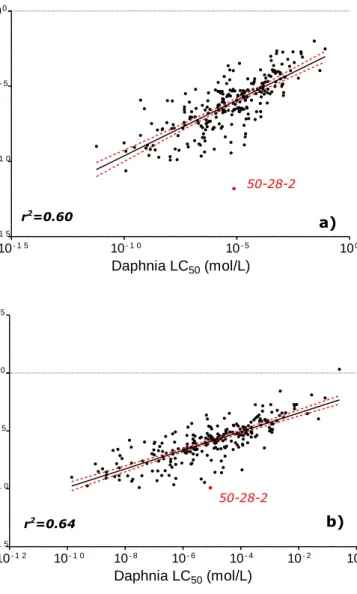
Figure 4.1: Relationships between Daphnia 48h LC50 and fish NOEC values from the
OECD QSAR Toolbox 2.3 (n=246). a: Lowest value approach, b: Geometric mean approach. The dashed lines represent the 95% confidence interval. Italics: CAS number
of the outliers.
Daphnia LC50 LV
10- 1 5 10- 1 0 10- 5 100 10- 1 5 10- 1 0 10- 5 100 Daphnia LC50 (mol/L) F is h NO E C ( m o l/L )Geomean acute daphnia
10- 1 2 10- 1 0 10- 8 10- 6 10- 4 10- 2 100 10- 1 5 10- 1 0 10- 5 100 105 Daphnia LC50 (mol/L) F is h NO E C ( m o l/L ) b) a) 50-28-2 50-28-2 r2=0.60 r2=0.64
13
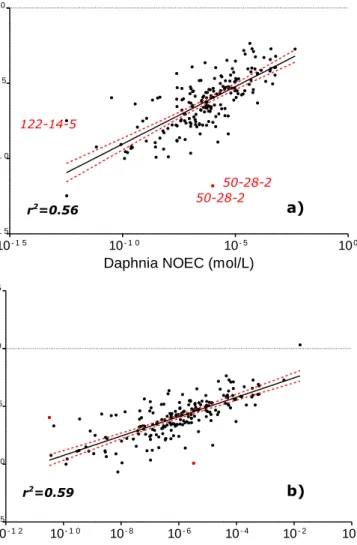
Figure 4.2: Relationships between Daphnia 21-days NOEC and fish NOEC values from the OECD QSAR Toolbox 2.3 (n=193). a: Lowest value approach, b: Geometric mean approach. The dashed lines represent the 95% confidence interval. Italics: CAS number
of the outliers.
4.1.1.2. Discussion of outliers
Regarding acute Daphnia to chronic fish relationships, only 17ß-oestradiol is identified as outlier, with both approaches (Figure 4.1). Regarding chronic Daphnia data to chronic fish relationship, 17ß-oestradiol is also identified as an outlier with both approaches and a second chemical, fenitrothion, is identified with the geometric mean approach (.
Table 4.2).
Table 4.2: Name and MOA of outliers
Lowest value approach Geometric mean Name of chemical MOA Acute Daphnia data
50-28-2 50-28-2 17ß-oestradiol 2
Chronic Daphnia data
50-28-2 50-28-2 17ß-oestradiol 2 122-14-5 Fenitrothion 4 NOEC Daphnia LV 10- 1 5 10- 1 0 10- 5 100 10- 1 5 10- 1 0 10- 5 100
Daphnia NOEC (mol/L)
F is h NO E C ( m o l/L )
NOEC Daphnia Geo
10- 1 2 10- 1 0 10- 8 10- 6 10- 4 10- 2 100 10- 1 5 10- 1 0 10- 5 100 105
Daphnia NOEC (mol/L)
F is h NO E C ( m o l/L ) a) b) r2=0.56 r2=0.59 50-28-2 50-28-2 122-14-5
14
17ß-oestradiol is a steroid and an oestrogen sex hormone found in most vertebrates as well as many crustaceans, insects, fish, and other animal species. It is a well-studied chemical characterised by a high quantity of data in the various databases (118 entries after extraction, 42 entries in our final database). The NOEC fish values reported display a high variability and range between 0.00001 and 0.001. This can be due, amongst other factors, to the fact that the guidelines used for chronic fish tests cover different life stages. The impact of this variability is decreased by the use of the geometric mean approach, which gives less weight to extreme values. Nevertheless, 17ß-oestradiol remains an outlier due to its high toxicity to fish. Although being classified as MOA 2, 17ß-oestradiol acts primarily as an agonist of the oestrogen receptor (ER). The result of ER activation is a modulation of gene transcription and expression in ER-expressing cells which is the predominant mechanism by which 17ß-oestradiol mediates its biological effects. However, it also acts as an agonist of membrane oestrogen receptors via which it can mediate a variety of rapid, non-genomic effects (Pinto et al., 2014). Therefore, 17ß-oestradiol acts by a rather specific and non-narcotic MOA, at least when it comes to chronic toxicity; however, this is not captured in the Verhaar scheme being a classification scheme based on acute toxicity.
Fenitrothion is a phosphorothioate insecticide acting through acetyl cholinesterase inhibition. It appears as one of the most chronically toxic chemicals to Daphnia in our database, whilst having a medium toxicity to fish. However, there was only one Daphnia NOEC value available.
4.1.1.3. Interspecies sensitivity ratio
The sensitivity ratios of the chemicals have been calculated and their distribution is shown in Figure 4.3 (SRac=LC50Daphnia/NOECFish; SRch=NOECDaphnia/NOECFish). A ratio of >1
indicates that Daphnia are less sensitive compared to fish and a ratio of <1 indicates that Daphnia are more sensitive compared to fish. Quite expectedly, acute Daphnia LC50
values are generally higher than chronic fish NOEC values (81.6% of the chemicals), and usually within a factor 10 for 39% of the latter chemicals.
When using Daphnia NOEC values, the distribution is shifted to the left by a factor of 10. For 69.9% of the chemicals, the SRch is within a factor of 10; amongst which Daphnia is
less sensitive for 35.7% of the chemicals, and more sensitive for 34.5% of the chemicals. As a whole, Daphnia is more sensitive for 53% of the chemicals, whereas fish is more sensitive for 47% of the chemicals. Therefore, none of these two trophic levels (i.e. fish and daphnids) seems to be more sensitive than the other in chronic testing, which is in line with some previous work (May and Hahn, 2014).
15
Figure 4.3: Sensitivity ratio derived with acute Daphnia data versus chronic fish data (blue bars) and chronic Daphnia data versus chronic fish data (red bars) in % of chemicals of the whole dataset; i.e. 34.7% of the chemicals demonstrates a higher chronic toxicity in Daphnia compared to NOEC fish and values range within a factor of
10; for 39% of the chemicals, the acute Daphnia LC50 indicate a lower sensitivity
compared to chronic NOEC fish and values range within a factor of 10.
In 90.7% of the cases, the chronic SRch is within a factor 100. For the remaining 9.3%
corresponding to 19 chemicals, (see Table 4.3) a high SRch was calculated.
These 19 chemicals are representing pharmaceuticals, pesticides, aromatic amines and hormones. With the exception of ibuprofen being classified as MOA 1, they are mostly specifically acting chemicals (seven MOA 4) and polar narcotics (seven MOA 2). One is classified as MOA 3 and two are classified as MOA 5.
Although the exact mechanism of action of ibuprofen is not known, this nonsteroidal anti-inflammatory pharmaceutical is a nonselective inhibitor of cyclooxygenase, an enzyme involved in prostaglandin synthesis via the arachidonic acid pathway. Its pharmacological effects are believed to be due to inhibition of cyclooxygenase-2 (COX-2) which decreases the synthesis of prostaglandins involved in mediating inflammation, pain, fever, and swelling3. Norethindrom is a progestin hormone, whereas ethinyl
oestradiol and 17ß-oestradiol are oestrogen hormones.
3 http://www.drugbank.ca/drugs/DB01050#, version 4.3 (22/06/2015), retrieved
24/02/2016 0.4 5.7 11.8 39.0 31.3 8.1 2.4 1.2 0.5 1.6 4.1 12.4 34.7 36.3 7.3 2.1 0.5 0.5 0 10 20 30 40 50 Per ce n tage o f c h e m ic al s Factor value
Interspecies sensitivity ratio distribution
SRac SRch
16
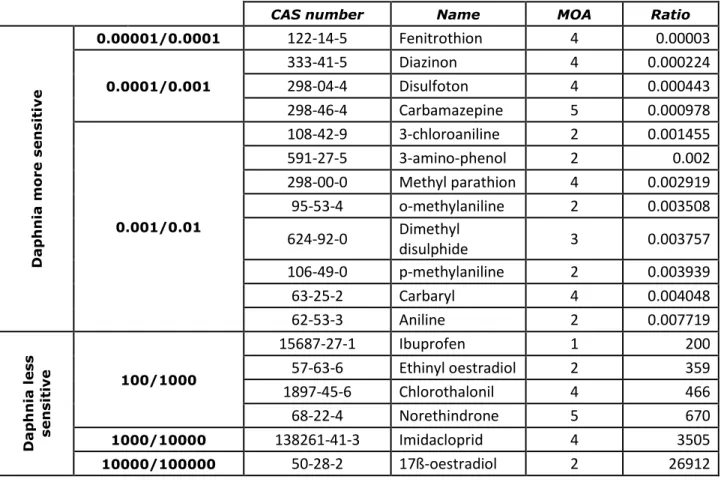
Table 4.3: Substances with a high SRch
CAS number Name MOA Ratio
D ap h n ia m o re sens it iv e 0.00001/0.0001
122-14-5
Fenitrothion
4
0.00003
0.0001/0.001333-41-5
Diazinon
4
0.000224
298-04-4
Disulfoton
4
0.000443
298-46-4
Carbamazepine
5
0.000978
0.001/0.01108-42-9
3-chloroaniline
2
0.001455
591-27-5
3-amino-phenol
2
0.002
298-00-0
Methyl parathion
4
0.002919
95-53-4
o-methylaniline
2
0.003508
624-92-0
Dimethyl
disulphide
3
0.003757
106-49-0
p-methylaniline
2
0.003939
63-25-2
Carbaryl
4
0.004048
62-53-3
Aniline
2
0.007719
D ap h n ia les s sens iti v e 100/100015687-27-1
Ibuprofen
1
200
57-63-6
Ethinyl oestradiol
2
359
1897-45-6
Chlorothalonil
4
466
68-22-4
Norethindrone
5
670
1000/10000138261-41-3
Imidacloprid
4
3505
10000/10000050-28-2
17ß-oestradiol
2
26912
Amongst other chemicals for which Daphnia is far less sensitive than fish, is chlorothalonil, a broad spectrum non-systemic fungicide also used as a wood protectant, pesticide, acaricide, and to control mold, mildew, bacteria and algae. It acts via the formation of substituted chlorothalonil-reduced glutathione derivatives in cells, which trigger inhibition of specific NAD thiol-dependent glycolytic and respiratory enzymes (Tillman et al., 1973). This action on basic glycolytic and respiratory pathways is conserved across biological taxa and toxicity is evident in multiple organisms.
Imidacloprid is a neonicotinoid, a systemic insecticide which acts as an insect neurotoxin, by blocking nicotinic acetylcholine receptors and preventing acetylcholine from transmitting impulses between nerves, which result in the insect's paralysis and eventual death. Quite unexpectedly, it appears to be much more toxic to fish than to Daphnia. There was one entry for chronic fish toxicity in the database, from the general literature. When going back to the original study, it appears that the NOEC corresponds to the concentration measured in the field when assessing the chronic endpoint 27 days after contamination of the field (1.1 μg/L) (Sanchez-Bayo and Goka, 2005). As there was no effect, this quite low concentration appears as a NOEC, although other sources mention a much higher fish NOEC, i.e. the EFSA conclusion on imidacloprid retains a chronic NOEC value of 9.02 mg/L (EFSA, 2014). This means that this high chronic sensitivity ratio is probably methodologically biased.
Regarding chemicals for which Daphnia is much more sensitive than fish, we found mainly pesticides acting through acethylcholinesterase inhibition and aromatic amines. Diazinon, disulfoton and methylparathion are organophosphate insecticides, whilst
17
carbaryl is of the carbamate family, and fenitrothion is a phosphorothioate. All of them act through acethylcholinesterase inhibition.
Carbamazepine is a pharmaceutical, an anticonvulsant, which works by decreasing nerve impulses that cause seizures and pain.
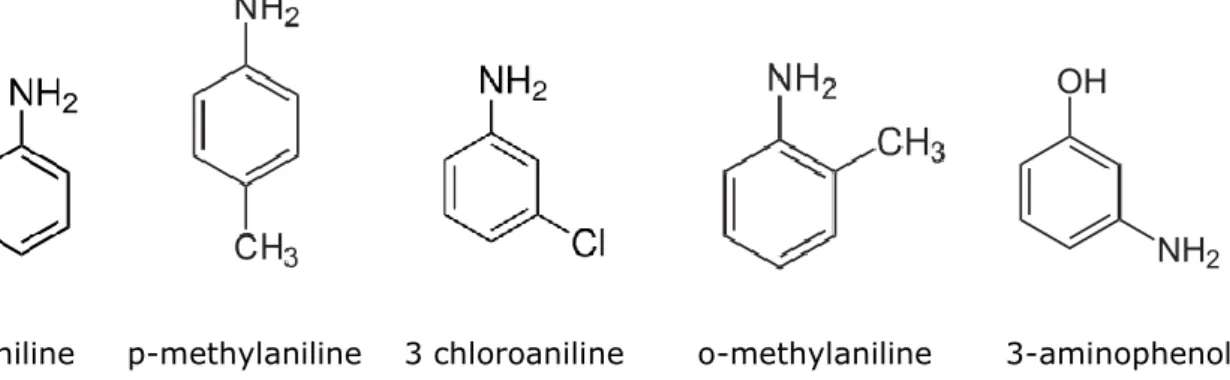
Finally, aniline and its derivatives, p-methylaniline, 3 chloroaniline, 2-methylaniline and 3-amino-phenol show chronic sensitivity factors ranging between 0.001 and 0.01, which means that Daphnia is at least 100-fold more sensitive than fish.
Figure 4.4: Aniline and its derivatives.
It has to be highlighted that the Verhaar classification scheme is built on acute fish toxicity, and that chemicals are attributed to the four MOA classes based on structural characteristics. However, acute toxicity mechanisms are different from chronic toxicity mechanisms. This can explain why chemicals acting via endocrine disruption mechanisms are not identified as "specifically acting chemicals" (MOA 4) but as, for example, MOA 2 in the case of ethinyl oestradiol and 17ß-oestradiol. In the same way, aniline and its derivatives are classified as polar narcotics which are characterised by a slightly higher toxicity to fish than the baseline toxicity of MOA 1 chemicals, although its toxicity to Daphnia is much higher.
18
4.1.2.
Daphnid to chronic fish relationships by MOA
To check whether or not the goodness-of-fit depends on the MOA, the linear regression was performed for each MOA class, using the geometric mean approach. The results are shown in Table 4.4, Figure 4.5 (acute toxicity), and Figure 4.6 (chronic toxicity)
4.1.2.1. Relationships
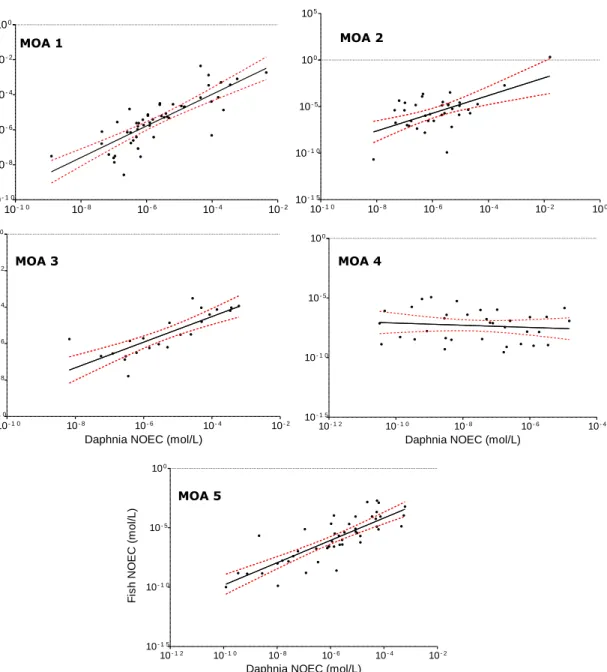
The relationships are highly significant (p≤0.0001) for four classes of MOA; i.e. MOAs 1, 2, 3, and 5. For MOA 4 chemicals the relationships are not significant with p=0.0004 for the relationship based on acute Daphnia data and p=0.4982 for the relationship based on chronic Daphnia data. This means that chronic Daphnia toxicity would be a very poor predictor of chronic fish toxicity for MOA 4 chemicals, at least if all the MOA 4 are taken together. This makes sense as this is the group of chemicals with specific MOA which are not necessarily present in all taxa. It would therefore be interesting to divide further this MOA 4 group and to investigate the relationship of specific mechanisms (e.g. AchE inhibition, neurotoxicant, respiratory blocker, etc).
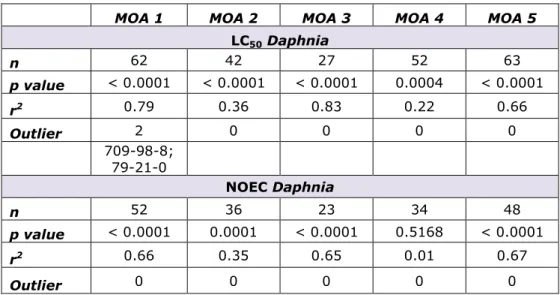
Table 4.4: Linear relationships between Daphnia acute or chronic toxicity and fish chronic toxicity data depending on the MOA.
MOA 1 MOA 2 MOA 3 MOA 4 MOA 5
LC50Daphnia n 62 42 27 52 63 p value < 0.0001 < 0.0001 < 0.0001 0.0004 < 0.0001 r2 0.79 0.36 0.83 0.22 0.66 Outlier 2 0 0 0 0 709-98-8; 79-21-0 NOEC Daphnia n 52 36 23 34 48 p value < 0.0001 0.0001 < 0.0001 0.5168 < 0.0001 r2 0.66 0.35 0.65 0.01 0.67 Outlier 0 0 0 0 0
In both cases, the r2of logged data is higher for MOAs 1 and 3 (respectively, 0.79/0.83
for MOA 1/MOA 3 based on acute Daphnia data, and 0.66/0.65 for MOA 1/MOA 3 based on chronic Daphnia data), and much lower for MOAs 2 and 4 chemicals (respectively, 0.36/0.22 for MOA 2/MOA 4 based on acute Daphnia data and 0.35/0.01 for MOA 2/MOA 4 based on acute Daphnia data). The strongest relationship is therefore obtained with acute Daphnia data, and not with chronic Daphnia data.
The r2 for MOA 5 chemicals is rather high. This could suggest that many MOA 1 or 3
chemicals might be present in the MOA 5 group knowing that the MOA 5 class is a mix of all the chemicals that have not been allocated to MOA 1 to 4 classes, i.e. a mix of MOAs 1, 2, 3 and 4 chemicals that have not been identified as such.
19
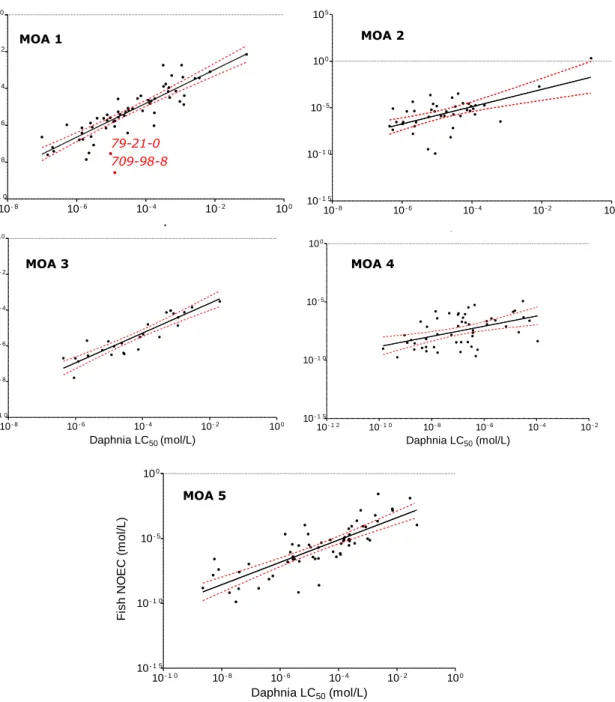
Figure 4.5: Relationships between Daphnia LC50 and fish NOEC values by MOA. The
dashed lines represent the 95% confidence interval. Italics: CAS number of the outliers. MOA 1 geomean LC50 Daphnia
10- 8 10- 6 10- 4 10- 2 100 10- 1 0 10- 8 10- 6 10- 4 10- 2 100 Daphnia LC50 (mol/L) F is h NO E C ( m o l/L ) MOA2 LC50 Daphnia 10- 8 10- 6 10- 4 10- 2 100 10- 1 5 10- 1 0 10- 5 100 105 Daphnia LC50 (mol/L) F is h NO E C ( m o l/L ) MOA3 LC50 daphnia 10- 8 10- 6 10- 4 10- 2 100 10- 1 0 10- 8 10- 6 10- 4 10- 2 100 Daphnia LC50(mol/L) F is h NO E C ( m o l/L ) LC50 Daphnia MOA4 10- 1 2 10- 1 0 10- 8 10- 6 10- 4 10- 2 10- 1 5 10- 1 0 10- 5 100 Daphnia LC50 (mol/L) F is h NO E C ( m o l/L ) LC50 Daphnia MOA 5 10- 1 0 10- 8 10- 6 10- 4 10- 2 100 10- 1 5 10- 1 0 10- 5 100 Daphnia LC50 (mol/L) F is h NO E C ( m o l/L ) MOA 1 MOA 2 MOA 3 MOA 4 MOA 5 709-98-8 79-21-0
20
Figure 4.6: Relationships between Daphnia NOEC and fish NOEC values by MOA. The dashed lines represent the 95% confidence interval. Italics: CAS number of the outliers.
4.1.2.2. Outliers
Only two outliers have been identified, both belong to the MOA 1 class and are present in the relationship based on acute Daphnia data. The two outliers are propanil (CAS No: 709-98-8) and peracetic acid (CAS No: 79-21-0). Propanil is a widely used contact herbicide which mainly acts against weeds by inhibiting their photosynthesis and CO2
fixation, and which shows a very high chronic toxicity toward fish compared to the other MOA 1 chemicals. Peracetic acid is used as an antimicrobial. Only one NOEC value for fish was available for peracetic acid in the ECHA database (0.0022 mg/L) representing a nominal value in the middle of the range of concentrations tested (0.2, 0.7, 2.2, 7.5, 22.4 µg peracetic acid/L).
MOA 1 Geomean NOEC Daphnia
10- 1 0 10- 8 10- 6 10- 4 10- 2 10- 1 0 10- 8 10- 6 10- 4 10- 2 100
Daphnia NOEC (mol/L)
F is h NO E C ( m o l/L )
MOA2 NOEC Daphnia
10- 1 0 10- 8 10- 6 10- 4 10- 2 100 10- 1 5 10- 1 0 10- 5 100 105
Daphnia NOEC (mol/L)
F is h NO E C ( m o l/L )
MOA3 NOEC daphnia
10- 1 0 10- 8 10- 6 10- 4 10- 2 10- 1 0 10- 8 10- 6 10- 4 10- 2 100
Daphnia NOEC (mol/L)
F is h NO E C ( m o l/L )
NOEC Daphnia MOA4
10- 1 2 10- 1 0 10- 8 10- 6 10- 4
10- 1 5
10- 1 0
10- 5
100
Daphnia NOEC (mol/L)
F is h NO E C ( m o l/L )
NOEC Daphnia MOA5
10- 1 2 10- 1 0 10- 8 10- 6 10- 4 10- 2
10- 1 5
10- 1 0
10- 5
100
Daphnia NOEC (mol/L)
F is h NO E C ( m o l/L ) MOA 1 MOA 2 MOA 3 MOA 4 MOA 5
21 4.1.2.3. Sensitivity ratios
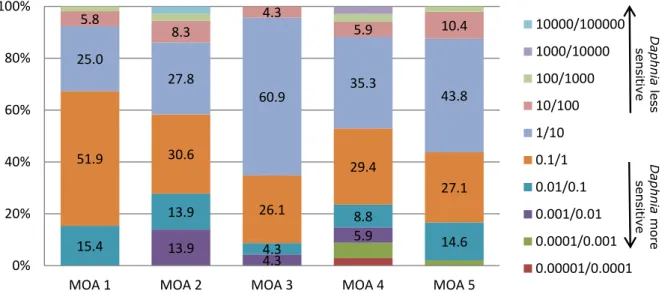
Figure 4.7: Distribution of the chronic sensitivity ratios between Daphnia NOEC and fish NOEC according to their MOA.
The distribution of the sensitivity ratios according to their MOAs (Figure 4.7) shows that 87% of the MOA 3 chemicals are within a chronic sensitivity ratio Daphnia/fish of 10, and 95.6% are within a factor of 100. However, for the majority of the MOA 3 chemicals, Daphnia seems less sensitive than fish (60.9% of the MOA 3 chemicals have a sensitivity ratio between 1-10). Regarding MOA 1 chemicals, 76.9% of the chemicals have a sensitivity ratio within 10, Daphnia being more sensitive than fish for 51.9% of them; and 98.1% of the MOA 1 chemicals are within a sensitivity ratio of 100.
For MOA 4, the sensitivity ratios cover a broader range, i.e. only 64.7% of the MOA 4 chemicals have a chronic sensitivity ratio within a factor of 10, Daphnia being more sensitive for only 29.4% of the chemicals. 79.4% of these chemicals have a sensitive ratio within 100; which means that 20% of the MOA 4 chemicals have very high values of sensitivity ratio. MOA 2 chemicals also follow this pattern with only 58.4% of chemicals within a sensitivity ratio of 10 and 80.6% within a factor 100.
4.2.
Acute to chronic fish data
4.2.1.
Acute to chronic fish relationships – irrespective of the MOA
4.2.1.1. Relationships
There were 240 substances with acute fish toxicity data and chronic fish data. There was a significant relationship between acute and chronic fish toxicity data with both approaches (p<0.0001), but as previously, the goodness-of-fit was improved by using geometric means instead of the lowest values (r2 of logged data =0.82 and 0.87
respectively for the lowest value approach and the geometric mean approach, see Table 4.5). Data are plotted in Figure 4.8.
13.9 4.3 5.9 15.4 13.9 4.3 8.8 14.6 51.9 30.6 26.1 29.4 27.1 25.0 27.8 60.9 35.3 43.8 5.8 8.3 4.3 5.9 10.4 0% 20% 40% 60% 80% 100%
MOA 1 MOA 2 MOA 3 MOA 4 MOA 5
10000/100000 1000/10000 100/1000 10/100 1/10 0.1/1 0.01/0.1 0.001/0.01 0.0001/0.001 0.00001/0.0001 D ap h n ia mor e sen si tiv e D ap h n ia less sen si tiv e
22
Table 4.5:Linear relationships between acute fish data and chronic fish data. Lowest
value Geometric mean
n 240 p value < 0.0001 < 0.0001 r2 0.82 0.87 Outlier 3 4 1897-45-6; 709-98-8; 298-00-0 1897-45-6; 56-38-2; 709-98-8; 135-19-3
Figure 4.8: Relationships between acute LC50 fish data and fish NOEC values from the
OECD QSAR Toolbox 2.3 (n=240). a: Lowest value approach, b: Geometric mean approach. The dashed lines represent the 95% confidence interval. Italics: CAS number
of the outliers.
Fish LC50 LV
10- 1 2 10- 1 0 10- 8 10- 6 10- 4 10- 2 100 10- 1 5 10- 1 0 10- 5 100Fish LC
50(mol/L)
F
is
h
NO
E
C (
m
o
l/L
)
LC50 Fish geomean
10- 1 5 10- 1 0 10- 5 100 105 10- 1 5 10- 1 0 10- 5 100 105Fish LC
50(mol/L)
F
is
h
NO
E
C (
m
o
l/L
)
b) a) r2=0.82 r2=0.86 298-00-0 1897-45-6 709-98-8 135-19-3 1897-45-6 56-38-2 709-98-823 4.2.1.2. Discussion of outliers
With either of the two approaches, two outlier chemicals are identical whereas the other outlier chemicals depend on the approach used (Figure 4.8). The name and the MOA of thee outliers are presented in Table 4.6.
Table 4.6: Name and MOA of outliers of the acute to chronic relationships on fish data.
Name of
chemical CAS Number MOA Lowest value approach Geometric mean
Methyl parathion 298-00-0 4 +
Propanil 709-98-8 1 + +
Chlorothalonil 1897-45-6 4 + +
2-naphthol 135-19-3 2 +
Ethyl-parathion 56-38-2 4 +
Two chemicals, propanil and chlorothalonil, are identified as outliers in both approaches, because their chronic fish toxicity is higher than expected when considering their acute fish toxicity. Propanil is a widely used contact herbicide, which acts against weeds by inhibiting their photosynthesis and CO2 fixation. According to Russom et al. (1997), it is
classified as a MOA 1 chemical acting as a non-polar narcotic in acute toxicity to fish. However, the OECD QSAR Toolbox identified this chemical as a MOA 5 chemical. Chlorothalonil is a broad spectrum non-systemic fungicide (see chapter 4.1.1.3) which acts via the formation of substituted chlorothalonil-reduced glutathione (GSH) derivatives in cells, which trigger inhibition of specific nicotinamide adenine dinucleotide (NAD) thiol-dependent glycolytic and respiratory enzymes (Tillman et al., 1973). It is classified as a specifically acting chemical (MOA 4).
With the geometric mean approach, two other chemicals are identified as outliers because of a higher chronic toxicity to fish, 2-naphtol, a widely used intermediate for the production of dyes and other compounds, classified as a MOA 2, and ethyl-parathion, an organophosphate pesticide (MOA 4 chemical).
With the lowest value approach, methyl parathion is also identified as an outlier because of its lower chronic fish toxicity in comparison to its acute toxicity to fish. This organophosphate pesticide was already mentioned because of a high interspecies sensitivity ratio between Daphnia and fish (see chapter 4.1.1.3).
4.2.1.3. Acute to chronic ratio
The average ACR for fish over the 240 chemicals was 141.8, but the median is 8.9, which means that there are extremely high values which influence this average value. This is in line with some previous work reporting a median ACR for fish of 10.5 (Ahlers et al., 2006). Quite unexpectedly, for seven chemicals the ACR was below 1 (but within a factor of 10, the lowest ACR being 0.15), which means that the chronic toxicity (NOEC) value in the database was higher for those chemicals than the acute toxicity value. This might be due to the fact that different endpoints and different species have been considered in the database; and that the variability between species and/or endpoints might overcome the acute to chronic ratio. Amongst those seven chemicals, there are three MOA 1, two MOA 5, one MOA 4, and one MOA 2 (See Table 4.7). Usually MOA 4 chemicals are characterised by higher ACR due to their specific MOA; however, ziram, a pesticide, has an ACR of 0.54 according to our database.
24
Table 4.7: Name and MOA of chemicals with ACR < 1. CAS
number Name MOA Ratio
ACR <1 4747-21-1 N-methylisopropylamine 1 0.15 108-18-9 Diisopropylamine 1 0.51 137-30-4 Ziram 4 0.54 106-93-4 1,2-dibromoethane 1 0.54 70124-77-5 Flucythrinate 5 0.67 107-51-7 Octamethyltrisiloxane 5 0.77 110-86-1 Pyridine 2 0.91
For ziram, there are two fish LC50 (0.0097 and 0.57 mg/L) and two NOEC values (0.101
and 0.189 mg/L) available in our database. They have been extracted from the ECHA database and are considered reliable data. It was not possible to go back to the original reference of the pyridine data; however, the very low toxicity (one LC50 value of 99.6
mg/L and one NOEC value of 110 mg/L) probably means that this higher NOEC is due to the experimental design.
Regarding flucythrinate, a pyrethroid pesticide, two LC50 values of 0.0002 mg/L and one
NOEC value of 0.0003 mg/L on two different species were extracted from the Aquatic ECETOC database. For octamethyltrisiloxane, an ectoparasiticides drug, all data were extracted from the ECHA database: one LC50 value of 0.0194 mg/L on Oncorhynchus mykiss along with two NOEC values in the same range (0.027 mg/L on Oncorhynchus mykiss for growth, survival and hatching, and 0.021 mg/L for survival on Pimephales promelas). We have some doubts on the value reported as LC50 since this value is also
given as NOEC value of the same study.
The ECHA database also reported two values for n-methylisopropylamine: one LC50 96h
on Danio rerio with mortality initiating from 43.3 mg/L (acute fish toxicity test, according to the OECD TG203, carried out in 2008) the calculated LC50 was 48.5 mg/L; and one
NOEC value >323 mg/L after 28 days of exposure (Juvenile growth test carried out in 2011 according to the OECD TG215) on the same species. There was no explanation for the difference between those two values. Regarding diisopropylamine, there were six LC50 values on four different species (37, 40, 42, 75, 196 and 798 mg/L, which is a
rather broad and unusual range (factor of 21 between the higher and the lower; LC50
reported) and only one NOEC value of 187 mg/L. The highest LC50 of 798 mg/L and the
NOEC value were obtained on the same species, Gasterosteus aculeatus, which does not seem to be very sensitive to this chemical. All data were extracted from the ECHA database in which they were ranked as reliable with a Klimisch score of 1 or 2.
Regarding 1,2 bromoethane, one fish LC50 value (32.1 mg/L) and two NOEC values (5.81
and 9.62 mg/L for growth and mortality obtained with Oryzia latipes) were extracted from the Aquatic ECETOC database. In addition to these data, the ECHA database contains two more LC50 values derived with Oncorhynchus mykiss (1.13 and 1.86 mg/L)
and labelled with a Klimisch score of 1. This corresponds to a factor 28 between the lowest and the highest LC50 value.
The range of ACR is quite broad (up to 14906) but 53.34% of the chemicals have an ACR below 10 and 92.9% have an ACR below 100 (see Figure 4.9). The maximum value of 14906 is therefore far above the maximum ACR of 2450 found by Ahlers et al. (2006) The 90th percentile value is 70.85. If we apply the Ahlers et al. (2006) value of 30 to
discriminate between low and high ACR, 190 chemicals (79.2%) have a low and 50 (20.8%) a high ACR.
25
Figure 4.9: Acute to chronic fish toxicity ratio distribution.
The 17 chemicals with ACR above 100 are presented in Table 4.8. Quite unexpectedly, six (35%) of these high ACR are MOA 1 chemicals, five (29%) are MOA 4 chemicals, three (17%) are MOA 2 chemicals and three (17%) are MOA 5 chemicals. Ahlers et al. (2006) previously found that MOA 1 was a good predictor that a substance would have a lower ACR, although other MOAs were not necessarily associated with higher ACRs. The MOA 1 are genistein, monoethanolamine, dimethylamine, peracetic acid and diuron. Genistein is a phytoestrogen and belongs to the category of isoflavones. Due to its structure similarity to 17ß-oestradiol (Figure 4.10) it has been shown to interact with animal and human oestrogen receptors (Green, 2015; Patisaul et al., 2002), but also to bind to and transactivate all three PPAR isoforms, α, δ, and γ (Wang et al., 2014) and to possibly inhibit the DNA methyltransferase (Fang et al., 2007). Only one LC50 value is
reported for genistein (1.9 mg/L), along with five NOEC values coming from the same study (0.0013 to 0.0042 mg/L). All studies have been carried out with Danio rerio.
Genistein 17ß-oestradiol
Figure 4.10: Structural similarity between genistein and 17ß-oestradiol.
2.92 50.42 39.58 5.42 1.25 0.42 0 10 20 30 40 50 60 <1 1-10 10-100 100-1000 1000-10000 >10000 % o f c h e m ic al s
Acute to chronic ratio range
ACR
26
Table 4.8: Name and MOA of chemicals with ACR >100. CAS
number Name MOA Ratio
100/1000 181587-01-9 5-amino-1-[2,6-dichloro-4- (trifluoromethyl)phenyl]-4- (ethylsulfinyl)-1H-pyrazole-3-carbonitrile 4 134 2212-67-1 Molinate 4 155 330-54-1 Diuron 1 161 124-40-3 Dimethylamine 1 192 606-20-2 2,6-dinitrotoluene 5 193 1912-24-9 Atrazine 5 232 79-21-0 Peracetic acid 1 270 67-68-5 Dimethylsulfoxide 5 340 95-76-1 3,4-dichloro-aniline 2 430 944-22-9 Fonofos 4 468 98-54-4 4-tertbutylphenol 2 521 446-72-0 Genistein 1 723 141-43-5 Monoethanolamine 1 738 1000/1000 56-38-2 Ethyl parathion 4 2962 135-19-3 2-naphthol 2 3458 1897-45-6 Chlorothalonil 4 4646 >10000 709-98-8 Propanil 1 14906
Monoethanolamine is a primary amine used as feedstock in the production of detergents, emulsifiers, polishes, pharmaceuticals, corrosion inhibitors, or chemical intermediates. One NOEC value of 1 mg/L (Oryzias latipes) was extracted from the ECHA database, along with four LC50 values (170, 349, 2070 and 2120 mg/L, on four different species: Cyprinus carpio, Carassius auratus, Pimephales promelas and Poecilia reticulata). Dimethylamine is a secondary amine also characterised by high fish LC50 values (17,
118, 120, 210, 396 mg/L, derived with three different species, Oncorhynchus mykiss, Danio rerio and Poecilla reticulata). One NOEC value of 0.6 mg/L is reported for egg mortality, which is the only one considered in our analysis as it is the only precise NOEC value reported (the other NOEC values are reported as >10 mg/L and >20 mg/L). Therefore, the difference in sensitivity here is due to the particular life stage considered for this study.
Regarding peracetic acid, nine LC50 values were reported in the ECHA database, ranging
from 0.078 to 2 mg/L and derived with three different species (Lepomis macrochirus, Oncorhynchus mykiss, Danio rerio), whereas only one NOEC value (0.0022 mg/L; Danio rerio) was reported. For diuron, a herbicide acting as photosynthesis inhibitor by blocking the plastoquinone binding site of photosystem II (Metz et al., 1986). For diuron, two LC50 values were reported (14 mg/L and 14.7 mg/L, on Pimephales promelas and Oncorhynchus mykiss, respectively) and five NOEC values (from 0.029 to 0.41 mg/L). The lowest values (0.0269 and 0.0334 mg/L) were extracted from the US EPA Ecotox database, from a single study carried out in 1987 on Pimephales promelas. The highest value was extracted from the ECHA database (0.41 mg/L) from a study carried out in 1993 on Oncorhynchus mykiss.
The herbicide propanil (also previously identified as an outlier, see chapter 4.1.2.2 and 4.2.1.2) has the highest ACR (14906). This is in line with previous work reporting an ACR of 18100 (Kenaga, 1982). This ACR is based on one LC50 entry (8.68 mg/L) and five
27
sources, as the US EPA in the Reregistration Eligibility Decision retain a NOEC value of 0.0091 mg/L (236 days), and a LC50 of 2.3 mg/L. This would result in an ACR of 252
being still considered as a high ACR but much lower than the previous one derived from our database.
Chlorothalonil was also previously identified as an outlier (see chapter 4.1.1.3 and 4.2.1.2). Its high ACR is based on one fish LC50 (0.278 mg/L) and one NOEC value
(0.00006 mg/L). This high chronic toxicity to fish, extracted from the ECOTOX US EPA database, was found in the literature (Teather et al., 2005), and is related to hatching survival of fertilised eggs after 36 days of exposure. However, when going back to the original study, it appears that 0.00006 mg/L was the only concentration tested (i.e. the concentration for which we start to observe an effect might be higher) and that the three duration schemes were 7 days, 3 weeks and 5 months and not 36 days. Therefore this data might not be reliable.
The two chemicals with the next highest ACR are the outliers previously identified with the geometric mean approach: the organophosphate pesticide ethylparathion and 2-naphthol, a widely used intermediate for the production of dyes and other compounds (MOA 2). Only one NOEC value is reported for ethylparathion (0.17 μg/L, on growth), along with two LC50 values (0.5 and 0.51 mg/L). All these data come from the same
study4, however, it was not possible to access the original reference. Regarding
2-naphtol, only one LC50 and one NOEC value are available (3.46 and 0.001 mg/L,
respectively), both extracted from the ECHA database. However, it was not possible to retrieve more details that could explain these high ACR.
3,4 dichloroaniline is a data-rich chemical with 24 NOEC values, ranging from 0.0011 to 0.23 mg/L and derived with five different fish species and 20 LC50 value, ranging from
1.94 to 13.3 mg/L. It was not possible to go back to all of the original studies but high ACR (i.e. 1200) has already been reported for this chemical in the literature (Call et al., 1987).
Fonofos ACR is based on one LC50 value (1.09 mg/L on Pimephales promelas) and one
NOEC value (0.00233 mg/L on Lepomis macrochirus) (Fairchild et al., 1992). In the same study, a LC50 of 5.3 μg/L (0.0053 mg/L) was reported for this organothiophosphate
insecticide (Lepomis macrochirus, 96h) which was not included in our database. Regarding terbutylphenol, the ACR is also based on only two data entries, one LC50 value
(5.21 mg/L) and one NOEC value (0.01 mg/L), on the same species, Pimephales promelas. The NOEC value comes from the ECHA database from an early life stage toxicity study (2008, ranked Klimisch score 1). The ECHA database also reports a LC50
value >1 mg/L.
Atrazine is another data-rich chemical with 12 NOEC values ranging from 0.0302 to 0.21 mg/L, on two different species (Pimephales promelas and Lepomis macrochirus) and different life stages (juvenile, larvae and adults). Two LC50 values are reported (20.5 and
18.8 mg/L) from two studies on two different species (Onchorynchus mykiss and Cyprinus carpio). Atrazine is a triazine herbicide which acts by binding to the plastoquinone-binding protein in photosystem II. Atrazine has also been shown to have endocrine disrupting effects (Mizota and Ueda, 2006; Prossnitz et al., 2007) including on wildlife (Hayes et al., 2003, 2002)
Dinitrotoluene is a nitroaromatic chemical used in the production of flexible polyurethane foams and as a plasticiser, deterrent coating and burn rate modifier in propellants. It is known to be toxic by converting haemoglobin into methaemoglobin and to be
4Acute and Chronic Parathion Toxicity to Fish and Invertebrates, 1981, Spacie, A. Vilkas, A. G. Doebbler, G. F. Kuc, W. J. Iwan, G. R. Technical report. Environmental Protection Agency Office of research and development, EPA-68-01-0155