VILNIUS GEDIMINAS TECHNICAL UNIVERSITY
Ruslan PACEVIČ
METHODS AND DISTRIBUTED SOFTWARE
FOR VISUALIZATION OF CRACKS
PROPAGATING IN DISCRETE PARTICLE
SYSTEMS
DOCTORAL DISSERTATION TECHNOLOGICAL SCIENCES, INFORMATICS ENGINEERING (07T)
Doctoral dissertation was prepared at Vilnius Gediminas Technical University in 2011–2015.
Scientific Supervisor
Assoc. Prof. Dr Arnas KAČENIAUSKAS (Vilnius Gediminas Technical University, Informatics Engineering – 07T).
The Dissertation Defense Council of Scientific Field of Informatics Engineering of Vilnius Gediminas Technical University:
Chairman
Prof. Dr Habil. Romualdas BAUŠYS (Vilnius Gediminas Technical University, Informatics Engineering – 07T).
Members:
Prof. Dr Habil. Rimantas BARAUSKAS (Kaunas University of Technology, Informatics – 09P),
Dr Robertas DAMAŠEVIČIUS (Kaunas University of Technology, Informatics Engineering – 07T),
Asoc. Prof. Dr Raimundas MATULEVIČIUS (Tartu University, Informatics Engineering – 07T),
Prof. Dr Olegas VASILECAS (Vilnius Gediminas Technical University, Informatics Engineering – 07T).
The dissertation will be defended at the public meeting of the Dissertation Defense Council of Informatics Engeering in the Senate Hall of Vilnius Gediminas Technical University at 9 a. m. on 20 November 2015.
Address: Saulėtekio al. 11, LT-10223 Vilnius, Lithuania.
Tel.: +370 5 274 4956; fax +370 5 270 0112; e-mail: [email protected]
A notification on the intend defending of the dissertation was send on 19 October 2015. A copy of the doctoral dissertation is available for review at VGTU repository
http://dspace.vgtu.lt and at the Library of Vilnius Gediminas Technical University (Saulėtekio al. 14, LT-10223 Vilnius, Lithuania).
VGTU leidyklos TECHNIKA 2343-M mokslo literatūros knyga
ISBN 978-609-457-855-7
© VGTU leidykla TECHNIKA, 2015 © Ruslan Pacevič, 2015
VILNIAUS GEDIMINO TECHNIKOS UNIVERSITETAS
Ruslan PACEVIČ
DISKREČIŲJŲ DALELIŲ SISTEMOSE
SKLINDANČIŲ PLYŠIŲ VIZUALIZAVIMO
METODAI IR IŠSKIRSTYTOJI
PROGRAMINĖ ĮRANGA
DAKTARO DISERTACIJA TECHNOLOGIJOS MOKSLAI, INFORMATIKOS INŽINERIJA (07T) Vilnius 2015Disertacija rengta 2011–2015 metais Vilniaus Gedimino technikos universitete.
Mokslinis vadovas
doc. dr. Arnas KAČENIAUSKAS (Vilniaus Gedimino technikos universitetas, informatikos inžinerija – 07T).
Vilniaus Gedimino technikos universiteto Informatikos inžinerijos mokslo krypties disertacijos gynimo taryba:
Pirmininkas
prof. habil. dr. Romualdas BAUŠYS (Vilniaus Gedimino technikos universitetas, technologijos mokslai, informatikos inžinerija – 07T).
Nariai:
prof. habil. dr. Rimantas BARAUSKAS (Kauno technologijos universitetas, informatika – 09P),
dr. Robertas DAMAŠEVIČIUS (Kauno technologijos universitetas, informatikos inžinerija – 07T),
doc. dr. Raimundas MATULEVIČIUS (Tartu universitetas, informatikos inžinerija – 07T),
prof. dr. Olegas VASILECAS (Vilniaus Gedimino technikos universitetas, informatikos inžinerija – 07T).
Disertacija bus ginama viešame Informatikos inžinerijos mokslo krypties disertacijos gynimo tarybos posėdyje 2015 m. lapkričio 20 d. 9 val. Vilniaus
Gedimino technikos universiteto senato posėdžių salėje. Adresas: Saulėtekio al. 11, LT-10223 Vilnius, Lietuva.
Tel.: (8 5) 274 4956; faksas (8 5) 270 0112; el. paštas [email protected] Pranešimai apie numatomą ginti disertaciją išsiųsti 2015 m. spalio 19 d. Disertaciją galima peržiūrėti VGTU talpykloje http://dspace.vgtu.lt ir Vilniaus Gedimino technikos universiteto bibliotekoje (Saulėtekio al. 14, LT-10223 Vilnius, Lietuva).
v
Abstract
Scientific visualization is becoming increasingly important in analyzing and interpreting numerical and experimental data sets. Parallel computations of discrete particle systems lead to large data sets that can be produced, stored and visualized on distributed IT infrastructures. However, this leads to very complicated environments handling complex simulation and interactive visualization on the remote heterogeneous architectures. In micro-structure of continuum, broken connections between neighbouring particles can form complex cracks of unknown geometrical shape. The complex disjoint surfaces of cracks with holes and unavailability of a suitable scalar field defining the crack surfaces limit the application of the common surface extraction methods. The main visualization task is to extract the surfaces of cracks according to the connectivity of the broken connections and the geometry of the neighbouring particles. The research aims at enhancing the visualization methods of discrete particle systems and increasing speed of distributed visualization software.
The dissertation consists of introduction, three main chapters and general conclusions. In the first Chapter, a literature review on visualization software, distributed environments, discrete element simulation of particle systems and crack visualization methods is presented. In the second Chapter, novel visualization methods were proposed for extraction of crack surfaces from monodispersed particle systems modelled by the discrete element method. The cell cut-based method, the Voronoi-based method and cell centre-based method explicitly define geometry of propagating cracks in fractured regions. The proposed visualization methods were implemented in the grid visualization e– service VizLitG and the distributed visualization software VisPartDEM. Partial data set transfer from the grid storage element was developed to reduce the data transfer and visualization time.
In the third Chapter, the results of experimental research are presented. The performance of e-service VizLitG was evaluated in a geographically distributed grid. Different types of software were employed for data transfer in order to present the quantitative comparison. The performance of the developed visualization methods was investigated. The quantitative comparison of the execution time of local Voronoi-based method and that of global Voronoi diagrams generated by Voro++ library was presented. The accuracy of the developed methods was evaluated by computing the total depth of cuts made in particles by the extracted crack surfaces. The present research confirmed that the proposed visualization methods and the developed distributed software were capable of visualizing crack propagation modelled by the discrete element method in monodispersed particulate media.
vi
Reziumė
Mokslinis vizualizavimas tampa vis svarbesniu analizuojant sudėtingas priklausomybes skaičiavimų ir eksperimentų rezultatuose. Diskrečiųjų dalelių sistemų lygiagretūs skaičiavimai generuoja didelius duomenų kiekius, kurie saugomi ir vizualizuojami išskirstytose informacinių technologijų infrastruktūrose. Dideli, geografiškai išskirstyti duomenų kiekiai reikalauja sudėtingos programinės įrangos efektyviems skaičiavimams ir interaktyviam vizualizavimui išskirstytose heterogeninėse architektūrose. Diskrečiųjų elementų metodu modeliuojant kontinuumo mikrostruktūrą, tarp dalelių nutrūkusios jungtys gali sudaryti sudėtingos formos plyšius, kurių geometrija nėra žinoma. Sudėtinga plyšių forma su skylėmis ir apibrėžiančio skaliarinio lauko nebuvimas riboja standartinių paviršių ištraukimo metodų taikymo galimybes. Vizualizuojant plyšius, reikia sukonstruoti plyšių paviršių geometriją iš tarp dalelių nutrūkusių jungčių topologijos ir kaimyninių dalelių pozicijų. Disertacijos tikslas yra patobulinti diskrečiųjų dalelių sistemų vizualizavimo metodus bei padidinti metodų realizacijos išskirstytoje programinėje įrangoje greitaveiką.
Disertaciją sudaro įvadas, trys pagrindiniai skyriai ir bendrosios išvados. Pirmajame skyriuje apžvelgta vizualizavimo programinė įranga, išskirstytosios vizualizavimo sistemos išteklių tinklo aplinkose, dalelių sistemų modeliavimas diskrečiųjų elementų metodu ir plyšių, sklindančių dalelių sistemose, vizualizavimo metodai. Antrajame skyriuje detaliai aprašomi metodai sukurti vizualizuoti plyšius, kurie sklinda monodispersinėse dalelių sistemose, modeliuojamose diskrečiųjų elementų metodu. Pažeistuose regionuose celių kirtimo, Voronoi dekompozicijos ir celių centrų metodai geometriniais primityvais apibrėžia sklindančių plyšių geometriją. Sukurti plyšių vizualizavimo metodai įdiegti vizualizavimo e. paslaugoje VizLitG ir išskirstytojoje vizualizavimo sistemoje VisPartDEM. Dalinio duomenų rinkinio parsiuntimo iš išteklių tinklo duomenų saugyklos paslauga įdiegta VizLitG siunčiamų duomenų kiekiui sumažinti ir vizualizavimui pagreitinti.
Trečiajame skyriuje aprašomi eksperimentinių tyrimų rezultatai. E. paslaugos VizLitG greitaveika ištirta geografiškai išskirstyto išteklių tinklo atveju. Pateikti duomenų siuntimo skirtinga programine įranga iš išteklių tinklo duomenų saugyklos tyrimai. Skyriuje pateikti plyšių vizualizavimo metodų greitaveikos ir tikslumo kiekybiniai palyginimai. Voronoi dekompozicijos metodo realizacijos greitaveika palyginta su Voro++ bibliotekos greitaveika. Plyšių vizualizavimo metodų tikslumas įvertintas apskaičiavus bendrą sukonstruotų paviršių įsiskverbimo į daleles gylį. Tyrimų rezultatai parodė, kad pasiūlyti vizualizavimo metodai ir sukurta programinė įranga tinka vizualizuoti plyšiams sklindantiems monodispersinėse dalelių sistemose.
vii
Notations
Abbreviations
API – Application Programmin Interface; CPU – Central Processing Unit;
DEM – Discrete Element Method GB – Gigabyte;
GHz – Gigahertz;
GLSL – OpenGL Shading Language; GPU – Graphics Processing Unit; GridFTP – Grid File Transfer Protocol; GUI – Graphical User Interface; HDD – Hard Disk Drive;
HDF – Hierarchical Data Format;
HTTPS – Hypertext Transfer Protocol Secure; JAX-WS – Java API for XML Web Services; LFC – Logical File Catalog;
viii
MB – Megabyte;
MHz – Megahertz;
MIME – Multipurpose Internet Mail Extensions; MPI – Message Passing Interface;
MVE – Multi-View Environment; PC – Personal Computer; RAM – Random-Access Memory; SE – Storage Element;
SOAP – Simple Object Access Protocol; SSL – Secure Sockets Layer;
vGPU – Virtual Graphics Processing Unit; XML – Extensible Markup Language.
ix
Contents
INTRODUCTION ... 1
Problem Formulation ... 1
Relevance of the Thesis ... 2
The Object of the Research ... 2
The Aim of the Thesis ... 3
The Objectives of the Thesis ... 3
Research Methodology ... 3
Scientific Novelty of the Thesis ... 3
Practical Value of the Research Findings ... 4
The Defended Statements ... 4
Approval of the Research Findings ... 4
Dissertation Structure ... 5
1. OVERVIEW OF DISTRIBUTED VISUALIZATION SYSTEMS AND VISUALIZATION METHODS ... 7
1.1. Overview of Visualization Software ... 7
1.2. Distributed Environments for Visualization ... 10
1.3. Discrete Particle Systems ... 14
1.4. Extraction and Visualization of Crack Surfaces ... 18
x
2. VISUALIZATION METHODS AND DISTRIBUTED SOFTWARE FOR
DISCRETE PARTICLE SYSTEMS ... 23
2.1. Cell Attribute- and Cell Cut-based Methods ... 23
2.1.1. Cell Attribute-based Method... 24
2.1.2. Cell Cut-based Method ... 28
2.2. Voronoi-based Method ... 32
2.3. Cell Centre-based Method ... 38
2.4. Distributed Visualization Software ... 40
2.4.1. Grid Visualization e-service VizLitG ... 41
2.4.2. Distributed Visualization Software VisPartDEM ... 44
2.5. Implementation of Crack Visualization Methods ... 46
2.6. Conclusions of Chapter 2 ... 49
3. EXPERIMENTAL RESEARCH ON THE PROPOSED VISUALIZATION METHODS AND THE DEVELOPED SOFTWARE... 51
3.1. Description of Visualized Data Sets ... 51
3.2. Performance of Distributed Visualization Software and Partial Data Set Transfer ... 57
3.2.1. Performance of VizLitG Including Partial Data Set Transfer ... 57
3.2.2. Performance of VisPartDEM Including Parallel Visualization ... 66
3.3. Performance of Crack Surface Generation and Visualization ... 71
3.3.1. Visual Results of the Proposed Methods ... 71
3.3.2. Performance Analysis ... 76
3.3.3. Accuracy ... 85
3.4. Conclusions of Chapter 3 ... 86
GENERAL CONCLUSIONS ... 89
REFERENCES ... 91
A LIST OF SCIENTIFIC PUBLICATIONS BY THE AUTHOR ON THE TOPIC OF THE DISSERTATION ... 99
SUMMARY IN LITHUANIAN ... 101
ANNEXES1 ... 115
Annex A. Declaration by the author of the thesis ... 116
Annex B. The coauthor’s agreements to present publications for the dissertation defence ... 117
Annex C. Copies of scientific publications by the autor on the topic of the dissertation ... 121
1
Introduction
Problem Formulation
Visualization plays an important role in the numerical analysis cycle, which consists of data preparation, computations, graphical analysis of the numerical results and further correction of design variables (Hansen et al. 2005). Numerical simulations of discrete particle systems (Cundall et al. 1979) and modern physical experiments lead to large data sets that present challenges to researchers. Scientific visualization is becoming increasingly important in analyzing and interpreting numerical and experimental data sets to make decisions in high technology design. However, large data sets and a complex visualization process present challenges to the developers of interactive visualization systems. Distributed visualization allocates different parts of the machine processing and the provided services to different computers in order to improve performance. A lot of industrial applications are solved on computer clusters and grid. With the power of the grid, scientists are able to perform simulations at previously impossible and unexplored problem scales. However, this leads to very complicated environments handling complex simulation and interactive visualization on the remote heterogeneous architectures.
Discrete particle computations are based on the positions of particles and forces acting between them (Cundall et al. 1979). 1D connections between
2 INTRODUCTION
neighbouring particles are not well suited for the reliable interpolation and common visualization methods used in 3D. Micro-structure of continuum can be modelled by discrete particle system and the defects between the pairs of the neighbouring particles are identified via the broken connections (Rojek et al. 2011). The defects can form complex cracks of unknown geometrical shape. The main visualization task is to extract the surfaces of cracks according to the connectivity of the broken connections and the geometry of the neighbouring particles. The complex disjoint surfaces of cracks with holes and unavailability of a suitable scalar field defining the crack surfaces limit the application of the widely used surface extraction methods. Moreover, the fixed connectivity of the moving particles prevents direct application of the commonly used methods for generation of Voronoi decompositions (Aurenhammer 1991) or Delaunay triangulations (Amenta et al. 2001).
Relevance of the Thesis
Visualization is used for analyzing the data and presenting the results across a wide range of disciplines in science and industry (Hansen et al. 2005). However, large data sets and a complex visualization process require considerable development efforts and impressive computing resources. Distributed visualization systems and services for analysis of large data sets are deployed on modern IT infrastructures, such as computer clusters, grids and clouds. Efficient data transfer between remote components of distributed infrastructure is very important in order to achieve interactive visualization rates.
Fracture of materials presents challenge for visualization as well as for a wide range of other multi-disciplinary sciences. Cracking is a very common phenomenon investigated by a wide research community in different scientific areas (Gobron et al. 2001). Crack formation is often observed in building constructions, in ceramics (Uematsu 2014), in drying processes (Kitsunezaki 2011) and in complicated failure of powder agglomerates (Khanal et al. 2009). The absence of the explicitly defined crack surfaces limits a visual analysis of the computed results and complicates the understanding of the investigated fracture phenomena. Moreover, the crack surface geometry accurately defined by graphics primitives can be exported to engineering software for following analysis at the macro-level.
The Object of the Research
The object of research – visualization of discrete particle systems by using distributed software.
INTRODUCTION 3
The Aim of the Thesis
The research aims at improving the visualization methods of discrete particle systems and increasing speed of distributed visualization software.
The Objectives of the Thesis
In order to achieve the aim, the following have to be solved:
1. To analyze technologies of distributed visualization software and visualization methods for extraction of crack surfaces from discrete particle systems.
2. To develop software implementation, which allows reducing communication between remote components of gLite/EMI grid infrastructure, and investigate its performance.
3. To develop visualization methods for extraction of crack surfaces from discrete particle systems.
4. To implement the developed methods into distributed visualization software.
5. To investigate and compare the speed of the implementation of the developed visualization methods.
6. To investigate the accuracy of the developed visualization methods.
Research Methodology
Methods of comparative and literature analysis methods were used to analyze the research object. Methods of computer graphics and computational geometry are used to develop visualization methods for crack propogating. The methods of experimental research have been used for examining performance of proposed methods and developed software.
Scientific Novelty of the Thesis
The main scientific contributions of the presented research are as follows: 1. The original implementation of partial data set transfer from gLite/EMI
grid storage elements has been developed to reduce the communication between remote components of grid infrastructure in the case of interactive visualization.
2. Novel visualization methods based on Voronoi and geometric cell centre decompositions have been proposed for extraction of crack surfaces from monodispersed particle systems. The local decompositions must be
4 INTRODUCTION
constructed according to the fixed connectivity of the moving particles, therefore, the commonly used methods for generation of Voronoi decompositions or Delaunay triangulations cannot be applied.
Practical Value of the Research Findings
The designed visualization software is employed for analysis of computational results of large discrete particle systems that can be useful for developing high technology in Lithuania. The novel Voronoi and cell centre-based methods can be used by researchers of fracture mechanics and the material sciences to speed–up the design of new structures and materials. Moreover, the commercial finite element analysis software, which is widely used by engineers, can import only continuously defined crack surfaces represented by curves or polygon meshes. The successful research into the problems of extraction and visualization of crack surfaces can help to fill the gap between the industrial requirements and the research results. The developed methods are implemented in the software, which is investigated in the project “Research and development of technologies for virtualization, visualization and security e-services” (VP1-3.1-ŠMM-08-K-01-012).
The Defended Statements
1. The developed partial data set transfer from gLite/EMI grid storage elements is able to decrease visualization time reducing the data size transferred between remote components of grid infrastructure.
2. The proposed visualization methods are capable of extracting crack surfaces and visualizing crack propagation modelled by the discrete element method in monodispersed particulate media.
Approval of the Research Findings
Research results related to the dissertation subject are published in 6 scientific publications. Three of them are published in reviewed scientific journals and are included in the Thomson Reuters Science Citation Index.
The results of the diseration were presented at five conferences. Four of them are presented at international scientific conferences:
• The Fourth International Conference on Parallel, Distributed, Grid and Cloud Computing for Engineering (PARENG2015). March 24–27, 2015, Dubrovnik, Croatia.
• 7th World Congress on Particle Technology (WCPT7), 2014 May 19–22, Beijing, China.
INTRODUCTION 5
• The Third International Conference on Parallel, Distributed, Grid and Cloud Computing for Engineering (PARENG2013), 2013 March 25–27, Pécs, Hungary.
• 18th International Conference on Information and Software Technologies (ICIST 2012). September 13–14, 2012, Kaunas, Lithuania.
• LMA IIth conference of young scientists on “Fizinių ir technologijos mokslų tarpdalykiniai tyrimai”. February 14, 2012, Vilnius, Lithuania.
Dissertation Structure
The dissertation consists of introduction, three main chapters, general conclusions, references, a list of publications by the author on the topic of the dissertation and a summary in Lithuanian. The total scope of the dissertation is 126 pages, 10 equations, 63 figures and 6 tables. For the purpose of the present dissertation, references were made to 110 source papers.
7
1
Overview of distributed visualization
systems and visualization methods
In this Chapter a literature review on state-of-the-art visualization software, distributed environments and common visualization techniques is presented. Discrete Element Method (DEM) for crack propagation in discrete particle systems is introduced to formulate crack visualization problem and to discuss output datasets and resulting difficulties. Finally, surface extraction and crack visualization methods that can be applied in the case of DEM are reviewed and discussed.
Parts of this Charpter are published in (Kačeniauskas and Pacevič 2011), (Pacevič et al. 2013), (Pacevič, Kačeniauskas, et al. 2015), (Kačeniauskas et al. 2012), (Kačeniauskas et al. 2013), (Pacevič and Kačeniauskas 2015).
1.1. Overview of Visualization Software
Visualization is used for analyzing the data and presenting the results across a wide range of disciplines (Hansen et al. 2005). Computers are used to create visual images from the data, while the human mind is used to make inferences from this imagery in order to better understand the data. Some standalone visualization
8 1. OVERVIEW OF DISTRIBUTED VISUALIZATION SYSTEMS METHODS
systems, toolkits and packages should be overviewed in order to choose the most appropriate platform for the efficient development of distributed visualization systems. In the dawn of the visualization era, creating visualizations meant programming using a low-level graphics library. A new approach was brought forward by the Application Visualization System (AVS) (Favre et al. 2005). AVS (later called AVS Express) is a modular visualization environment (MVE) providing an application development environment for visualization using a visual network editor. Over 800 developed modules are available in AVS/Express visualization system. Other MVEs have significantly smaller number of modules (about 200). AVS/Express Multipipe Edition is a version of AVS/Express, which contains multi-pipe rendering extensions for use in virtual environments. It is targeted at high-level SGI systems running IRIX and clusters of Windows-based PCs.
OpenDX (Thompson et al. 2000) is a modular visualization system based on the dataflow model. The visualization pipeline is processed by the modules of the dataflow graph, which are arranged according to the desired output. This MVE originally began as the IBM commercial product Visualization Data Explorer, but was offered by IBM as an Open Source project in 1999. OpenDX is the best-known open-source package in the category of MVEs. High efficiency of the software is achieved by optimized cashing and hardware rendering by means of OpenGL (Shreiner et al. 2013). OpenDX can access modules on remote hosts by DXLink. Distributed memory architectures can be employed as well as shared memory supercomputers.
IRIS Explorer (Foulser 1995) is another MVE based on the dataflow model. IRIS Explorer uses Open Inventor (Wernecke 1994) for lower level rendering. The system provides a large selection of modules, listed in the Librarian, which the user launches into the workspace (Map Editor) and connects together with wires to form a dataflow pipeline, or map. The system can be extended by users adding their own code as modules and integrating them into IRIS Explorer using the provided API. This system provides a mechanism to allow modules within a pipeline to be run on a number of remote computing resources. IRIS Explorer transparently manages the data transfer between resources as the data passes along the pipeline, using shared memory for modules connected together on the same host and through sockets for modules connected across host boundaries.
SCIRun (Parker et al. 1995) is an MVE developed at the Scientific Computing and Imaging (SCI) Institute at University of Utah. It allows the user to connect a set of pre-written routines together in a workspace to form a dataflow network. These routines execute as independent threads within a single executable in contrast to other MVEs, which run modules as individual processes. SCIRun has been targeted at shared memory parallel systems. To extend beyond this limitation, more recent implementations of SCIRun have employed “bridging”.
1. OVERVIEW OF DISTRIBUTED VISUALIZATION SYSTEMS METHODS 9
SCIRun has been used for computational steering within the Uintah, which is designed to run on massively parallel distributed memory architectures.
Visapult (Bethel et al. 2000) is a visualization framework with the ability to render a huge amount of data sets (of the order of 1-5 Tb). Visapult uses parallel rendering hardware to carry out the high speed rendering processes. Using Cactus (Thomas et al. 2010) the data are distributed amongst many parallel nodes for volume rendering. The rendered subset of 2D image is sent to the client for local rendering.
Chromium (Humphreys et al. 2002) is an open source graphics library, which allows distributed network rendering for OpenGL applications. It does this by intercepting OpenGL API calls (Shreiner et al. 2013), and then modifying, deleting, replacing or augmenting them. Thus, for distributed rendering, the commands are split across a collection of graphics cards. A particular feature of Chromium is that it is non-invasive, because no modification or even recompiliation of the application is required.
pV3 (Haimes 1994) is a library for the real-time visualization of large-scale transient (unsteady) systems. Based on an earlier system called Visual3, it has been re-designed specifically for the multi-processing visualization of data generated in a distributed compute arena. One of its design goals is to allow the compute solver to run as independently as possible thus for example, pV3 can be configured to plug into the simulation, display the transient data, and unplug from the calculation. pV3 provides a centralized interface to a distributed computation. Computational steering is also supported by pV3.
Covise (Collaborative Visualization Environment) (Wright et al. 1997) falls into the modular visualization environment category. It allows a user to run modules both locally and remotely, employing a data manager process on each host to manage the flow of data beween modules. Like other distributed MVEs, such as IRIS Explorer (Foulser 1995), modules connected together on the same host communicate data through shared memory, while modules connected beween hosts pass data via the local data managers. A company named Vircinity is marketing several versions of Covise that offers collaborating visualization.
Ensight (CEI 2009) is a standalone application aimed at the visual analysis and post-processing of engineering data. An advanced version of the package (called Ensight Gold) incorporates extra features for handling large data sets including parallel processing, multi-pipe rendering for output to immersive environments, and collaboration. Ensight offers a standard set of visualization and plotting algorithms with interfaces to several engineering solvers for CFD and FEA problems but, being aimed at end-users rather than developers, is not extensible. No new algorithms can be added, although users can create their own readers to import data in custom formats.
10 1. OVERVIEW OF DISTRIBUTED VISUALIZATION SYSTEMS METHODS
Amira (Stalling et al. 2005) is an highly interactive object-oriented visualization system, based on Open Inventor (Wernecke 1994). Unlike many of the other visualization systems, it is not based on a dataflow model. Because data are passed between modules as C++ objects (as in a normal C++ program), there is no overhead for module communication. Users can extend Amira (adding new modules, data classes, editors and I/O methods) by deriving from an existing C++ class. Amira users create applications via a visual programming interface by connecting Amira modules together.
VisAD (Hibbard et al. 2005) is a Java component library for interactive and collaborative visualization and analysis of numerical data. It makes use of Java’s RMI technology, which allows methods of remote Java objects to be invoked from other Java virtual machines, possibly on different hosts. VisAD applications can run in any of three networked modes: standalone, server or client. The construction of distributed applications in VisAD is facilitated by its event-driven design.
VTK (Kitware 2010; Schroeder et al. 2006) is an open source, object– oriented software system providing a toolkit for 3D computer graphics, image processing and visualization. It consists of a C++ class library, together with several interface layers including Tcl/Tk, Java and Python, which can be used to access the classes and build applications. More than 2000 separate classes, including several hundred data processing filters, are available in the toolkit. VTK supports a wide variety of visualization algorithms including scalar, vector, tensor, texture, and volumetric methods; and advanced modelling methods like implicit modelling, polygon reduction, mesh smoothing, cutting, contouring and Delaunay triangulation. VTK is based on the dataflow model supporting reference counting, which allows data to be shared instead of duplicated. Modules are connected with each other to form a visualization pipeline. VTK supports portable multithreading for shared memory implementation and portable distributed parallel processing based on MPI (Gropp et al. 1996). Likewise, a sort-last, parallel rendering class is provided that uses inter–processor communication to collect and then composite parallel renderings into a final image (Moreland et al. 2001). An open-source, turnkey application ParaView (Ayachit 2015), designed for large data visualization using distributed parallel processing, is built on the top of VTK.
1.2. Distributed Environments for Visualization
Scientific visualization is becoming increasingly important in analyzing and interpreting numerical and experimental data sets. However, large data sets and a complex visualization process require considerable development efforts and
1. OVERVIEW OF DISTRIBUTED VISUALIZATION SYSTEMS METHODS 11
impressive computing resources. Distributed visualization allocates different parts of the machine processing to different computers.
Grid Visualization Kernel (GVK) (Kranzlmuller et al. 2002) based on the Globus middleware (Foster et al. 2001) has been developed in EU CrossGrid project (2002). In concrete, the concept of GVK can be divided into two main parts: the interface between the simulation and the visualization, and the implementation of the visualization pipeline. The interface to GVK is established via available visualization toolkits. Well known example is the OpenDX visualization software (Thompson et al. 2000). The difference between the traditional approach and the GVK visualization services is that some modules of the dataflow graph are replaced by corresponding GVK modules. The advantage of this approach is that it enables the user to define arbitrary visualization pipeline configurations using the well-known dataflow approach. The pipeline can be split at any point, and the processing modules can be distributed across the grid as desired.
The portal GridSphere (Russell et al. 2004) providing interface for grid visualization was developed in the FP5 GridLab project (2003–2005). Data Management and Visualization Work package of the project provides the services that are needed by the grid to manage public and user-private files and creates a framework that enables applications to stream data for visualization purposes.
A lot of scientific applications of visualization (Wood et al. 2007) were demonstrated in projects supported by UK e-Science Core Programme. gViz (Visualization Middleware for e-Science) (Brodlie et al. 2003) had two main targets: first, to grid-enable two existing visualization systems, IRIS Explorer (Foulser 1995) and pV3 (Haimes 1994), so that visualization tools are available as early as possible for users of computational GRID; second, to develop some longer term thinking on distributed and collaborative visualization, where XML languages (Evjen et al. 2007) are used to describe visualization data, and visualization programs themselves. The modules of IRIS Explorer in a network can be distributed across a set of grid resources (Li et al. 2005), but controlled from the desktop. This is achieved in a secure manner using Globus middleware (Foster 2005). The COVISA (Wright et al. 1997) collaborative facilities become immediately available. An important application of this is in computational steering, where the simulation model runs on a remote server, but is controlled from the desktop. The grid-enabled version of pV3 is created by replacing its PVM-based communications with a web service mechanism using the gSOAP package (Robert A. Van Engelen 2002). The distributed computation provides a web service offering data for visualization and the pV3 “servers”, then connect to this as web service clients. gSOAP provides an efficient C/C++ web service implementation. The use of an XML language to describe visualization data
12 1. OVERVIEW OF DISTRIBUTED VISUALIZATION SYSTEMS METHODS
promises to lead to better inter-operability of visualization systems, and the more effective development of new visualization software.
The grid-Aware Portals toolkit (GAPtk) project (Nagella et al. 2005) aimed to provide scientists with a set of visualization utilities based on the Web and grid services (Li et al. 2005) model along with appropriate APIs that will enable them to exploit the power of the grid their data analysis. The layered architecture of the toolkit consists of a set of interfaces on the client side, which talks to the GAPtk server using SOAP (Englander 2002); the server communicates with the grid using Globus (Foster 2005). The toolkit was used to provide visualization capabilities within the GODIVA project, which was investigating ocean circulation and its effect on climate change.
The main aim of the project Visual beans (Cooper 2002) was to investigate the role of component technology together with advanced middleware platforms to support the construction of dynamically adaptable distributed cooperative visualization software. The project developed and extended a middleware platform called TOAST (which is CORBA-based (Brose et al. 2001)). A number of experimental systems were constructed as demonstrators and proof-of-concept implementations of the framework and visualization components, the latter constructed using VisAD visualization software (Hibbard et al. 2005).
The goal of the ICENI (Mayer et al. 2005) project was the provision of high-level abstractions for scientific computing, which will allow users to construct and define their own applications through a graphical composition tool. The project aimed to deliver this environment across a range of platforms and devices on the grid using a scheduling service. ICENI was being implemented in Java and JINI, but was able to interoperate with the Open Grid Services Architecture (OGSA). One of the applications of ICENI is computational steering and visualization (Stanton et al. 2002). The ICENI framework is used to link together a visualization client and server, and to pass data to the server from a running application. The visualization server hands the data off to a renderer (current demos are based on VTK (Kitware 2010)), which can then send the graphical output back to the visualization client. This can either be done using standard OpenGL remote rendering, or using Chromium (Humphreys et al. 2002). The ICENI project has also made use of the way Chromium can be configured with the ACE networking framework (Schmidt 2009) in order to send its graphics as a video stream directly to a multicast address; this effectively provides a bridge between Chromium’s distributed rendering and the Access Grid.
VISPORTAL (Bethel et al. 2003) was built by upon the Grid Portal Development Toolkit (GPDK) (Novotny 2002). The Visualization Group of Lawrence Berkeley National Laboratory and National Energy Research Scientific Computing Center efforts explores ways to deliver advanced remote/distributed
1. OVERVIEW OF DISTRIBUTED VISUALIZATION SYSTEMS METHODS 13
visualization capabilities through a Grid-enabled web-portal interface. The effort focuses on latency tolerant distributed visualization algorithms and GUI designs that are more appropriate for the capabilities of web interfaces. The developed clients involve very thin GUIs such as Java applets lauched by the web-browser on the client machine that provide a front-end for massively parallel or distributed/multi-tier visualization back-ends like Visapult (Bethel et al. 2000) or offscreen rendering pipe access. Finally, the thick clients simply use the portal as a broker for locating remote data or services that extend the capabilities of a standalone tool like OpenDX (Thompson et al. 2000) or AVS Express (Favre et al. 2005). Eventually the VisPortal framework will migrate to a portlet OGSA model offered by GridSphere (Russell et al. 2004).
Cactus (Thomas et al. 2010) is an open source problem solving environment designed for scientists and engineers. Cactus consists of a central core component, called the flesh, and a set of modules called thorns. The thorns implement a range of computational codes, which can run on distributed computing resources while being connected to, and orchestrated by, the flesh. The flesh controls when thorns will execute and how data is routed between them. Cactus builds on the Globus Toolkit (Foster 2005) to provide secure access to remote resources, together with secure communications and job scheduling on remote resources. It also uses a number of other standard libraries and toolkits such as PETSc (Brune et al. 2014) for scientific computation and HDF5 (Folk et al. 2011) for data output. Visualization is provided via standard products such as OpenDX (Thompson et al. 2000), Amira (Stalling et al. 2005) and IRIS Explorer (Foulser 1995). These systems effectively operate as thorns connected to the Cactus system via special modules written for each system, which are able to read the data formats exported by Cactus (for example, HDF5) using the Cactus API.
RealityGrid (RealityGrid 2005) was a project, which aims to examine how scientists in the condensed matter, materials and biological sciences communities can make more effective use of the distributed computing and visualization resources provided by the grid. RealityGrid is making use of visualization as part of distributed applications in which the simulation in one place communicates with the visualization in another and a steering client in a third. The RealityGrid steering architecture is built around a library, calls to which are embedded into each of the three components (simulation, visualization and client). Because of difficulties experienced in integrating existing MVEs into larger distributed applications, RealityGrid has selected VTK (Kitware 2010; Schroeder et al. 2006) as a lower-level environment, along with enabling technologies such as VizServer (SGI 2009) and Chromium (Humphreys et al. 2002). In addition, ICENI, which use much of the same technology is being used to enable collaborative visualization and computational steering within RealityGrid.
14 1. OVERVIEW OF DISTRIBUTED VISUALIZATION SYSTEMS METHODS
Grid Visualization System (Naregi 2005) for distributed massive datawas developed in by National Institute of Informatics and NEC in 2005. Generalized
grid visualization services were adopted for various visualization functionalities provided by various visualization tools. Image based remote parallel visualization based on MPI was employed. FUJITSU corporation developed collaborative visualization grid environment VizGrid (Matsukura et al. 2004) for natural interaction between remote researchers.
The NVIDIA grid hardware serves as the foundation for their on-demand Gaming as a Service (GaaS) solution. NVIDIA GRID vGPU (Nvidia 2014) technology brings the benefit of NVIDIA hardware-accelerated graphics to virtualized solutions on cloud infrastructures (Mohammad et al. 2012). Amazon EC2 GPU Instance Type G2 provides graphics as a service (Yegulalp 2013) on AWS cloud platform that includes Nvidia GPUs.
1.3. Discrete Particle Systems
The discrete element method (DEM) referred to the original work of Cundall and Strack (Cundall et al. 1979) has been extensively used in numerical analyses of discrete particle systems from the perspective of science and engineering. The main advantage of the DEM is a possibility to model highly complex discrete particle systems using the basic data on individual particles and avoiding oversimplifying assumptions of continuum. The method allows the simulation of motion and interaction between the particles, taking into account the microscopic geometry and various constitutive models.
The DEM has been extensively applied to examine different phenomena inside the granular materials. The granular flow from hoppers and silos has a wide range of applications in industry (Zhu et al. 2008). The study of the bulk material pressure on the walls of a hopper is very important for hopper design (Goda et al. 2005). The prediction of the discharge rate is of importance for the effective operation and control of a transport system and is difficult due to inhomogeneous solid distribution, irregular velocity profile and diverse particle size (Kruggel et al. 2009). It is very important to understand the microscopic structure and its relations to the governing mechanisms (Parisi et al. 2004). DEM simulation takes into account the discrete nature of granular materials, and therefore is very effective for this purpose. The combined approach of DEM and averaging method offers a convenient way to link fundamental understanding generated from DEM-based simulations to engineering application often achieved by continuum modelling (Zhu et al. 2007). Over the past decade, the DEM was utilised in a variety of industrial applications (Cleary 2009; Radeke et al. 2010).
1. OVERVIEW OF DISTRIBUTED VISUALIZATION SYSTEMS METHODS 15
The main advantage of using DEM for simulation of granular systems is that, by tracking the motion of each individual particle, the detailed information about the system behaviour across a range of time- and length-scales can be obtained. However, the simulation of systems at this level of detail has the disadvantage of making DEM computationally very expensive. DEM simulations on a single workstation or ordinary PC tend to be limited to systems of several tens of thousands of particles and short time intervals. The recent simulation of large-scale systems is performed by employing the parallel computation techniques, though the number of the used particles was still much smaller than that required in industry where typically over a billion particles are dealt with. Distributed or parallel DEM computations have become an obvious option for rapidly increasing computational capability, along with recent remarkable advances in distributed software systems and computational infrastructures like computer clusters, grids and clouds.
Several different particle- and lattice-based approaches (Zhu et al. 2008) have been developed in the frame of DEM applied to the simulation of solids and structures. Particle-based approach (Kačianauskas et al. 2010; Walther et al. 2009) is, actually, a rather straightforward extension of the original DEM. A solid is replaced with a composition of discrete particles, where the presence of the cohesive forces acting between the particles and various mechanisms of their linkage and detachment may be allowed (Markauskas et al. 2009). The approach, where the continuum may be represented by the material particles, interacting via the network elements, is referred to as the lattice-based model. A comprehensive review of the planar elastic lattice models for micro-mechanical applications is given by (Ostoja-Starzewski 2002). The lattice-based DEM (Kozicki et al. 2008; Lilliu et al. 2003) has been extensively applied to the simulation of heterogeneous solids to study their dynamic deformation behaviour and fracture problems. The simplest lattice – based DEM models for continuum exhibit structural analogy and equivalence to frame or truss structures that are widely modelled by the finite element method (Barauskas et al. 2004). However, the lack of highly accurate and reliable solutions at the industry level limits the use of DEM models in the commercial codes.
The dynamic behaviour of the non-cohesive frictional visco-elastic particle system can be simulated by the discrete element method. This system consists of the finite number of deformable spherical particles with the specified size distribution and material properties. Any particle i in the system of N particles undergoes the translational and rotational motion, involving the forces and torques originated in the process of their interaction. Although a description of the translational motion is always independent of the particle shape and is written in a linear form, the rotational motion is of the same character only for a perfectly symmetric shape, such as sphere, where the inertia tensor is defined by a single
16 1. OVERVIEW OF DISTRIBUTED VISUALIZATION SYSTEMS METHODS
parameter. Finally, the motion of the i-th contacting spherical particle in time t is described as follows: i i i
dt
d
m
x
=
F
2 2 (1.1) i i i dt d I θ =T 2 2 (1.2) where mi, and Ii are the mass and the moment of inertia of the particle,respectively, while vectors xi and θi define the position of the particle centre and the orientation of particle i. The vectorsFi and Ti present the sum of the contact force and the gravity force as well as the respective torques:
g F F i N i j j cont ij i =
∑
+m ≠ =1, , (1.3)∑
∑
≠ = ≠ = × = = N i j j cont ij cij N i j j ij i , 1 , , 1 F d T T (1.4)where g is the acceleration due to the gravity, dij is the vector pointing from the
particle centre to the contact centre. The interparticle force vector Fij,cont ,
describing the contact between the particles i and j, may be expressed in terms of normal and tangential components. The normal component, presenting a repulsion force, comprises elastic and viscous ingredients, while the tangential component reflects static or dynamic frictional behaviour. The static force describes friction prior to gross sliding and comprises elastic and viscous ingredients, while the dynamic force describes friction after gross sliding and is expressed by the Coulomb’s law.
For evaluating the contact forces (1.3–1.4), all contacts between the particles and their neighbours must be detected. A cell-based method (Han et al. 2007) is used for contact detection. The numerical integration of the equations of motion (1.1–1.2) is performed to obtain the dynamical state of all particles at the time t, resulting from the action of the particle forces (1.3–1.4). The solution of these equations is obtained by using the Verlet scheme.
The materials can be modelled using the elastic perfectly brittle model of contact interaction. The lattice-based discrete element model assumes cohesive bonding between the neighbouring particles (Rojek et al. 2011). These lattice connections represented by springs can be broken under excessive loading, which allows us to simulate initiation and propagation of the material fracture. When
1. OVERVIEW OF DISTRIBUTED VISUALIZATION SYSTEMS METHODS 17
two particles are bonded, the contact force in normal direction is calculated from the linear constitutive relationships:
n n n, cont
=
k
u
F
(1.5)where Fn,cont is the normal contact force, kn is the spring stiffness in the normal
direction, un is the normal relative displacement. The lattice connections are
broken instantaneously, when the interface strength is exceeded in the normal direction by the tensile contact force. The failure criterion can be written as:
n n, cont
≤
R
F
(1.6)where Rn is the interface strength in the normal direction. Although a compressive
interaction force between the particles does not cause breakage of the connections, the material damage under macroscopic compression can be represented properly in the particle model. A compressive macroscopic load brings about tensile interactions at the microscopic level, which may lead to connection failures.
After breakage of connections, a normal contact force is calculated, using the Hertz contact model (Zhu et al. 2008). A frictional interaction can occur among the particles in the case of compression. The limiting friction force is evaluated, assuming the Coulomb model of friction:
n, cont t, cont
F
F
=
µ
(1.7)where µ is the Coulomb friction coefficient. The simple mathematical model (1.1–1.7) of the lattice-based DEM is provided for the sake of completeness. However, the simulation results will not be examined in detail because the presented research is concentrated on the surface extraction and the proposed visualization methods.
18 1. OVERVIEW OF DISTRIBUTED VISUALIZATION SYSTEMS METHODS
DEM computations are based on the positions of particles and forces acting between them. The lattices (Figure 1.1) employed in DEM computations are assembled from the 1D springs or beams, which are not well suited for the reliable interpolation and common visualization methods used in 3D. The data sets of DEM include the positions, velocities and accelerations of particles as well as their radii and material properties. The 1D connections between the neighbouring particles represent the lattice topology. The fracture force limit and various forces are used as the attributes of the connections. The most important attribute array named the connection state indicates, when the lattice connection is broken.Based on the described approach, the defects between the pairs of the neighbouring particles are identified by the broken lattice connections (Lilliu et al. 2003; Vadluga et al. 2009).
1.4. Extraction and Visualization of Crack Surfaces
Cracking is a very common phenomenon investigated by a wide research community in different scientific areas (Gobron et al. 2001). Crack formation is often observed in ceramics made through powder compaction process (Uematsu 2014), in drying processes (Kitsunezaki 2011), in soil (Valette et al. 2006) and in complicated failure of powder agglomerates (Khanal et al. 2009). Geometric models propose the algorithms for obtaining crack patterns close to those produced by nature. The fracture models can be mapped onto the surface of the object, while fractures are created procedurally (Gobron et al. 2001). In contrast, physical approaches propose the models, which tend to accurately simulate the dynamics of natural crack patterns. Federl and Prusinkiewicz (Federl et al. 2004) used a physical approach to fracture modelling based on the finite element method. Gobron and Chiba (Gobron et al. 2001) proposed a different approach for simulating realistic propagation of various types of cracks on any triangulated surface, which was based on their 3D cellular automaton model. O’Brien et al. (Iben et al. 2009) succeeded in modelling brittle and ductile fractures by means of the finite element method. Iben and O’Brien have extended the previously presented methods in order to address the issue of quasi–static fractures (Iben et al. 2009). The surface is discretized by means of the finite element method and any 3D mesh can be cracked with an heuristic definition of stress fields. A dynamic model of cracks development based on a 3D discrete shrinkage volume propagation is proposed by Valette et al. (Valette et al. 2008). The DEM provided the valuable insight into the fracture phenomena at the particle level (Rojek et al. 2011; Vadluga et al. 2009). Researchers used this method to study the damage of heterogeneous solids such as concrete (Khanal et al. 2009) or rock (Rojek et al.1. OVERVIEW OF DISTRIBUTED VISUALIZATION SYSTEMS METHODS 19
2011) and homogeneous materials such as ceramics (Tan et al. 2009) or glass (Zang et al. 2007).
The problem of reconstructing a surface from a set of sample points is motivated by numerous applications and, consequently, has always been a popular field of research. Most surface reconstruction methods roughly fall into two major categories: implicit surface methods (Fleishman et al. 2005; Kolluri 2008; Rosenthal et al. 2008) and Delaunay-based methods (Amenta et al. 2001; Dey et al. 2003; Labatut et al. 2009). A surface can be implicitly defined as a level-set of the function allowing smooth and approximating surface reconstruction. Moving least squares can handle a moderate amount of noise and be used to define the implicit functions with the signed distance to local planes as local approximants. Therefore, reconstruction guarantees are provided for sufficiently dense and uniform point clouds (Kolluri 2008). An approach that directly extracts smooth surfaces from unstructured point-based volume data without prior resampling or mesh generation is proposed by Rosenthal and Linsen (Rosenthal et al. 2008). Another most common approach to surface reconstruction is based on the Delaunay triangulation: the underlying idea is that when the sampling is noise free and dense enough, points close on the surface should also be close in space. Among the Delaunay-based methods, the most well-known algorithms are, preferably, the Crust (Amenta et al. 2001) and the Cocone (Dey et al. 2003) families of algorithms. Power Crust (Amenta et al. 2001) relies on the power diagram, the weighted Voronoi diagram of the poles. Labatut et al. (Labatut et al. 2009) formulate the reconstruction problem as an energy minimisation on the Delaunay triangulation. In the case of lattice-based DEM methods, the discussed surface extraction algorithms cannot be directly applied, because of the absence of suitable data defining the crack surface and the complex nature of crack surfaces, defined by the scattered results of numerical computations at the micro-level. The holes and disjoint pieces of crack surfaces make surface extraction extremely complicated.
Computer graphics scientists focus their attention on enhancing the realism of natural scenes, while computational researchers concentrate on building accurate numerical models. Furthermore, their principal aim is not closely related to visually attracting results. In the DEM methods, cracks and the related phenomena are often visualized in the most straightforward way. The particles coloured depending on particular scalar attributes (Bertin 2010), such as the initial high altitude or radii, are most common (Kačeniauskas, Kačianauskas, et al. 2011; Rojek et al. 2011; Zang et al. 2007). The propagation of large cracks is illustrated (Figure 1.2a) by using the rendered geometry of particles (Cusatis et al. 2006). However, this technique can be applied only to large cracks, which are of the particle size. In the case of smaller cracks, when some connections are already broken, but gaps between particles remain significantly smaller than the particle
20 1. OVERVIEW OF DISTRIBUTED VISUALIZATION SYSTEMS METHODS
diameter, geometry of the neighbouring particles can not properly visualize crack
surface propagating in 3D. The coloured lattice connections (Karihaloo et al.
2003; Liu et al. 2007) can be treated as the main alternative to the rendered
particles. The broken connections between the neighbouring particles (Figure 1.2b) indicate the fractured regions, but do not provide any valuable information about the formation of the crack surfaces.
a) b)
Fig. 1.2. Crack propagation illustrated by using: a) the rendered geometry of particles,
b) the tubes on broken connections between the neighbouring particles
The main visualization task of the presented research is to construct the surfaces of cracks from the broken lattice connections and the geometry of the neighbouring particles. In 3D space propagating crack surface can be defined by 2D graphical primitives that contain more information than 1D graphical representations employed in above discussed visualization methods based on lattice connections (Figure 1.2). 2D graphical representations can be valuable until gaps between the neighbouring particles exceed the particle diameter and material starts crumbling. The complex disjoint surfaces of cracks and the unavailability of a suitable scalar field defining the crack surfaces limit the application of the widely used surface extraction methods. Thus, there is hardly any direct method of constructing the surfaces of propagating cracks from individual defects determined between the neighbouring particles and applying the available visualization methods. Moreover, the commercial finite element analysis software widely used by engineers can import only continuously defined crack surfaces represented by usual graphic primitives. The successful research into the problems of representation and visualization of crack surfaces can help to fill the gap between the industrial requirements and the research results currently obtained in the areas of fracture mechanics and material sciences.
The Voronoi diagrams can be applied to post processing of discrete particle systems as well as to lattice forming. Given a set of primitives, the Voronoi diagram partitions space into regions, where each region consists of all points that are closer to one primitive than to any other. The Voronoi diagrams have important applications in many sciences, including visualization of medical data
1. OVERVIEW OF DISTRIBUTED VISUALIZATION SYSTEMS METHODS 21
sets, proximity queries, spatial data manipulation, shape analysis, computer animation, robot motion planning, modelling spatial structures and processes, pattern recognition, locational optimization and selection in user interfaces (Aurenhammer 1991; Klein et al. 2009). Fast and resolution independent computation of the Voronoi treemaps, based on a combinatorial algorithm for the weighted Voronoi diagrams, was presented by Nocaj and Brandes (Nocaj et al. 2012). GPU based computation of the 3D discrete Voronoi diagrams was used for surface extraction by Rosenthal and Linsen (Rosenthal et al. 2009). A concept of the Centroidal Voronoi tessellation was presented in the form of graphs in (Lu et al. 2012). The edges of radical Voronoi diagrams were employed to construct a beam-network model for autoclaved aerated concrete (Kadashevich et al. 2008). Computational lattices for polydispersed particulate media are assembled according to the Voronoi diagrams by (Cusatis et al. 2006). However, there were no attempts to describe the contact surfaces of particles and to visualize the propagating cracks by using local space decompositions based on the Voronoi cells or the geometric cell centre. Moreover, no attempts were made to extract the crack surfaces and explicitly define them by graphics primitives in the regions of highly deformed computational lattices.
1.5. Conclusions of Chapter 1 and Formulating Task
for the Dissertation
1. The most of the overviewed grid environments for visualization are based on the Globus middleware and its toolkit for service development. The important Globus functionality cannot be accessed in the gLite grid environment, therefore, most of the available visualization software cannot be applied.
2. Moreover, it is difficult to find a general purpose grid visualization e– service, which can visualize the results produced by engineering applications at interactive rates on the gLite/EMI grid infrastructures. 3. The lattices employed in DEM computations of discrete particle systems
are assembled from the 1D springs or beams, which are not well suited for the reliable interpolation and common visualization techniques used in 3D.
4. The complex nature of cracks, propagating in particle media and the unavailability of a suitable scalar field defining the crack surfaces limit the application of the common surface extraction methods to visualization of cracks, defined by the scattered results of numerical computations at the micro-level. The holes and disjoint pieces of crack surfaces make surface extraction extremely complicated.
22 1. OVERVIEW OF DISTRIBUTED VISUALIZATION SYSTEMS METHODS
5. There is hardly any direct technique of constructing the surfaces of propagating cracks according to the connectivity of the broken lattice connections and the geometry of the neighbouring particles. Moreover, there were no attempts to visualize the propagating cracks by using local space decompositions based on the geometrical cell centres.
In order to achieve the aim, the following have to be solved:
1. To develop software implementation, which allows reducing commu-nication between remote components of gLite/EMI grid infrastructure, and investigate its performance.
2. To develop visualization methods for extraction of crack surfaces from discrete particle systems.
3. To implement the developed methods into distributed visualization software.
4. To investigate and compare the speed of the implementation of the developed visualization methods.
23
2
Visualization Methods and
Distributed Software for Discrete
Particle Systems
In this Chapter novel methods are introduced for visualization of crack surfaces from monodispersed particle systems. The proposed methods for visualization of cracks were implemented in the devbeloped prototypes of grid visualization e– service VizLitG and the distributed visualization software VisPartDEM. Partial data set transfer from the grid storage element was developed to reduce the transferred data size and visualization time.
The methods presented in this Chapter are published in (Kačeniauskas and Pacevič 2011), (Pacevič et al. 2013), (Pacevič, Kačeniauskas, et al. 2015), (Kačeniauskas et al. 2012), (Kačeniauskas et al. 2013), (Pacevič and Kačeniauskas 2015).
2.1. Cell Attribute- and Cell Cut-based Methods
The cell attribute-based method and the cell cut-based method are developed for visualization of cracks propagating in monodispersed particle systems. The cell cut-based surface extraction method resulted as the extension of the cell
attribute-24 2. VISUALIZATION METHODS AND DISTRIBUTED SOFTWARE FOR DISCRETE …
based method in order to define crack geometry by graphics primitives. The developed visualization methods generate global or local space decompositions from the 1D connections of the computational lattice. Generation of space decompositions from lattice connections of lower dimensionality is a time-consuming procedure. The commonly used mesh generation methods cannot be applied because of highly different input data. The vertices of the cells are determined by the particle positions. Moreover, one–dimensional lattice connections should be employed as the edges of the newly generated cells and local decompositions rather than global meshes should be used in order to save computational resources.
2.1.1. Cell Attribute-based Method
The simple cell attribute-based method is proposed for visualization of cracks in monodispersed particulate media. Figure 2.1 shows the application of the cell attribute-based method in 2D. The cell attribute-based method covers the whole computational domain by generated cells. The proposed method employs the one-dimensional lattice connections as the edges of the newly generated cells. In Figure 2.1, thin black lines represent the unbroken lattice connections, while thin red lines represent the broken connections. The method simply calculates how many 1D connections of the particular cell are broken and assigns this value to the cell attribute. In this case, spatial crack representation can be visualized as the scalar cell attribute by using colour mapping and predefined colour table. In Figure 2.1, the triangles including only one broken connection are coloured in cyan, while the cells that have two broken connections are coloured in yellow. Triangles containing three broken connections are coloured in red, while cells that have not broken connections are not displayed in Figure 2.1.
2. VISUALIZATION METHODS AND DISTRIBUTED SOFTWARE FOR DISCRETE… 25
The general scheme of the method is presented in Figure 2.2. Initially, the data set is read by using a nearly standard reader. The cell attribute-based method consists of two main blocks that can be implemented in software as one or several filters. The first block generates the mesh topology from 1D connections of the lattice employed in DEM computations. It is the most time consuming procedure, which is performed only once. Usually, cells are generated before visualizing the results of the first time step. Sometimes the mesh topology can be imported from the non-standard DEM computations employing the mesh for the specific computational purposes (Vadluga et al. 2009). The second block calculates the cell attributes from the broken lattice connections. The method simply calculates how many 1D connections of the particular cell are broken and assigns this value to the cell attribute. Finally, the calculated cell attributes are mapped to the predefined colours and rendered on screen by using the available mapper and the renderer, respectively.
Fig. 2.2. Cell attribute-based visualization method
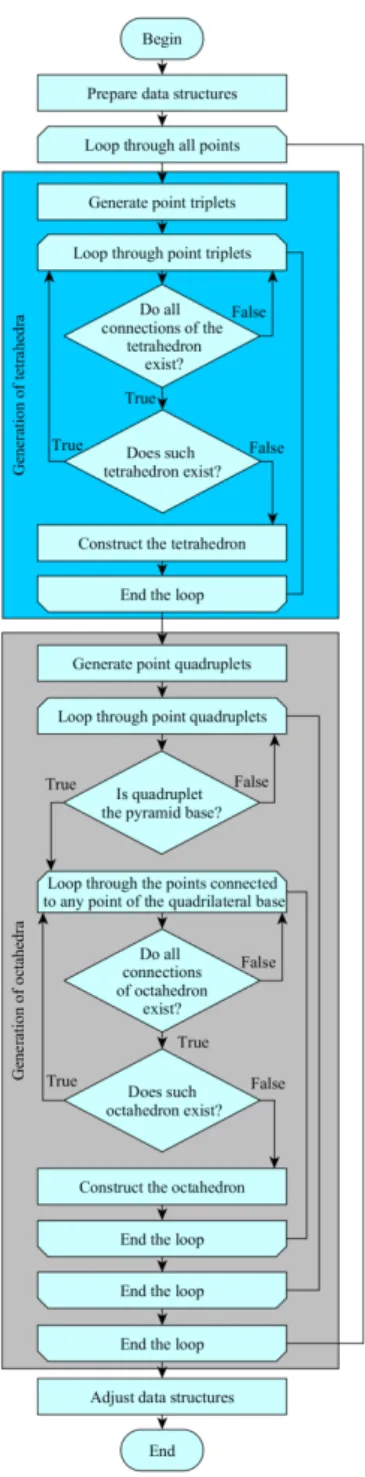
Figure 2.3 presents the method designed for generating the three– dimensional mesh topology. During the preparation of data structures the lists of the connected neighbours are assembled for all lattice points (particles). Then a loop, running through all points, is started. In 3D, two types of cells are considered to cover wider range of computational lattices. Thus, the generated 3D topology consists from pyramids with triangular or quadrilateral bases, which are generated in separate blocks of the method. In order to speed up computations, the point triplets and the point quadruplets are generated for identifying all possible triangular or quadrilateral bases, respectively.
26 2. VISUALIZATION METHODS AND DISTRIBUTED SOFTWARE FOR DISCRETE …