GEOGRAPHICAL INFORMATION SYSTEM IN WEB
APPLICA-TION
Developing Web Application to Serve Spatial Data to Users
Thesis
CENTRIA UNIVERSITY OF APPLIED SCIENCES
Information Technology
ABSTRACT Centria University of Applied Sciences Date January 2020 Author Zhipeng Jiang Degree programme Information Technology Name of thesis
GEOGRAPHICAL INFORMATION SYSTEM IN WEB APPLICATION. Developing Web Applica-tion to serve spatial data to users
Instructor Jari Isohanni Pages 29 + 7 Supervisor Jari Isohanni
This study is aimed to give a basic understanding of web GIS from a technological point of view. Also, how the approach is useable for other technologies. The technologies including JavaScript API for Google Maps and ArcGIS were tested with demonstration. Additionally, the open-sourced solu-tions are discussed with the self-hosted server, PostgreSQL database. And with Openlayers as the front-end JavaScript library to present the geospatial data.
During the study, in the Google Maps API demonstration, the GeoJson data is made by geojson.io and attitude data of the spatial data is called with the API method, to create popup windows for each city area. Another layer that represents specific location for the school, park, and hospital at Kokkola area is marked out with Google Maps API marker and it is overlaid, on top of that city area layer. The same spatial data and its related attribute data are implemented once more with ArcGIS JavaScript API to find out what is the difference between these two technologies.
The result is that the Google Maps JavaScript API does not need to have a popup template to have the popup functionality working, instead of popup template, in the Google Maps JavaScript API, the click event listener is created to handle the popup event. Furthermore, Google Maps JavaScript API need an API key to use the API, whereas ArcGIS JavaScript API does not require an API key to use it. These two demonstrations give basic understanding of how the modern GIS works with the different map layers suggested by Roger Tomlinson in 1963.
For better understanding, the Open Geospatial Consortium (OGC) with Web Map Service (WMS) and Web Feature Service (WFS) layers are defined and explained. A short demonstration for WMS layer for a traffic accident in Finland is implemented by ArcGIS JavaScript API using its URL, which approves the theory of WMS and WFS layer defined under OGC that can be accessed by URL. The theory three-tier architecture for web GIS is suggested and open-sourced, self-hosted implementation is carried out to support the theory part of the web GIS with Openlayers, Geoserver in Tomcat web server, and PostgreSQL database.
Key words
GIS, Web GIS, Google Maps JavaScript API, ArcGIS JavaScript API, Openlayers, Geoserver, Post-greSQL
CONCEPT DEFINITIONS
API Application Programming Interface CSS Cascading Style Sheets
FTP File Transfer Protocol
GIF Graphics Interchange Format GIS Geographical Information System GNSS Global navigation Satellite System GPS Global positioning System
HTML Hypertext Markup Language HTTP Hyper Text Transfer Protocol
JOMS Extensible Open Street Map editor for JAVA JPEG Joint Photographic Experts Group (Image format) LAN Local Area Network
OGC Open Geospatial Consortium OMS Open Street Map
OMSF Open Street Map Foundation PNG Portable Network Graphics SSL Secure Socket Layer URL Uniform Resource Locator WAN Wide Area Network WFS Web Feature Service WMS Web Map Service
ABSTRACT
CONCEPT DEFINITIONS CONTENTS
1INTRODUCTION ... 1
2THEORETICAL PART OF THE STUDY ... 2
2.1Geographical Information System ... 2
2.2General History Background of GIS ... 4
2.3Terms in GIS ... 5
2.4Architecture of Web Service Application ... 7
2.5The Web GIS Application ... 8
2.6The Architecture of a Web GIS ... 9
2.7The Database and Spatial Data processing... 10
2.8Geographical server and OGC standard based services ... 11
3EMPIRICAL PART OF THE STUDY ... 14
3.1Front-End Approach ... 14
3.2Introduction to the programming languages ... 15
3.3About the Google Maps JavaScript API ... 17
3.4ArcGIS JavaScript API ... 20
3.5Self-hosted web GIS Implementation ... 23
3.6Other GIS Solutions ... 27
4CONCLUSIONS ... 29
REFERENCES... 30
APPENDICES FIGURES FIGURE 1. Essential elements that formulates GIS ... 3
FIGURE 2. From wired to wireless Post PC era ... 6
FIGURE 3. Common GIS terms used by people ... 6
FIGURE 4. Three-tier architecture ... 8
FIGURE 5. Web GIS architecture ... 10
FIGURE 6. pgAdmin – A GUI management system for PostgreSQL ... 11
FIGURE 7. Font-End Approach in General ... 15
FIGURE 8. How to use script to access the Google Map JavaScript API ... 17
FIGURE 9. Create a new map object and set the zoom levels and initial map view ... 17
FIGURE 10. div element container that has id ‘map’... 17
FIGURE 11. The InfoWindow object set with a content property and a listener is added ... 18
FIGURE 12. The loadGeoJson method is called for display data layer ... 18
FIGURE 13. setStyle method ... 18
FIGURE 14. End-user point of view that what was done ... 19
FIGURE 15. All the data layers are set and loaded to map... 19
FIGURE 16. Final data visualization using Google Maps JavaScript API ... 20
FIGURE 17. Implementation of access WMS layer using URL in ArcGIS JavaScript API ... 20
FIGURE 18. Traffic accidents in Finland from 2017 ... 21
FIGURE 20. The popup template for popup windows ... 22
FIGURE 21. One of the GeoJSON Layer object ... 22
FIGURE 22. Two customized spatial data are added to PostgreSQL ... 24
FIGURE 23. Strat up the Tomcat web Server ... 24
FIGURE 24. Access the Apache Tomcat server via browser address localhost:portnumber ... 24
FIGURE 25. Uploading to Geoserver using PostGIS ... 25
FIGURE 26. 1_kerros_centria and kokkola_city_area is published through Geoserver ... 25
FIGURE 27. Layer preview from Geoserver ... 26
FIGURE 28. The data layer is presented by using Openlayers 4.6.5 via HTTP request ... 26
FIGURE 29. After managing styles using .sld files from Geoserver ... 27
TABLES TABLE 1. Technologies used during the implementation ... 23
1 INTRODUCTION
The idea of this work was to give a basic knowledge of the web geographical information system (GIS) in a technical view. For example, how the approach is useable for other technologies, for example, real-time sensor through the web-socket protocol, and presentation with different technologies for example with JavaScript API, Python, Blazor.Net.
From the start of the study, the ArcGIS Online platform was used and learned by using Esri official documentation and tutorials to give a better understanding of what is GIS and how GIS works in general. Map projection with different location reference was found and defined. Vector and raster data repre-sentation were understood by using ArcGIS JavaScript API and Google Maps API. Some of the differ-ence between these two technologies are found and stated.
Further, the three-tier architecture for web GIS that suggests the separation of the presentation layer, logic layer, and data layer was stated to give the view from the open-sourced solution direction. By hosting GeoServer on Tomcat Web Server the own spatial data is served by WMS layer that is defined by OCG. The WMS layers were created by using QGIS Desktop. These layers were stored in Post-greSQL database by PostGIS. In the end, it was accessed by URL and presented via Openlayers and JavaScript language.
2 THEORETICAL PART OF THE STUDY
In daily life, the dependence on location data is becoming important to be considered. This location data usually being represented by location markers on a map. Due to this, the location data are frequently used by GIS (Global Positioning System) in relation with GNSS (Global Navigation Satellite System), remote sensing, and interactive web-mapping. People might not even notice that the appearance of lo-cation data and its related information system: geographical information system in a different context. For example, Google Maps is one of the well-known web-based geographical information systems in the world. (Sungsoon & Cassie 2019.)
In this chapter, the concept of Geographical Information System will be introduced, and the historical background of the System will also be discussed. There are a few more categories under the Geograph-ical Information System that makes the system clearer by presenting it in a pyramid structured form. Furthermore, the model of Web applications and Web GIS are then discussed. Then the data and geo-graphical processing are introduced and in the end the applications of GIS will be shortly explained.
2.1 Geographical Information System
To define GIS as a concept clearly and in an understandable manner to people. In the article at GIS Lounge written by Caitlin Dempsey (2019), she states that GIS is a technological area that merges geo-graphical appearance with geogeo-graphical data sets to map, analyze and describe to help solve real-world problems.
According to her article, the keyword for this technology is geography, because some portion of the data is spatial. The definition of spatial data is data that is constantly referenced to a position on earth. This kind of data that links with the more detailed information about the special location are referred to as attribute data. It is this attribute data that empowers GIS to be an effective problem-solving system over spatial analysis. (Dempsey 2019.)
A GIS is also defined as a Spatial Information Technology that stipulates the use of information tech-nology through geography to gain access to additional information sources and to assist in handling,
presenting and analyzing spatial information. Data representing the real world that can be stored, pro-cessed and presented in relatively simplified forms to suit specific needs i.e. amap is the cornerstone of GIS. GIS as an abbreviation stands for Geographical Information System. (Fazal 2008.)
In the book GIS Basics (Fazal 2008, p7) outlines:
“A system for capturing, storing, checking, integrating, manipulating, analyzing and dis-playing data which are spatially referenced to the Earth. This is normally considered to involve a spatially referenced computer database and appropriate applications software.” Moreover, the hardware and software that forms a GIS are two important parts of the system, but these are not the only parts that make the complete GIS. In the figure shown (Figure 1), other important parts that included in the GIS as a whole are data and information, computers, input and output technology and computer software, geographic and related concepts that drive the analysis, people, and institutions and organization, where the GIS exists. (DeMers 2009.)
2.2 General History Background of GIS
The history of GIS is more story-based rather than scientific facts that are written in book or proved by research. In fact, there is so little information available about all this business and the resulting works. According to Dempsey in GIS Lounge, a GIS (Geographic or Geospatial Information System) is a mod-ern extension of traditional cartography with one fundamental similarity and two essential differences. The similarity is that cartographic files and a GIS both contain examples of a base map to which addi-tional data can be added. The differences are that there is no limitation to the amount of addiaddi-tional data that can be added to a GIS map and secondly the GIS uses analysis and statistics to present data in support of special real-life issues that a cartographic map cannot solve. (Dempsey 2012.)
There are four different historical periods in the development of Geographic Information Systems. Stage one, from early 1960s to the middle-1970s, a new branch of knowledge was affected by a few crucial individuals who formed the direction of further research and development. In this stage of GIS evolution and the purpose of GIS includes important research by the academic community. Thereafter, the Na-tional Center for Geographic Information and Analysis, led by Michael Goodchild, formalized research on key geographic information science topics such as spatial analysis and visualization. These efforts impelled a significant revolution in the world of geographic a science and placed the groundwork for GIS. (Dempsey 2012; Eris 2019.)
In 1963, the first computerized GIS was built by Roger Tomlinson. It is a Canada Geographic Infor-mation System that manages the inventory of natural resources. This project was commissioned by the Canadian government. Tomlinson constructed a computerized system to store and process copious data, that empowered Canada to start its national geographic management program that wasgiven the name GIS. From his work the idea that a map could be divided into different layers was adapted in further map handling. (GISGeography 2019; Eris 2019.)
Another key individual in the early stages of GIS evolution was Howard Fisher. One of the first computer mapping software programs, was titled as SYMAP, was created at the Harvard Laboratory in North-western University in 1964. The SYMAP is a few of the first computer-based software tool used for map creation and the Harvard Laboratory become a research center for spatial analysis and visualization. (Eris 2019.)
In 1969, a member of the Harvard Lab, Jac Dangermond and his wife, established Environmental Sys-tems Research Institute, lnc. The name was abbreviated into ERIS. It is a computer mapping and spatial analysis consultation company that aims to help geographical planners and land resource managers make advisable solutions. The company’s work in the early stages has proven the value of GIS in problem solving. (Dempsey 2012; Eris 2019.)
The second stage is from the mid-1970s to the early 1980s. In this period the GIS technologies were adopted by governments, and because of that the development shifted to more practical focus rather than theoretically aimed. As governments comprehended the superiority of digital mapping, this affected the work of the Harvard Laboratory Computer Graphics. During the mid-1970s Harvard Laboratory Com-puter Graphics developed the first vector GIS named ODYSSEY GIS. ESRI’s ARC/INFO used the technical framework from ODYSSEY GIS and this effort led computer-based GIS to software commer-cialization. (Dempsey 2012; GISGeography 2019.)
In Stage three, from 1982 to the late 1980s the development was focused on the commercial markets, because of the capacity of computing power, new launched satellites and integration of remote sensing technology. This made GIS a handy tool to help in real-life problem solving. In the final stage that started in the late 1980s the development focused on improving the usability of the technology by mak-ing the system more user-focused and friendly. (Dempsey 2012; GISGeography 2019.)
The GIS today is everywhere, from everyone’s mobile device, as the result of the location data is part of 456 exabytes created in these devices daily by 2025. Large amount of location data is gathered not only for the past, but also the current real-time data for people’s interests. Take for example the smart city, smart city is a city that uses information and communication technologies to make life better. Counties like Oakland, MI, and Opelika use GIS to make different software solutions that help these counties to manage their projects cross geographical limitations. (Anthony 2019.)
2.3 Terms in GIS
GIS as a general concept of geographical information system as a whole. There are several concepts that can be defined under GIS, these concepts are “Distributed GIS”, “Internet GIS”, “Mobile GIS”, “Web GIS,” and “Network Based GIServices”. These concepts refer to a large field of technologies and appli-cations, which are included in the terms of Internet GIS. The term “Distributed GIS” is defined as a software architecture where different geographical information systems are connected or in other words
distributed with other geographical information system that are physically located in different places. The “Internet GIS” and “Mobile GIS” reflects two different ways that connect to the Internet, one is via wired Internet for desktop computers and one is via wireless Internet connection such as Personal Digital Assistants and smart phones. (Peng 2003.)
Figure 2: From wired to wireless Post PC era (Fu 2012.)
The “Web GIS” focuses on the most commonly used application on the Internet, World Wide Web, such as the most popular user interface to the Internet GIS programs. The term “Network-Based GIServices” are concentrating on geographic information services, such as travel information services, land use in-formation services, and environmental inin-formation services. These are the main functionalit ies that are included in Internet GIS. (Peng 2003.)
The distributed GIS is the usage of spatial data and applications, which could be connected via local area network (LAN) inside the organization and it is also possible to link them with different organizations via wide area network (WAN), in both cases the distributed systems are still protected from the world i.e. Internet by a firewall filter. (Peuralahti 2014.)
Figure 3: Common GIS terms used by people. (Fu & Sun 2011.)
Internet GIS is the GIS system that uses not only Web service that is provided by Internet, but it also uses other Internet services. The Web GIS is the system that uses only the Web service provided by the Internet. Therefore, by this definition Internet GIS is a wider field, than what a Web GIS covers, as it is shown in Figure 3. Since the definition of Internet is the method of transporting content or data by connecting a computer to other computers around the world and the Web is a software that lets people use that content or data. It is what people see and click on a computer browser. That is the reason Web GIS might be a more familiar term than the Internet GIS. (Majid 2014; Computer History Museum 2019.)
2.4 Architecture of Web Service Application
From previous section the principle of Web service is known, as Web is the service provided by the Internet. Naturally this leads to having the definition of Web Service Application and its architecture. Computer Hope states that a Web service application is usually a software application that runs on a Web browser, which provides various services to the user via HTTP communication through an Internet connection. (Computer Hope 2019.)
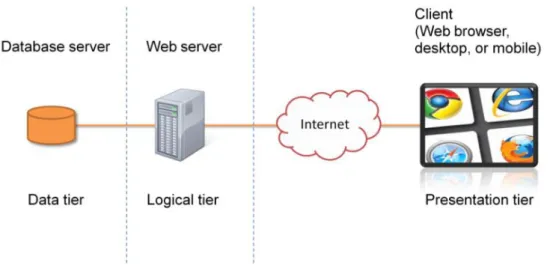
A simple architecture of a Web service application is the three-tier architecture that includes data tier, logical tier, and presentation tier. It could also be referred to in a multitier architecture (client-server architecture), where the server is a database server that is providing data storage and data managing services (data tier) and the client handles both the presentation tier and the logical tier. The three-tier architecture is a more preferable architecture than multitier architecture, because of better security and extensibility. (Gacheru 2019.)
Figure 4: Three-tier architecture (Peuralahti 2014.)
In the three-tier architecture, the essential idea is that the data tier and the client tier cannot have a direct communication with each other. Instead, the communications should be handled with a mediator that is the logical tier or the server tier. This means that the logical tier usually has a web server hosting a Web site, which reads the data from the data tier that is usually a database and supplies the data to the web applications that are requesting it. In other words, once the client application requests certain data from a database, it does not send the request direct to the database but instead it sends the request to the server then the server requests the data from the database and sends then the requested data back to the client application. Examples for web server platforms are Apache HTTP Server, NGINX, Apache Tomcat and Internet Information Services (IIS). Additionally, these platforms support different programming lan-guages that help developers create the logic for the services. Examples for these programming lanlan-guages is ASP.Net that is written in C Sharp, Java through JavaServer Pages (JSP) and JavaScript using back-end JavaScript, i.e. Node.js. (Peuralahti 2014.)
2.5 The Web GIS Application
Web GIS is a type of distributed information system that includes at least a server and a client, where the server is a web application server, and the client can be a web browser, desktop application or mobile application. (Eris 2019.)
There are four different core elements that make a Web GIS. First element, there is a server that has a URL. By using the URL, the clients can find the map through Web. Second element, client that uses
HTTP standard sends the requests to the server. Third element, the server gives the requested GIS oper-ation back to the client via HTTP requests. Fourth element, the response should have multi-format ca-pabilities that means the data format can be HTML, binary image, XML (Extensible Markup Language), or JSON (JavaScript Object notation). (Eris 2019.)
The advantage of a Web GIS is that it takes advantage of the Internet. Web GIS is based on HTTP that is widely supported. The distance between the server and the client are not the factor anymore, when compared with a normal desktop solution. (Eris 2019.)
Web GIS often follows the HTML and JavaScript standard, and this makes the HTML clients support different operating systems such as Microsoft Windows, Linux, and Apple Mac OS. Web GIS also low-ers the cost in comparison to a plow-ersonalized desktop solution. (Eris 2019.)
It is easy to update content, because once the host server updates the content, then every single other individual will stay up to date, which makes it very easy to maintain and powerful to deliver real-time monitoring. (Eris 2019.)
2.6 The Architecture of a Web GIS
The web GIS is a geographical information system that uses web technologies. The architecture of a web GIS uses often a three-layered structure, because of the web GIS definition. These layers are User Interface Layer, Application Server Layer and Database Layer. (Mariano, Eluzai, Tati de, George, Hen-rique & Maristela 2012.)
The User Interface layer gives a graphical user interface (GUI) to visualize the spatial data for the end user, and it gives the end user the capacity to interact with back-end services. The Application Server Layer communicates with different data sources through the data integration layer. This layer has inter-action capacities with the end user to provide data analyzing and visualizing services. The Database Layer is the layer for providing data that gives interfaces where database extension application can pull local data in and manage it and deliver it to the server. (Mariano, Eluzai, Tati de, George, Henrique & Maristela 2012.)
Some researchers consider the web GIS architecture a four-layered architecture. In a sense that geospa-tial server that is based on web services works as a data integration layer which is added between data-base layer and web application server layer. (Mariano, Eluzai, Tati de, George, Henrique & Maristela 2012.)
Figure 5: Web GIS architecture. (Fu 2012.)
In the GIS server shown in Figure 5, it is the geospatial server that is mainly used to store and provide map data layer services, which follow the international standard. In other words, the GIS server is an integration layer that only manages spatial data. The basic idea of the figure illustration is that the data-base server stores ready-made spatial data in a table form, then the GIS server is connected through a certain extension that the database provides, for example, through user’s username-password authoriza-tion to authorize the connecauthoriza-tion in between. After the establishment of a connecauthoriza-tion between the data-base server and the GIS server the spatial data is transmitted to a GIS server. The contents are ready for publishing, by web server and HTTP requests through Internet connection. (Fu 2012.)
2.7 The Database and Spatial Data processing
The importance of a geographical information system is that it provides not only visualized map infor-mation but also extra inforinfor-mation that comes with map coordination together that are aimed to help people to solve real-life problems. This extra data is referred as attribute data. (Dempsey 2019.)
Nevertheless, sometimes the data that is displayed with the map is not straightforward to certain prob-lems that people might be facing. Often people need different kind of data analyzing services provided
by the web GIS. For example, routing services, geocoding services, time estimation services with various travel methods. (Dempsey 2019.)
In order to provide these services to people, the Logical layer, also known as the Server Layer, middle layer from three-layered architecture needs to have data process algorithms in order to find out what is the solution for different problems, in case what is the estimated time from home to the park. This routing service is the service that is based on spatial data analysis, processing and visualization. (Fu 2012.)
As most of the GIS services that can interact with end-user need geospatial data provided, in order to start the actual spatial data analysis, processing and visualization. The database layer that is usually acting as a data provider to the logical layer thus becomes one of the important parts of the web GIS architecture. (Fu 2012.)
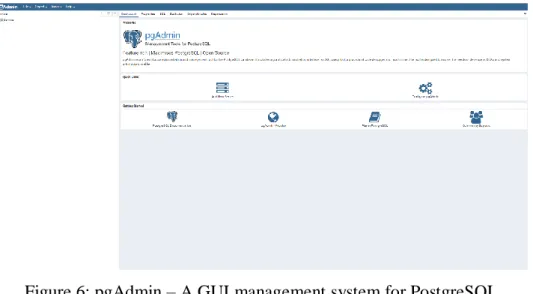
In the market there are different kinds of database systems that support handling geospatial data. For commercial/closed source interfaces, for example Oracle, ArcSDE (Spatial Data Engine), IBM Dd2, IBM Informix, and Microsoft SQL Server. Database solutions for free/open source interfaces are for example PostgreSQL, MySQL. (Buqu, T. 2017)
Figure 6: pgAdmin – A GUI management system for PostgreSQL
2.8 Geographical server and OGC standard based services
A GIS server is a component from Logical Tier that is mainly responsible for communicating with the database server and the web application server. The Geospatial Server interacts with Database Server to
get spatial data and uses the provided data to publish the data as different kinds of data layers as services. (Fu 2012.)
These services follow the Open Geospatial Consortium standards. OGC standards are technical docu-ments that define interfaces or encodings. It is used when the OGC standards are implemented in projects or online services by different software engineers working independently, thus the components plug and play works together without further debugging. (OGC. 2019)
A Web Map Service (WMS) produces maps of spatially referenced data dynamically from geographic information. This International Standard defines a “map” to be a picture of geographic information as a digital image file suitable for display on a computer screen. The WMS provides map to be rendered in an image format such as PNG, GIF or JPEG or vector-based graphical elements in Scalable Vector Graphics (SVG) or Web Computer Graphics Metafile (WebCGM) formats. (OGC 2019.)
The standard defines three operations, first operation is that WMS can return service-level metadata. Second operation is that WMS can return a map, whose geographic and dimensional parameters are well-defined. Third operation is that WMS can return information about certain features shown on a map.
WMS operations can be reached/called using a standard web browser by submitting requests in the form of Uniform Resource Locators (URLs). The content of such URLs depends on which operation is re-quested. In more detail, when requesting a map, the URL indicates what information is to be shown on the map, which part of the Earth is to be mapped, the appropriate coordinate reference system, and the output image width and height. When two or more maps are produced with the same geographical pa-rameters and output size, the results can be precisely overlaid to produce a commixture map. The use of image formats that support transparent backgrounds (e.g. GIF or PNG) allows underlying maps to be visible. Furthermore, individual maps can be requested from different servers. The Web Map Service thus enables the creation of a network of distributed map servers from which clients can build custom-ized maps. (OGC 2019.)
The Web Feature Service (WFS) represents a change in the way geographical information is created, modified and exchanged on the Internet. Rather than sharing geographic information at the file level using File Transfer Protocol (FTP), for example, the WFS offers direct fine-grained access to geograph-ical information at the feature and feature property level. Web feature services allow clients to only
retrieve or modify the data they are seeking, rather than retrieving a file that contains the data they are seeking and possibly much more. That data can then be used for a wide variety of purposes, including purposes other than their producers’ intended ones. (OCG 2019.)
3 EMPIRICAL PART OF THE STUDY
From the perspective of implementing a web GIS, usually people begin with Google Maps API, or to be more specific, start with Google Maps API examples. Implementation approach other than Google Maps API, includes ArcGIS for JavaScript API, Baidu Map API. In the case of Google Maps API, the basic idea is to get API Key for linking the API with JavaScript. After the Google hosted base map appears, the Google Maps JavaScript API is used to approach readymade methods to have different map features. All the Google Map implemented features/functions can be implemented individually. (Buqu 2017.)
It is a simple solution to insert Google Map into applications. When an Internet connection is available which makes accessing Google services possible and there is no requirement for special spatial data. There are numerous applications that need a GIS system linkage; for example, in travelling service, house service, taxi service, and social application. (Buqu. 2017)
There are two issues in this simple solution: first, if own customized spatial data is used, the data cannot be combined with the web system. Second, if the GIS needs a local area network that is fully secured with outside world/Internet, that cannot even access the outside Internet. Therefore, it is also important to have a solution with own hosted web GIS, depending on the customer requirements. (Buqu 2017.)
3.1 Front-End Approach
When talking about the implementation from the front-end view, it is a question about building up an end-user environment using Hypertext Markup Language (HTML), Cascading Style Sheets (CCS), Ja-vaScript (JS) and other external JS libraries, APIs. (Buqu 2017.)
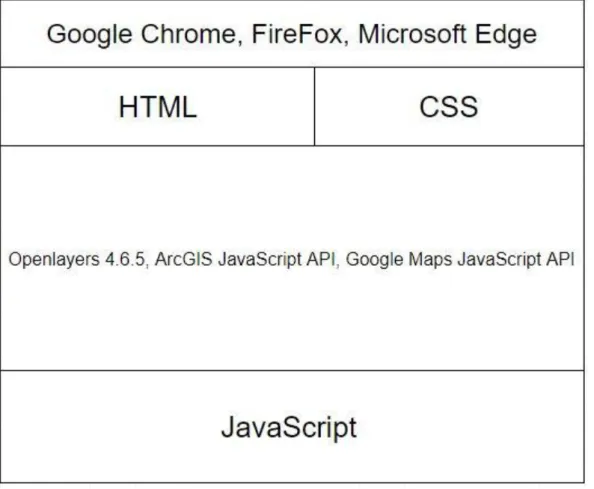
In this Section the front-end programming language, Openlayers 4.6.5, ArcGIS JavaScript API, Google Maps JavaScript API will be discussed, and three demonstration implementations are presented and discussed.
Figure 7: Font-End Approach in general
In Figure 7 the general idea of what is implemented to front-end i.e. the presentation tier approach is presented.
3.2 Introduction to the programming languages
HTML (Hypertext Markup Language) is the most basic developing language of the Web. It illustrates the content of web pages. Other technologies than HTML are commonly used to describe a web page's appearance and rendering (CSS) or functionality and event behavior (JavaScript). (MDN 2019.)
“Hypertext” refers to links that connects web pages, either within a single website or between websites. Weblinks are a fundamental feature of Web development. By creating and uploading web content to the Internet and linking it to pages created by other people. Pages become distributed with other pages to form a network that is what the “Web” describes. (MDN 2019.)
Cascading Style Sheets (CSS) is a programming language that is used to describe the appearance of content written in HTML or XML (including XML dialects such as SVG, MathML or XHTML). CSS describes how elements are rendered on screen and in different medias. (MDN 2019.)
CSS is one of the essential programming languages of websites, because it follows the W3C specifica-tion that gives the cross-platform ability. There are several developing levels with CSS; CSS1 is now out of date, CSS2.1 is a recommendation, and CSS3, now divided into smaller modules, is progressing on the standardization track. (MDN 2019.)
JavaScript (JS) is a lightweight, interpreted, or just-in-time compiled programming language with first-class functions. While it is most recognized as the scripting language for Web pages, numbers of non-browser environments also use it, such as Node.js, Apache CouchDB and Adobe Acrobat. JavaScript is a prototype-based, multi-paradigm, dynamic language that supports object-oriented, imperative, and de-clarative programming styles. (MDN 2019.)
OpenLayers is a JavaScript library and API that makes it easy to insert a dynamic map into any web page. It can display map tiles, vector data and markers loaded from any source. OpenLayers has been developed to further the use of different kinds of geographical information. It is fully free, Open Source JavaScript, released under the 2-clause BSD License (also known as the FreeBSD) which means it can be used for commercial purposes. (Openlayers. 2019)
Google Maps JavaScript API is a set of application interfaces that Google Maps provides to customize maps with customized content and images for display on web pages and mobiles. The API provides four different base maps (roadmap, satellite, hybrid and terrain) which the API user can modify using layers, styles, controls, events, different services, and libraries. Before using the API, the API key is needed. It is a commercial product, and certain amount of interface calls are limited with credits. (Google Maps Platform 2019.)
ArcGIS JavaScript API is a set of application programming interfaces that ArcGIS provides. It is a light-weighted way to embed 2D and 3D maps and tasks in web application. This technology support with different kinds of browser, for example, Chrome, Firefox, Safari, Microsoft Edge, Internet Explorer 11. (ArcGIS API for JavaScript 2019.)
Today, numerous technologies that deal with GIS, for example, MapQuest, Mapbox, Carton, Foursquare, Microsoft Bing Maps.
3.3 About the Google Maps JavaScript API
From the start, the implementation of the Google Maps JavaScript API is introduced. It is essential to create an API Key via the Google console when using the Google Maps API. The API key is then linked with a <script> to give accessibility to use the Google Maps JavaScript API.
Figure 8: How to use script to access the Google Map JavaScript API
Figure 8 illustrates the way of getting the API to the JavaScript, the API_KEY is replaced with actual API Key from the Google console. The API itself has no costs, but when API calls reach a certain amount, Google will start to charge.
Figure 9: Create a new map object and set the zoom levels and initial map view
In Figure 9, by using API method, the map object is created, which is referred to an HTML element that has the id = ‘map’ and zoom level of the map is set to 13 with an initial position in Kokkola.
Figure 10: div element container that has id ‘map’
Figure 10 shows the HTML implementation, where the <div> container is created, labeled with id named as map. Different map objects created by JavaScript API being presented and stored into the container. A marker is then added with a local customized icon and an InfoWindow object is created for pop-up content and an event listener is added for listening click event.
Figure 11: The InfoWindow object set with a content property and a listener is added
In Figure 11, the InfoWindow object is set with the content that is in HTML form. Besides, a listener is added to the marker on the map. Once the end-user clicks the marker the InfoWindow object will be invoked and a pop-up window is showing on the screen.
Figure 12: The loadGeoJson method is called for display data layer
In Figure 12 the readymade spatial data is produced by geojson.io and its stored locally and displayed with the API method loadGeoJson. After loading the data layer to the Google-hosted base map, the rendering is not set automatically. Therefore, a setStyle method is being used for accessing the data from the GeoJSON data file that returns and sets the feature to be what is defined in the GeoJSON data file.
Figure 13: setStyle method
In the Figure 13, indicates that the setStyle method is returning values via feature property in the geojson data files.
Figure 14: End-user point of view that what was done
Figure 14 shows what has been done visually as end-user experience. In the Kokkola city area data layer, where different polygons in vector data type with different colours representing the different city areas in Kokkola. Moreover, the marker is created, and the icon is changed to a school icon for the position of Centria University of Applied Sciences.
Figure 15: All the data layers are set and loaded to map
In Figure 15 all the data layers are set and loaded. Five different google map data objects are created, and the JSON data were taken from the local directory by loadGeoJson() method. From the loaded data, the city area, schools, hospital, and kindergarten are presented in the Google Chrome browser in Figure 16.
Figure 16: Final data visualization using Google Maps JavaScript API
In Figure 16 the result that derives from Google chrome browser is presented. With also the all the location point listener and popup windows showing fake data as income population and id for further data analysis.
3.4 ArcGIS JavaScript API
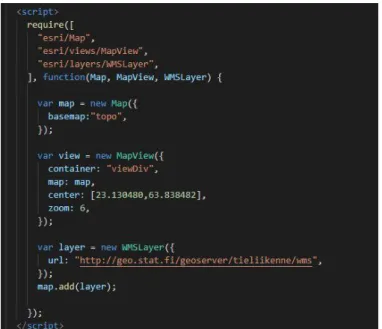
With similar JavaScript syntax, the ArcGIS JavaScript API works similarly as Google Map API. In Figure 17 the code implementation shows, and the required libraries are included using the require keyword.
Figure 17: Implementation of access WMS layer using URL in ArcGIS JavaScript API Then the new map object is created with a basemap property that defines which base map is chosen in Esri Geoserver. In this case, the Topology is chosen to be the base map of this demo.
The Map view object is created, and different properties were set to define the <div> container is used to contain all the map object (container), where map object is referred (map). The initial position of the map view (center), and the map initial zoom level (zoom).
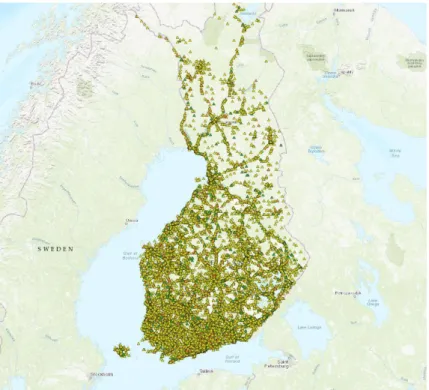
In the end, a WMS map layer is created with a URL referred to Statistics Finland Geoserver. The layer is added to the top of the Topology base map. This demo proved that the WMS layer that follows OCG standard can be reached by URL request. This is mentioned in Chapter 2.8 Geographical server and OGC standard-based services.
Figure 18: Traffic accidents in Finland from 2017 (Tilastokeskus. 2019)
In Figure 18, the implementation showing on the browser shows how many traffic accidents happened in Finland in 2017. This is a simple implementation shows the basic idea how a WMS layer were ac-cessed and overlaid by using ArcGIS JavaScript API.
The ArcGIS JavaScript API demonstration is also implemented with the same data used in Google Maps API demonstration (Figure 19). To compare the difference between the two implementations. In both cases, the self-made data is stored in the host computer and all other features are hosted by Eris.
Figure 19: ArcGIS JavaScrip API demo
This means in either cases that the spatial data is not separately provided by a database. This means that, the spatial data is not stored in database in three-tier architecture nor in the server in two-tier ar-chitecture. The data is stored in the local host computer.
One difference was found, when comparing ArcGIS JavaScript API and Google Maps API is that ArcGIS JavaScript API needs to initialize different popup template objects (Figure 20).
Figure 20: The popup template for popup windows
In Figure 21, the popup Template property is being used, that is in layer objects. To display the click event from the map. (Figure 21)
Compare to the Google Maps JS API, where it sets click event listener to listen is the event happening or not (Figure 11).
3.5 Self-hosted web GIS Implementation
As it was mentioned at the beginning of the section that all web GIS solution is very straightforward, but with different limitations. These limitations are not only the Internet connection that comes with every web GIS but also it is about working with very specific self-made spatial data or it is a very secure environment that organization network stays locally without connecting to the Internet. Because of these reasons, a demonstration is made by using the most popular open-source environment to host a structure map of the first floor of Centria University of Applied Sciences.
The tile vector spatial data was produced by QGIS Desktop 3.4.12. PostgreSQL 10.10.2 and PostGIS 2.5.3-2 was downloaded and installed. The database that can be managed with pgAdmin, is a GUI for managing PostgreSQL (Figure 6). This implementation is the data tier in the web GIS architecture men-tioned in chapter 2.6. After the PostgreSQL installation is done. The Apache Tomcat 8.5.47 is download-ed from the Tomcat official page. It is installdownload-ed with just default settings. After that, the GeoServer 2.16 .war file is downloaded from the GeoServer official page. And then the .war file is copypasted into the web app folder that is under Tomcat 8.5.47 folder. Last what is needed is a front-end editor that can edit HTML, CSS, and JavaScript. In this demonstration, the visual studio code is used. All these environ-ments are installed with default settings, during the implementation.
Declaration Technology Used
Front-End Openlayers 4.6.5 Data Production QGIS Desktop 3.4.12 Back-End Web Server Tomcat 8.5.47
GIS Server Geoserver 2.16
Database PostgreSQL 10.10.2 + PostGIS 2.5.3-2 Table 1: Technologies used during the implementation
After the environment is being settled. First spatial data that is made by QGIS Desktop 3.4.12 is imported as a data resource to PostgreSQL via pgAdmin (Figure 22).
Figure 22: Two customized spatial data are added to PostgreSQL
Then the Tomcat web server and web application server Geoserver are started. After checking the data table appears in PostgreSQL using pgAdmin.
Figure 23: Strat up the Tomcat web Server
In Figure 23 the Tomcat web server is started by running the startup titled Windows Batch File (.bat) in the bin directory which is in Tomcat root directory. This is the console window that shows the running status of the Tomcat web server. It helps debug and resolve errors.
Figure 24: Access the Apache Tomcat server via browser address localhost:portnumber
In Figure 24, the localhost:8080 is typed into the browser to get access to the server, after the server activated. In this page the server status, web applications management, and host management can be managed by Tomcat graphical user interface. When the web server, web application server and database server are up the next step is to connect them using PostGIS.
Figure 25: Uploading to Geoserver using PostGIS
In Figure 25, the shapefile (.shp) data file is imported to the GeoServer which works as a web application server, that communicates with the database, and provides different data layers as OGC standard services to Tomcat web server, that can be then accessed by front-end development after these data layers are published as GeoServer WMS services.
Figure 26: 1_kerros_centria and kokkola_city_area is published through Geoserver
In Figure 26, illustrates two data layers that are posted by PostGIS and it appears in Geoserver Layers section. In the picture the layers type, name, store-space name, and map-projection type are shown. In type section, it displays the data type of each data layer, in the case of “1_kerros_centria” and “kok-kola_city_area”, the data type is a polygon data type in vector representation modal. Store-space name simply means it is a folder name for all the data in a certain project that can be created by Geoserver. The map projection is a standard that is been created mostly by countries. It is a math operation aimed for changing the spherical Earth into the second dimension to assist the coordinate allocation system in GIS. (Sungsoon & Cassie 2019.)
Figure 27: Layer preview from Geoserver
Figure 27 gives a brief idea of how the server and the database are connected. Once the PostgreSQL database is connected with Geoserver, with the help of “demoDB” database username, password and port declared at the beginning of PostgreSQL installation. The feature layer of the first floor of Centria University of Applied Sciences in vector data representation model is shown in Geoserver’s layer pre-view.
Figure 28: The data layer is presented by using Openlayers 4.6.5 via HTTP request In Figure 28, the Web Map Service layer is reached by URL and, the layer is hosted by lo-calhost:8080/geoserver. The layer is presented and added using Openlayer 4.6.5 without any styles and the name of each classroom is not shown. In order to make the color styling work in this WMS data layer, the .sld styling file is downloaded from the QGIS Desktop 3.4.12 layer properties section. This file is then uploaded to Geoserver to style the WMS layer.
Figure 29: After managing styles using .sld files from Geoserver.
The .sld design file is downloaded from QGIS and then added to Geoserver style section. Figure 29 is the coloured implementation and each classroom’s name are showing with label marking on the layer. In this demonstration, the limitation of Geoserver hosted WMS data layer arises, that from the front-end point of view. The styling for these layers become very difficult to implement because the presentation tier has no straight access to the data tier. Instead, modifying the style via front-end technology the server-side operation is more efficient. Moreover, in this open-sourced web GIS demonstration the source URL of WMS layer is based on HTTP standard, which is not that secure than using HTTPS standard URL, which is the combination of HTTP and SSL encryption.
3.6 Other GIS Solutions
Using the Internet and the World Wide Web for mapping applications is common in today’s life. Instead of ArcGIS, Google Maps solution, there are many other solutions. When talking about web GIS, there are thousands of digital map solutions based on the web worldwide.
OpenStreetMap (OMS) is one of the open-source solutions for digital mapping based on the Web 2.0 framework. The project begins in 2004 founded by Steve Coast, and sponsored by OpenStreetMap Foun-dation (OSMF). This open-source project is aimed for creating a free digital map of the world and is free
editable for all the web end-users through web editor ID and Advanced editor JOSM, which is the ex-tensible editor for OpenStreetMap for Java 8+. This project idea is based on Wikipedia, and for this reason, the project sometimes is also referred to Wikipedia of Maps. (Mordechai. 2009)
MapInfo is another GIS desktop solution for data visualization, and digital mapping created by US MapInfo Corporation. The application is based on map application ideology. It took advantage with the automation of office work, multiple types of data in different databases, merging with computing map-ping method, uses the geospatial database technology, added the spatial data analysis functionality to form a very useful GIS solution. It supports GeoPackage data format, WMTS 1.0, and WFS 2.0 (pit-neybowes 2019.)
Here is another GIS solution provider, which was started in 1985 that focuses on digitizing mapping and pioneer car sensor. The technologies provided by Here supports tracking and positioning: indoor posi-tioning, network posiposi-tioning, and tracking devices. For the automation for cars, i.e. parking, looking for preferred fuel station, destination weather support, hazard warning, road signs, and real-time traffic. For the Location services, it provides geocoding, geo-visualization. (Here. 2019)
4 CONCLUSIONS
The objective of this study was to find out what is the geographical information system and what is the technical implementation laying behind it. The key fundamentals for spatial data representation, map projection, OCG standards, about WMS and WFS layers, and core Web GIS fundamentals are covered. The aim was to find out as many ways to present the data with a geographical information system. The goal was reached by researching professional literature, and by making real case deportations presented in this thesis.
In the study, the different mapping technologies were discussed. Three different technologies were taken as case studies to make the study specific. These technologies were Google Maps JavaScript API, ArcGIS JavaScript API, and self-hosted Mapping with Openlayers as the presentation tier, Geoserver as a web application that is inside Tomcat web server as the logical tier, and PostgreSQL database with extension of PostGIS as the data tier to form a completely self-hosted geographical information system with no dependence of third party organization, for example, Google and Eris. Furthermore, other dif-ferent solutions were shortly stated, while OpenStreetMap, MapInfo, and Here were mentioned.
Moreover, with these case study demonstrations, the self-positioning via Bluetooth inside Centria Uni-versity of Applied Sciences in real-time can be further implemented to give more information to help to illustrate where, what different classrooms are there. In addition, about the availability of these class-rooms and its related details, for example the course details. It can also provide a warning message if the student’s class is changed to another classroom and shows up where that new classroom is.
It is also possible to link the web GIS through different APIs to some other system in order to offer other functionalities to the user. Take an example with an official travel agency application where the user can see the travel program in real-time based on Google Maps API.
REFERENCES
ArcGIS API for JavaScript. 2019. ArcGIS API for JavaScript Overview Available: https://develop-ers.arcgis.com/javascript/3/jshelp/. Accessed: 8.11.2019
Anthony, S. 2019. What’s Going On? GIS Today. Available: https://www.gisinc.com/blog/whats-go-ing-on-gis-today. Accessed: 9.12.2019
Buqu, T. 2017. Web GIS Design Plan. Available: https://blog.csdn.net/BuquTianya/article/de-tails/38641103. Accessed: 31.10.2019
Computer History Museum. 2019. What’s the Difference Between the Internet and the Web? Availa-ble: https://www.computerhistory.org/revolution/networking/19/314. Accessed 15.10.2019
Computer Hope. 2019. Web Application. Available: https://www.computerhope.com/jargon/w/web-application.htm. Accessed: 16.10.2019
DeMers, M. N. 2009 GIS For Dummies India: Wiley Publishing, Inc.’
Dempsey, C. 2012. History of GIS. Available: https://www.gislounge.com/history-of-gis/ Accessed 21.9.2019
Dempsey, C. 2019. What is GIS? Available: https://www.gislounge.com/what-is-gis/ Accessed 16.9.2019.
Eris. 2019a. About web GIS. Available: https://enterprise.arcgis.com/en/server/latest/create-web-apps/windows/about-web-gis.htm. Accessed: 28.10.2019
Eris. 2019b. History of GIS. Available: https://www.esri.com/en-us/what-is-gis/history-of-gis Ac-cessed 21.9.2019
Fazal, S. 2008. GIS Basics. India: New Age International Ltd
Fu, P. & Sun, J. 2011. Web GIS. 1st ed. Redlands (California): Esri Press. Fu, P. 2012. Web GIS: Principles and Applications. China: Eris
Gacheru, E. 2019. Two-tier Vs Three-tier Architecture. Available: https://medium.com/@gache-ruevans0/2-tier-vs-3-tier-architecture-26db56fe7e9c. Accessed 16.10.2019
GISGeography. 2019. The Remarkable History of GIS. Available: https://gisgeography.com/history-of-gis/. Accessed 24.9.2019
Google Maps Platform. 2019. Overview. Available: https://developers.google.com/maps/documenta-tion/javascript/tutorial. Accessed: 6.11.2019
pitneybowes. 2019. MapInfo Pro v17 Documentation ebook. p4 Available:
https://www.pit-neybowes.com/us/location-intelligence/geographic-information-systems/mapinfo-pro.html. Accessed: 25.11.2019
Majid, H. 2014. What is the Difference Between Web GIS and Internet GIS? Available: https://www.gislounge.com/difference-web-gis-internet-gis/. Accessed 15.10.2019
Mariano, P., Eluzai, A., Tati de, A., George, F., Henrique, R. Maristela, H. 2012. An Architecture for Geographic Information Systems on the Web – webGIS. GEOProcessing 2012. The Fourth Interna-tional Conference on Advanced Geographic Information Systems, Applications, and Services. 209-214.
MDN. 2019a. CSS: Cascading Style Sheets. Available: https://developer.mozilla.org/en-US/docs/Web/CSS. Accessed: 31.10.2019
MDN. 2019b. HTML: Hypertext Markup Language. Available: https://developer.mozilla.org/en-US/docs/Web/HTML. Accessed: 31.10.2019
MDN. 2019c. JavaScript. Available: https://developer.mozilla.org/en-US/docs/Web/JavaScript. Ac-cessed: 31.10.2019
Mordechai, H. 2009. How good is volunteered geographical information? A comparative study of OpenStreetMap and Ordnance Survey datasets. Department of Civil, Environmental, and Geomatic Engineering, University College London. 682 – 703
OGC. 2019a. OGC Standards and Supporting Documents. Available: https://www.opengeospa-tial.org/standards. Accessed: 31.10.2019
OGC. 2019b. OpenGIS Web Feature Service 2.0 Interface Standard – With Corrigendum v2.0.2 OGC. 2019c. OpenGIS Web Map Server Implementation Specification v1.3.0
Openlayers. 2019. Overview. Available: https://openlayers.org/. Accessed: 31.10.2019
Peng, Z.R. 2003. Internet GIS: distributed geographic information services for the Internet and wire-less networks. USA: John Wiley & Sons, Inc.
Peuralahti, J. 2014. Geographic Information System. Helsinki Metropolia University of Applied Sci-ences. Master’s thesis.