HAL Id: hal-02197062
https://hal.archives-ouvertes.fr/hal-02197062
Submitted on 30 Jul 2019
HAL
is a multi-disciplinary open access
archive for the deposit and dissemination of
sci-entific research documents, whether they are
pub-lished or not. The documents may come from
teaching and research institutions in France or
abroad, or from public or private research centers.
L’archive ouverte pluridisciplinaire
HAL
, est
destinée au dépôt et à la diffusion de documents
scientifiques de niveau recherche, publiés ou non,
émanant des établissements d’enseignement et de
recherche français ou étrangers, des laboratoires
publics ou privés.
What is Interaction for Data Visualization?
Evanthia Dimara, Charles Perin
To cite this version:
Evanthia Dimara, Charles Perin. What is Interaction for Data Visualization?. IEEE Transactions on
Visualization and Computer Graphics, Institute of Electrical and Electronics Engineers, 2020, 26 (1),
pp.119 - 129. �10.1109/TVCG.2019.2934283�. �hal-02197062�
What is Interaction for Data Visualization?
Evanthia Dimara and Charles Perin∗Abstract—Interaction is fundamental to data visualization, but what “interaction” means in the context of visualization is ambiguous and confusing. We argue that this confusion is due to a lack of consensual definition. To tackle this problem, we start by synthesizing aninclusive viewof interaction in the visualization community – including insights from information visualization, visual analytics and scientific visualization, as well as the input of both senior and junior visualization researchers. Once this view takes shape, we look at how interaction is defined in the field of human-computer interaction (HCI). By extracting commonalities and differences between the views of interaction in visualization and in HCI, we synthesize adefinition of interaction for visualization. Our definition is meant to be a thinking tool and inspire novel and bolder interaction design practices. We hope that by better understanding what interaction in visualization is and what it can be, we will enrich the quality of interaction in visualization systems and empower those who use them. Index Terms—interaction, visualization, data, definition, human-computer interaction.
1 INTRODUCTION
The notion of interaction has been a challenging concept to define in the field of Human-Computer Interaction (HCI). Only recently, an HCI review entitled “What is interaction?” [56] summarized concepts that describe the causal relationships between the human and the computer. While this HCI review outlines opportunities for enriching interactivity with computer systems, it is unclear how these concepts relate to visu-alization. Therefore, while visualization researchers and practitioners may be aware of such interaction concepts, they do not necessarily see how to apply them to their own data-oriented practices and needs.
Meanwhile in the past decade we have witnessed a growing call for enriching interactivity in visualization systems. Forward-looking research on interaction for visualization advocate for visualization systems that give absolute freedom to end users to actively restruc-ture [73, 100], sketch [75], author [69, 119] and personalize [57, 111] visualizations; to construct visualizations from scratch [59], perform data-aware annotations on them [54, 117], and unruly remove distract-ing information [29]; to enrich visualizations with external knowl-edge [118], control fluently [36] both data presentations [101] and data pre-processing statistical functions [37]; to indicate uncertainty [82], collaborate with peers [55, 80], and interact with visualizations using natural means [66, 74] within physically situated settings [63, 73, 121]. We argue that a strong barrier to achieving this vision is not only that of the technical challenges, but like in HCI, that ofdefining interaction
for visualization. In the visualization pipeline [16], interaction occurs at
all stages of the visualization process of turning raw data into views on the data. While the visualization community has iteratively structured and formalized the representation aspect of the pipeline, significantly less attention has been paid to the interaction aspect [36, 72, 74, 99]. The nature and role of interaction has actually sparked discussions and arguments since the visualization field was created. As of today there is no consensus on what interaction is, and what its role for visualization is – as interaction is an elusive and overloaded term [74, 92, 126].
To address this problem, we first capture the current view of interac-tion from the visualizainterac-tion community based on the input of researchers. Once this view takes shape, we revisit the view of interaction from the HCI community [56] to understand how the two views differ and relate to each other. Combining these two perspectives, we then propose a
• Evanthia Dimara is with Sorbonne University. E-mail: [email protected].
• Charles Perin is with University of Victoria. E-mail: [email protected].
∗All authors contributed equally to this manuscript, with the exception of the
first author who did most of the work.
This is the author’s version of the work.
To appear in IEEE Transactions on Visualization and Computer Graphics.
definition of interaction for visualization. This definition attempts to
broadenthe scope of interaction in visualization and isinclusiveas it
considers the perspectives of information visualization, visual analyt-ics, and scientific visualization. We further extend this definition to operationalizeflexibilitywithin visualization systems, based on where interactions occursemanticallyin thevisualization pipeline. We hope that this definition will spur novel, bolder interaction design practices in visualization, and the growth of more flexible visualization tools.
2 A REVIEW OFINTERACTION FORVISUALIZATION
To capture the view of interaction in visualization, we started with a list of papers based on our own expertise and expert input. Then we applied a recursive process to expand our review while accounting for our own bias. We describe our methodology rationale, method for collecting papers, questionnaire we sent to experts, paper collection method, and tagging method. Then we present the summary statistics of the review.
2.1 Methodology Rationale
The topic of interaction in visualization is broad; arguably most visual-ization papers mention interaction at a point. Thus we discarded the systematic review and instead opted for acritical review, that needs not be exhaustive but requires a more detailed examination of the litera-ture [46]. Because critical reviews seek to identify the most significant items in the field [46], we set the three following requirements: R1:: The view of interaction of the community cannot be captured only by citation number, it needs to include expert input.
R2:: The snowballing approach alone (starting with a set of seed papers and expanding using back- and forward-references) is not sufficient because it is biased by the selection of seed papers.
R3:: The review must not include HCI papers unrelated to visualization. We used two metrics to measure the impact and relevance of a paper
Pbased on publication yearPy.IIImmmpppaaaccctttPPP= (Pc/10)/(current year−
Py+1)measures the importance of the paper to the community based
on its number of citationsPc.RRReeellleeevvvaaannnccceeePPP=Pf/(current year−Py+
1) + (Pb+1)/(Py−1980+1) measures the relevance to the topic of
interaction based on its number of forward referencesPfand backward
referencesPb(i.e., papers that cite, and that are cited by,P) that contain
both “interaction” and “visualization” in their title. 1980 is the year of the oldest paper [17] we collected. These metrics identify both highly relevant and impactful papers, while not relying solely on bibliometrics. We set the inclusion criteria toImpactP>0.5, keeping papers with
roughly more than 10 citations a year, and toRelevanceP>0.2, keeping
papers with roughly more than two forward or backward references with the keywords “interaction” and “visualization” in their title every 10 year. These cutoffs (which are broad to prevent false negatives) include important papers but exclude some clearly non-relevant ones.
2.2 Review Questionnaire
We sent visualization researchers an online form asking for: (1) defini-tionpapers, the papers that attempt to define interaction in visualization;
(2)relevantpapers to the topic of interaction; (3) their years of
visu-alization experience; and (4) theirinteraction experienceon a 7-point
scale describing how often their own papers focus on interaction. There were also three optional fields: name, email, and comments.
2.3 Method for Collecting Papers
We created a list ofseedpapers with the following snowballing method: Step 1: We started from our own list of 5definitionpapers (R1). Step 2: We sent the questionnaire to expert visualization researchers
who suggested bothdefinitionandlinkedpapers (R1,R2). Step 3: We included in the list ofseedpapers each paperPthat:
• was included in our initial list of 5definitionpapers or was suggested as adefinitionpaper at least once; and
• is a journal article or conference paper – to avoid non-peer reviewed entries such as demos; and
• has the term “visualization” in the title or abstract (R3); and • hasRelevanceP>0.2 andImpactP>0.5.
In addition, considering that expert input can provide insights not captured by our computational method (R1), we included in the list ofseedpapers those that did not fulfill these inclusion criteria but that were suggested asdefinitionpaper three times or more. Step 4: We repeated Step 2, sending the questionnaire to all
(non-previously contacted) authors of the added seed papers. We then repeated Step 3 with the new suggestions. We stopped the recursion when no newseedpaper or author was found. Once the list ofseedpapers finalized, we derived a set oflinkedpapers. A paperPislinkedif it isnot seedand one of the following is true:
• Pis suggested by two or more experts asdefinitionorrelevant; • P cites or is cited by aseed paper and its title contains both
“visualization” and “interaction”.
2.4 Method for Tagging Papers with Interaction Themes
We (the two authors of this paper) developed tags (short labels) to characterize theseedandlinkedpapers using an iterative deductive coding method [88]. Specifically, we identified emerging themes from readingseedpapers with the lens of capturing: i) the current view of interaction in visualization; ii) problems raised by the community; and iii) existing archetypal descriptions and categorizations of interactions. We then refined these tags incrementally until we obtained a high inter-coder agreement. We then coded allseedandlinkedpapers. We measured inter-coder agreement using Cohen’s Kappa [24] (K), that accounts for the possibility that agreement occurs by chance. There is no strict rule regarding how to interpret values ofK, but inter-reliability is considered satisfactory forK≥0.7 and excellent forK>0.75 [41]. For the first coding iteration, we used plain tag names. We indepen-dently tagged 6seedpapers using the tag names described below with binary values (a paper either has the tag or not). We obtainedK=0.57. We discussed similarities and differences in our tagging, then wrote the detailed definitions for each tag presented below. We switched to three values: 0 (not applicable tag), 1 (partial fit of the tag), and 2 (good fit of the tag). For the second iteration, we independently coded again the 6 firstseedpapers (K=0.83), as well as 6 additionalseedpapers (K=0.78), showing excellent agreement(K>0.75). For the third iteration, we independently coded 12 newseedpapers. We obtained
K=0.87, which allowed us to have a single coder per remaining paper. Tag — Definition of Interaction: attempt to define, explain or de-scribe interaction. A rating of 1 marks implicit attempts, including definitions based on specific properties or attributes of interaction. A rating of 2 marks direct definitions (formal or informal, e.g., “interac-tion is ...”).
Tag — Critical on Interaction: complaints and frustrations (using a negative tone) about interaction, to reveal areas of improvement and challenges. A rating of 1 marks brief complaints. A rating of 2 marks extensive discussions of complaints.
Tag — Benefits of Interaction: positive aspects of interaction (actual or expected). A rating of 1 marks brief (or moderately phrased) dis-cussions of benefits. A rating of 2 marks more elaborated (or strongly phrased) discussions of benefits.
Tag — Interaction Concepts: archetypal description of interaction. Given to papers that contribute one of: “concept”, “model”, “frame-work”, “design space”, “paradigm”. A rating of 1 marks concepts with small or unclear relation to interaction. A rating of 2 marks concepts with interaction as a key element (e.g., an interaction model). Tag — Interactive Pipeline: discussion of interaction in relation to the visualization pipeline, a fundamental concept that transcends sub-domains of visualization and explicitly includes interaction. It is given to papers that use the word “pipeline” or cite one of [16, 20, 21, 48]. A rating of 1 indicates that the existence of interaction is unclear. A rating of 2 indicates that the interaction component is clearly discussed. Tag — List: contribution of a list (e.g., of interaction techniques, tasks, or intents). We callformala list that is described with one of the follow-ing words: “taxonomy”, “classification”, “typology”, “categorization”. A rating of 1 marks an informal review (it does not contain any of the formal keywords). A rating of 2 marks a formal review.
2.5 Summary Statistics of the Review1
RECRUITING: We emailed 77 visualization experts over a two-month period. 64/77 were successfully delivered. 34/77 were in our initial list of experts and the remaining 43/77 were derived through our re-cursive algorithm. While we started with a bias toward information visualization (e.g., [36, 72, 79, 106]), our algorithm expanded the scope naturally to visual analytics (e.g., [37, 45, 50, 92]), scientific visualiza-tion (e.g., [1, 66, 67, 77]) and digital cartography (e.g., [98, 99]).
PARTICIPANTS: 22 visualization researchers responded to the survey. They had 5–32 (M: 13.6,SD: 6.2) years ofvisualization experience. 12/22 were authors ofseedpapers, and 14/22 were authors oflinked
papers; 2/22 completed the survey anonymously. Participants rated theirinteraction expertisewith a mean of 5.9/7 (SD: 0.8).
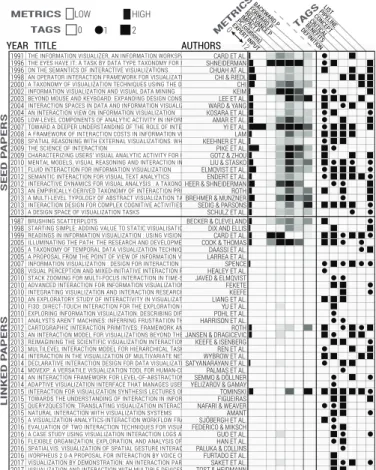
SEED PAPERS: Fig. 1 presents all 59 tagged papers. We started with
5definitionpaper based on our expertise. Participants suggested 114
(83 unique)definitionpapers (6 did not suggest anydefinitionpaper). Applying our recursive algorithm resulted in a set of 23seedpapers.
LINKED PAPERS: Participants suggested 61 (51 unique)relevantpapers. Forward and backward searches gave 105 papers citing, and 104 papers being cited by aseedpaper. Ourlinkedpaper collection algorithm gave 47linkedpapers. We excluded 7 theses, 3 unpublished and 1 non-English reports. This resulted in 36linkedpapers.
TAGS: The derived tags were: definition: 32; benefit: 39; critical: 36; concept: 20; pipeline: 12; and list: 35.
3 THEVISUALIZATIONVIEW OFINTERACTION
In this section, we synthesize the current view of interaction in visu-alization basedonlyon the points of view of the 59seedandlinked
papers we reviewed (see Fig. 1). We elaborate on our own critique of this literature in Sect. 4 and Sect. 5. While we reviewed all 59 papers, due to space limitations, we only cite papers which have been cited more than twice – and provide all papers in supplementary material.
3.1 Definitions of Interaction for Visualization
Interaction has been identified as anoverloaded[92] andelusive[36,74] term, and it is challenging to find a solid definition of interaction [36, 74, 126]. Therefore, we consider the 32 papers with a definition tag – whether they attempt to define interaction implicitly or explicitly.
3.1.1 What Interaction for Visualization Must Involve
The definition papers reveal mandatory components of interaction, namely: external and internal entities, external and internal actions.
EXTERNAL ENTITIES: The two most cited mandatory entities are theuserand thedata. Theuser(oranalyst[8, 37, 112]) is a human
THE INFORMATION VISUALIZER, AN INFORMATION WORKSPACE
THE EYES HAVE IT: A TASK BY DATA TYPE TAXONOMY FOR INFORMATION VISUALIZATIONS. ON THE SEMANTICS OF INTERACTIVE VISUALIZATIONS.
AN OPERATOR INTERACTION FRAMEWORK FOR VISUALIZATION SYSTEMS A TAXONOMY OF VISUALIZATION TECHNIQUES USING THE DATA STATE REFERENCE MODEL INFORMATION VISUALIZATION AND VISUAL DATA MINING
BEYOND MOUSE AND KEYBOARD: EXPANDING DESIGN CONSIDERATIONS FOR INFORMATION VISUALIZATION INTERACTIONS INTERACTION SPACES IN DATA AND INFORMATION VISUALIZATION
AN INTERACTION VIEW ON INFORMATION VISUALIZATION
LOW-LEVEL COMPONENTS OF ANALYTIC ACTIVITY IN INFORMATION VISUALIZATION TOWARD A DEEPER UNDERSTANDING OF THE ROLE OF INTERACTION IN INFORMATION VISUALIZATION A FRAMEWORK OF INTERACTION COSTS IN INFORMATION VISUALIZATION
SPATIAL REASONING WITH EXTERNAL VISUALIZATIONS: WHAT MATTERS IS WHAT YOU SEE, NOT WHETHER YOU INTERACT THE SCIENCE OF INTERACTION
CHARACTERIZING USERS’ VISUAL ANALYTIC ACTIVITY FOR INSIGHT PROVENANCE
MENTAL MODELS, VISUAL REASONING AND INTERACTION IN INFORMATION VISUALIZATION: A TOP-DOWN PERSPECTIVE FLUID INTERACTION FOR INFORMATION VISUALIZATION
SEMANTIC INTERACTION FOR VISUAL TEXT ANALYTICS
INTERACTIVE DYNAMICS FOR VISUAL ANALYSIS : A TAXONOMY OF TOOLS THAT SUPPORT THE FLUENT AND FLEXIBLE USE OF VISUALIZATIONS AN EMPIRICALLY-DERIVED TAXONOMY OF INTERACTION PRIMITIVES FOR INTERACTIVE CARTOGRAPHY AND GEOVISUALIZATION A MULTI-LEVEL TYPOLOGY OF ABSTRACT VISUALIZATION TASKS
INTERACTION DESIGN FOR COMPLEX COGNITIVE ACTIVITIES WITH VISUAL REPRESENTATIONS: A PATTERN-BASED APPROACH A DESIGN SPACE OF VISUALIZATION TASKS
BRUSHING SCATTERPLOTS
STARTING SIMPLE: ADDING VALUE TO STATIC VISUALISATION THROUGH SIMPLE INTERACTION READINGS IN INFORMATION VISUALIZATION : USING VISION TO THINK
ILLUMINATING THE PATH: THE RESEARCH AND DEVELOPMENT AGENDA FOR VISUAL ANALYTICS A TAXONOMY OF TEMPORAL DATA VISUALIZATION TECHNIQUES ???? (NOT SURE HOW THIS PAPER APPEARED)
A PROPOSAL FROM THE POINT OF VIEW OF INFORMATION VISUALIZATION AND HUMAN COMPUTER INTERACTION FOR THE VISUALIZATION OF DISTRIBUTED SYSTEM LOAD INFORMATION VISUALIZATION : DESIGN FOR INTERACTION
VISUAL PERCEPTION AND MIXED-INITIATIVE INTERACTION FOR ASSISTED VISUALIZATION DESIGN STACK ZOOMING FOR MULTI-FOCUS INTERACTION IN TIME-SERIES DATA VISUALIZATION ADVANCED INTERACTION FOR INFORMATION VISUALIZATION.
INTEGRATING VISUALIZATION AND INTERACTION RESEARCH TO IMPROVE SCIENTIFIC WORKFLOWS AN EXPLORATORY STUDY OF INTERACTIVITY IN VISUALIZATION TOOLS:'FLOW'OF INTERACTION FI3D: DIRECT-TOUCH INTERACTION FOR THE EXPLORATION OF 3D SCIENTIFIC VISUALIZATION SPACES EXPLORING INFORMATION VISUALIZATION: DESCRIBING DIFFERENT INTERACTION PATTERNS ANALYSTS AREN'T MACHINES: INFERRING FRUSTRATION THROUGH VISUALIZATION INTERACTION CARTOGRAPHIC INTERACTION PRIMITIVES: FRAMEWORK AND SYNTHESIS
AN INTERACTION MODEL FOR VISUALIZATIONS BEYOND THE DESKTOP REIMAGINING THE SCIENTIFIC VISUALIZATION INTERACTION PARADIGM
MULTILEVEL INTERACTION MODEL FOR HIERARCHICAL TASKS IN INFORMATION VISUALIZATION INTERACTION IN THE VISUALIZATION OF MULTIVARIATE NETWORKS
DECLARATIVE INTERACTION DESIGN FOR DATA VISUALIZATION
MOVEXP: A VERSATILE VISUALIZATION TOOL FOR HUMAN-COMPUTER INTERACTION STUDIES WITH 3D PERFORMANCE AND BIOMECHANICAL DATA AN INTERACTION FRAMEWORK FOR LEVEL-OF-ABSTRACTION VISUALIZATION OF 3D GEOVIRTUAL ENVIRONMENTS
ADAPTIVE VISUALIZATION INTERFACE THAT MANAGES USER'S COGNITIVE LOAD BASED ON INTERACTION CHARACTERISTICS INTERACTION FOR VISUALIZATION SYNTHESIS LECTURES ON VISUALIZATION
TOWARDS THE UNDERSTANDING OF INTERACTION IN INFORMATION VISUALIZATION QUERY2QUESTION: TRANSLATING VISUALIZATION INTERACTION INTO NATURAL LANGUAGE NATURAL INTERACTION WITH VISUALIZATION SYSTEMS
A VISUALIZATION-ANALYTICS-INTERACTION WORKFLOW FRAMEWORK FOR EXPLORATORY AND EXPLANATORY SEARCH ON GEO-LOCATED SEARCH DATA USING THE MEME MEDIA DIGITAL DASHBOARD EVALUATION OF TWO INTERACTION TECHNIQUES FOR VISUALIZATION OF DYNAMIC GRAPHS
A CASE STUDY USING VISUALIZATION INTERACTION LOGS AND INSIGHT METRICS TO UNDERSTAND HOW ANALYSTS ARRIVE AT INSIGHTS FLEXIBLE ORGANIZATION, EXPLORATION, AND ANALYSIS OF VISUALIZATION APPLICATION INTERACTION EVENTS USING VISUAL ANALYTICS SPATIALVIS: VISUALIZATION OF SPATIAL GESTURE INTERACTION LOGS
IVORPHEUS 2.0-A PROPOSAL FOR INTERACTION BY VOICE COMMAND-CONTROL IN THREE DIMENSIONAL ENVIRONMENTS OF INFORMATION VISUALIZATION VISUALIZATION BY DEMONSTRATION: AN INTERACTION PARADIGM FOR VISUAL DATA EXPLORATION
VISUALIZATION AND INTERACTION WITH MULTIPLE DEVICES. A CASE STUDY ON REACHABILITY OF REMOTE AREAS FOR EMERGENCY MANAGEMENT AUTHORS TITLE YEAR LOW HIGH 0 1 2 S EED P APERS LINKED P APERS TAGS METRICS TAGS METRICS CONCEPTPIPELI NE RELE VANCE P FOR WARD P EXPERT INPUTPC (citations)IMPACT P
BACK WARD P 0 12 CRITICAL BENEFITS DEFINITION 1991 1996 1996 1998 2000 2002 2003 2004 2004 2005 2007 2008 2008 2009 2009 2010 2011 2012 2012 2013 2013 2013 2013 1987 1998 1999 2005 2005 2005 2007 2008 2010 2010 2010 2010 2010 2010 2011 2012 2013 2013 2013 2014 2014 2014 2014 2014 2015 2015 2015 2015 2015 2016 2016 2016 2016 2016 2017 2017 CARD ET AL. SHNEIDERMAN CHUAH AT AL. CHI & RIEDL CHI KEIM LEE ET AL. WARD & YANG KOSARA ET AL. AMAR ET AL. YI ET AL. LAM KEEHNER ET AL. PIKE ET AL. GOTZ & ZHOU LIU & STASKO ELMQVIST ET AL. ENDERT ET AL. HEER & SHNEIDERMAN ROTH BREHMER & MUNZNER SEDIG & PARSONS SCHULZ ET AL. BECKER & CLEVELAND DIX AND ELLIS CARD ET AL. COOK & THOMAS DAASSI ET AL. LARREA ET AL. SPENCE HEALEY ET AL. JAVED & ELMQVIST FEKETE KEEFE LIANG ET AL. YU ET AL. POHL ET AL. HARRISON ET AL. ROTH JANSEN & DRAGICEVIC KEEFE & ISENBERG REN ET AL. WYBROW ET AL. SATYANARAYAN ET AL. PALMAS ET AL. SEMMO & DÖLLNER YELIZAROV & GAMAY TOMINSKI FIGUEIRAS NAFARI & WEAVER AMANT SJÖBERGH ET AL. FEDERICO & MIKSCH GUO ET AL. HAN ET AL. PALUKA & COLLINS FURTADO ET AL. SAKET ET AL. TOST & HEIDMANN
LIST
Fig. 1. The 23seedand 36linkedpapers in our review, ordered by year. It shows expert input, the algorithm metrics, and our tagging scores.
being who can be characterized by skills [36], abilities, expertise and motivation [99], and who initiates the interaction [104]. Some papers differentiate between end-users and designers [22]. Thedatais an intangible information source that is the user’s main object of interest. The mean with which the user interacts with the data is amediating
[98, 99] entity that we call thevisualization system. The visualization system (either as a whole or some of its components) is referred to as
technology[74, 99, 104],computational tools[92] andcomputer[8]
withhardware and software[8], when emphasizing its technological
properties;representation[76,104,126],visualization[16,19,22,45,67, 68,72,79,99,120],map[98],graphical marks[2,22],display[8,74,106],
visual metaphor[37] andnon-static image[70], when emphasizing its
visual properties; andinterface[19, 22, 36, 76, 92, 98, 99, 104],system
[19, 36, 45, 62, 74, 123, 126],analysis tool[92],workspace[19] and
interaction space[104], when referring to a more abstract mediating
entity. Some papers add that the mediating entity should provide aset
of controls[92] for the user to access the data.
Most papers identifytimeas a fundamental entity of interaction [16, 62, 76, 126]. Interaction, unlike representation [126], is seen as a real-time [8, 98] action with a start and an end [74] that should result in an immediate response from the visualization system [16, 19, 36, 106, 123].
INTERNAL ENTITIES: Interaction is characterized as a goal-oriented activity [53, 62, 92] involving a data-orientedintent. Intent[36, 45, 74, 76, 79, 84, 92] is also phrased asgoal[45, 62, 76, 92, 97–99, 123],
task[45, 67, 106] orproblem[53, 92]. Intent can describe a high-level data exploration [19, 45, 62, 68, 84, 92, 126], the generation of insights [45, 62, 92, 98, 99, 126], and the need to acquire multiple perspectives on the data [62, 92, 104, 126]. Intent can go beyond exploration, such as the intent to collect and correct data [62], or social intents to coordinate in collaborative setups and to present data to an audience [62]. Intent is both identified at a low, operational level, e.g., to alter the representation [19, 126], and at a higher level, e.g., for information foraging [79], sensemaking [99, 104], and knowledge creation [92].
EXTERNAL ACTIONS: Interaction is described as adialoguebetween the user and the visualization system [36, 76, 92, 98, 104, 123, 126] made of action-reaction pairs [76, 104]. The user performs anaction(or
input[22, 102]) on the visualization system [45, 67, 72, 76, 79, 104]. The
visualization system returns a reaction [74, 76, 104] (orresponse[19, 67, 74,76,98,106,120,126],change[8,16,22,98,120,126],output[22,102]) that isperceived by the user[72, 104, 120]. This reaction has been calledpermutation of graphical marks[2],change of transformation
parameters[123], andalteration of the pipeline[62].
INTERNAL ACTIONS: Along with its physical acts, interaction with a visualization system involves a cognitive act of the user [37, 92, 104] or, similarly, a reasoning/analytic process [67, 76, 79, 97] on the data.
3.1.2 What Interaction for Visualization Can Involve
Interaction for visualization can involve additional external and internal entities, and additional external and internal actions.
EXTERNAL ENTITIES: Interaction can involve external physical objects [62, 74, 106] such as mouse [79], pen [74] keyboard [79] and physical constraints [99]. It can also involve a variety of modalities such as body movements [19, 74], speech [74], head [79] and eye movement [79]. Many modalities (e.g., gaze, head) tend to be overlooked in visualization. Restricting modalities leads to a “disjointed picture of
human performance” [79] and lost opportunities to capture user intent
[79]. Interaction also involves the environment under which interaction occurs, for example whether it is a casual or working environment [99], and whether there are multiple users involved [62, 74, 92, 99].
INTERNAL ENTITIES: Users’ prior knowledge [92], internal mental representation [104], skills [36] and abilities [99] can be involved when interacting with a visualization system. While interaction can start with a concrete user query [19, 45, 84, 106], it can also lead to the internalization of new goals [104]. Moreover, interactions might occur with an absence of intent, such as with proxemics interactions [74].
EXTERNAL ACTIONS: Interaction can involve many user actions. Such action can change the data [16, 22, 45, 76, 84, 92, 102, 104], e.g., with filtering and aggregation [102]. It can change the representation and presentation of information [8, 16, 19, 37, 45, 68, 79, 84, 104], e.g., with sorting [45] or when switching from a map to a timeline [45]. It can create metadata, for example by temporarily marking data to track, annotate or bookmark [37,45,84]. It can create new data representations [74, 79] and new data, to express and manipulate new knowledge [37, 45, 104], e.g., with note taking and when manipulating a knowledge management component [45]. A user can perform an action that does not occur on the data or their representation, e.g. adjusting a movable baseline to compare the heights of a histogram [126], performing a metaction on their own action history, (undo/redo) [45], and steering a statistical data model [37]. Last, along with the dialogue between the user and the visualization system, there is also the dialogue of users with the external environment [92] and with their peers [62, 74, 92, 99].
INTERNAL ACTIONS: While interaction with a data source is enabled within the context of a tangible visualization system, much of it can occur internally in user’s mind [74, 92], for example information pro-cessing [104], memory encoding [104], and simulative reasoning [79]. On a deeper level, the interaction takes the form of a dialogue between
the“internal representations and processes of the user and the external
representations and processes”of the visualization system [104].
3.1.3 Properties of Interaction
Interaction for visualization is characterized as agoal-oriented[62, 76, 92, 97–99, 123] activity that contains semantics [22, 45], that is
sequential[22, 45, 98, 104],incremental[16, 36, 37, 106], anditerative
[19, 98, 104], and preserves the following properties:
GRANULARITY: Interaction is characterized at multiple levels of gran-ularity [2, 45, 62, 76, 102, 104]. Such levels include micro-level (e.g., mouse clicks), macro-level (e.g. hypothesis generation) and levels in between (e.g., filter, sort). To distinguish these levels, terms such as
{subtasks,tasks,activities}[2],{events,actions,subtasks,tasks}[45]
it is often unclear whether these levels refer to interaction per se or to user intent. The lack of distinction between levels of interaction results in no established conceptualization and vocabulary [104].
CONTINUOUS VS. DISCRETE: The temporal dimension, which is a fundamental entity of interaction (see Sect. 3.1.1), is either continuous or discrete [76, 84]. Continuous interactionsinvolve a sequence of intermediate visualization states between an initial state and a goal state (e.g., mouse drags to perform a lasso selection) [84]. Such interactions happen over a span of time [76]. Withdiscrete interactions, action and reaction occur in a distinct manner [76] (e.g., clicking on a checkbox to toggle filtering [84]). Action and reaction can have different continuity (e.g., a continuous action can have a discrete reaction [76]).
DIRECT VS.INDIRECT: Directness is associated with continuous repre-sentation of the objects of interest, rapid, incremental, and reversible user actions; allowing for usage with minimal knowledge [16, 36]. Di-rectness was first associated with techniques such as dynamic queries [16] that provide widgets to explore the data interactively – as opposed to command-line interfaces. But the meaning of directness has changed and dynamic queries are now said to be indirect because the user in-teracts with intermediate, likely spatially distant widgets – as opposed to interacting directly with the representation of the data itself. Rather than (quite arbitrarily) classifying interactions as either direct or indi-rect, it is useful to consider that interactions have degrees of directness on an indirect–direct continuum [62].
3.1.4 Terms Related to Interaction
Interaction is distinct from interaction technique, interactivity, and sci-ence of interaction.Interaction techniqueis less broad [104] and more tangible [126] than interaction, and refers to the user means with which interaction can occur [92] (in terms of hardware and software [62]). Un-like interaction, an interaction technique does not necessarily embed the notion of intent [92]. Whereas interaction refers to the action-reaction dialogue between a user and visualization system,interactivityrefers to the feel, properties, and quality of this interaction [76]. Yet, the terms are sometimes used interchangeably [21, 62].Science of interactionis broader than interaction [92]. It is the study of methods by which hu-mans create knowledge through interaction, and it involves developing and testing theories and practices to better support interaction [92]. All these terms internalize the notion of interaction. Thus, making them actionable requires a precise view of what interaction is.
3.2 Reported Benefits & Critiques on Interaction
39 papers reveal benefits of interaction. At first, interaction was seen as a necessity to handle increasing amounts of data [32, 38, 64, 106, 126]. But interaction has moved beyond its necessity. It is now seen as a mean toamplify cognitionin active, human-driven data exploration [37, 47, 54, 68, 70, 79, 95, 104, 125, 126] in which the user is incontrol
of the information space [36, 100, 106]. It is via interactive manipula-tion that“knowledge is constructed, tested, refined and shared”[92]. Further, interaction leverages humans’ natural abilities through new visualization shapes, modalities, and input technologies [36, 62, 74, 77], helping to make visualizations accessible to broader audiences [74].
Despite these benefits, the 36 critical papers highlight frustrations around the topic of interaction. The most frequent one is that in compar-ison to representation, interaction is rarely the focus of research efforts in visualization [2, 21, 36, 38, 72, 74, 99, 126]. When interaction is the focus of research, the angle is often more on engineering or implemen-tation than on designing for interaction [36, 99] and facilitating user analytic activities [2]. A key concern is the limited consideration for human (e.g., gaze, speech, haptics, sound, full-body) and technology modalities (e.g., pen, sketch, multi-touch surfaces), compared to the classic desktop-mouse-keyboard setups [36, 54, 65, 66, 74]. Beyond modalities, visualization systems are oftennot flexiblewhen users want to express complex data queries [16, 54, 66, 120], integrate annota-tions [39, 54], input new data [21], bookmark and extract insights [39], iterate over their activity history [39, 84], organize freely elements of the layout [54], choose their own statistical [37, 54] and visualization models [54, 79, 100, 102], and collaborate in real-time [39, 54].
This lack of flexibility stems from several factors, including tech-nical challenges [90, 102], costs [72] and the lack of theoretical foun-dations that bridge external representations with internal cognitive processes [47, 79, 104]. Two other factors are seemingly conflicting. On one hand, there is the failure of visualization systems to infer user goals. This is attributed to a strong focus from the community on data, tasks [14, 72] and domains [104] rather than on human goals; and to a difficulty to infer user goals via activity logs [51, 76, 84]. On the other hand, there is an overfocus on operationalizing user goals. As a result the visualization community ignores other objectives that broaden the interaction palette, such as engagement, playfulness and gamification [36, 39, 74], which reflect softer, or even lack of, user goal.
3.3 How Visualization Conceptualizes Interaction
We identified the need for more flexible interactions with respect to the outside world (e.g., environment, social aspect, modalities) and to the tool itself (e.g., user input, fluid interface permutation). We also identified the need to resolve the ambiguity between intent and lack of flexibility. Next, we review papers with a concept or a list tag to learn (i) how they conceptualize humanintent, and (ii) how a visualization system can account for such intent to offerflexibilityto the user.
3.3.1 System, Task or Human?
The concept and list papers reveal three approaches to conceptualize interaction for visualization: system-, task-, and human-centric.
System-centricapproaches describe interaction in terms of
opera-tors [20–22, 28, 120]. These operaopera-tors have been adapted to specific domains such as temporal visualizations [28] and visualizations of 2D data [99], and have been organized in a network [20] and in a hierar-chy [22]. Focusing on system operations, system-centric approaches do not clarify neither the role of the user nor how the user interacts.
Task-centricapproaches describe interaction in terms of low level
tasks (also primitives or components) [2, 99, 103]. Such low-level tasks have been put in relation with data types [106], means, target, cardinality, (temporal) order, and user roles (developers, authors, end users) [103]. It has been argued that high-level visualization tasks build on low-level interactions [66], but the relations and boundaries between low, intermediate, and high-level interactions are ill-specified [14, 112].
Human-centricapproaches describe interaction in terms of user
in-tent [32,39,47,99,126] rather than low-level mechanisms for supporting these intents. High-level cognitive activities introduce interactions such
asnotes(external source of data and external knowledge) andhistory
that relate to insight actions [45], meta actions [45], and provenance actions [54], as opposed to exploration actions. Most human-centric ap-proaches assume a high-level user intent in a data analysis context, such as making profitable investments with stock market data [45] or address-ing the low productivity of a virtual factory network [97]). However, a few human-centric approaches expand the scope of user intent [79] by considering factors of interaction beyond data, system and tasks. Such factors include the environment (e.g., academic, museum), the context, the technology, the domain, the audience (e.g., web, analyst, casual), the task (e.g., exploration, immersion), and the properties of interaction (e.g., direct, embodied, aesthetic, rewarding) [36, 112]. Considering these factors builds higher-level views of interaction, that relate for example to mental models [79] and epistemic actions that take place during sense making, problem solving and decision making [104].
The broader the approach in terms of user intent, the less clear it is how a visualization system can operationalize the flexibility that is needed to accommodate this wider spectrum of user intents.
3.3.2 Interaction & Visualization Pipeline
One of the most prominent concepts that describes a visualization sys-tem as a whole, from user’s high level goal to low level data operations, is the visualization reference model, or visualization pipeline[16]. However, only 12/59 papers discuss the role of interaction in it. Most of those papers [16,20,21,25,28,62,98] stress that interaction can affect all levels of the pipeline i.e., transformations of raw data, processed data, visual mappings and view. A few papers organize transforma-tions [100] or interaction techniques [123] according to the level of the
pipeline they affect. Others focus on specific interaction techniques, such as focus+context [70], selection [68] and distortion [68]; and some discuss high-level categories of interactions [65].
Attempts to describe interaction relative to the pipeline remain vague. Such statements explain that the closer an operator is to the view in the pipeline, the higher the possible amount of interaction [21]; that creating visualizations involves considering the visualization pipeline, characteristics of the data, and tasks to be performed [25]; or that the user can be an active participant controlling the pipeline at the different levels [112]. In fact, there is poor consistency between the user intent and the level of the pipeline the interaction occurs at (i.e. an intent per-ceived at a given level in the pipeline might technically affect another level) [62]. For example, techniques like filtering and dynamic queries have been classified as interactions occurring at the data level [123], al-though the user would be interacting with components (e.g., widgets) at the view level. The operator interaction framework [20, 21] further sug-gests that filtering can be an interaction at the view level (not affecting the underlying dataset) but also at the data level (affecting the underly-ing dataset). Also, as most of these frameworks [20–22, 62, 102, 120] are system-centric, they do not include user intent. In sum, the pipeline lacks the flexibility necessary to describing which interactions are avail-able to a user, and does not clarify its connection to user intent.
3.4 Summary of the Visualization View
We found that in the field of visualization, interaction is conceptualized
as adialoguebetween a human user and the visualization system over
a central object of interest: the data. But this dialogue has both low external flexibility (with respect to e.g., environment and modalities) and low internal flexibility (with respect to e.g., how modifiable visual-ization tools are). This dialogue also often limits user intentionality to data-analysis goals; and concepts advocating for a broader spectrum of user intentionality lack applicability. Making this dialogue successful demands systems flexible enough to accommodate broader user intents. However, compared to the extensive research on visual perception, cognition, and semiotics that informs the design of effective visual rep-resentations, our community knows little about interaction design [99]. There is no agreement on even the basic terms being used to describe interaction. For example, a “task” refers interchangeably to a low-level task and a high-level goal. Or, the “means” of interaction refer in-terchangeably to the process carried out to achieve a task, or to the technical implementation that supports the task. Moreover, concepts and taxonomies of interaction essentially focus on data analysis objec-tives – thus overlook a larger scope of interactions. For example, few taxonomies (e.g. [14, 54]) capture the interactions involved in authoring visualization, in creating data-driven narratives, or in inserting missing knowledge and external context. Most concepts and taxonomies still assume a setup with a single user (analyst) equipped with a mouse and keyboard and sitting in front of a computer. Most importantly, they do not help estimate the flexibility of visualization systems.
To address these limitations, we look next at the related field of HCI, in which interaction has its roots [36, 98, 99, 126]. HCI considers interaction (the focus of user experience design) as a distinct concept from an interface (user interface design) [6, 98, 99] to the extent that
“humans use interfaces, but they experience interaction”[98].
4 THEHCI VIEW OFINTERACTION
A recent paper,What Is Interaction?[56] (that we call “the HCI re-view”), tries to answer a similar question to ours, for HCI. There is a need to establish what interaction is in visualization for the same reasons it is needed in HCI: the lack of definition of interaction hin-ders the development of a theory of interaction, which in turn results in folk notions, confusion, disagreements, and opinionated views on what interaction is, is not, or should be. We first summarize the HCI review. Then, we discuss how the view of interaction in HCI applies to visualization, before highlighting the differences between both fields.
4.1 Seven Concepts that Characterize Interaction in HCI
The HCI review [56] extracts seven concepts of interaction. We summa-rize these concepts and specify how each formulates good interaction.
DIALOGUE: This concept is likely the most prominent from the early history of HCI. It sees interaction as a cycle of communication acts. Interaction is channeled through input and output from a computer perspective, and through perception and action from a user perspective. Based on Norman’s action theory [85], users formulate a goal, then execute the actions needed to move that goal forward, perceive the output system state and relate that to their goal. Good interaction maximizes directness, simplicity and “naturalness” of the dialogue, while also providing “a strong sense of understanding and control” [56].
TRANSMISSION: This concept sees interaction as a transmission of information between the computer and the user. Based on information theory [40], the transmission rate is the amount of error-free information per time unit that is transferred over a communication channel in the presence of noise. Good interaction maximizes the transmission rate.
CONTROL: This concept sees interaction as an interactive minimization of error with respect to some user target. Based on control theory [60], interaction is continuous and defined via a system that consists of goals, inputs, outputs, feedback, feedforward and states. The user performs goal-driven actions, with feedback on the system state and feedfoward on its prospect state. Good interaction minimizes error and distance to user goal, and provides rapid and stable convergence to the target state.
TOOL USE: This concept sees interaction as a series of tools that let a user interact with a computer. Tools are extensions of self like a hammer is a tool that one can manipulate to build. Based on activity theory [10] and the instrumental interaction model [5], a tool is a mediator between the user and an object of interest. Good interaction maximizes the usefulness or utility of such tool and amplifies user capabilities.
OPTIMAL BEHAVIOR: This concept sees interaction as an adaptive behavior under user capabilities, task, interface and environment con-straints. It is based on the rationality paradigm [108] and adaptation theories such as information foraging [93] that state that humans tend to approximate optimal adaptation of their motor, perceptual and cogni-tive processes. Good interaction maximizes utility to the best of user capabilities within given constraints. Utility though does not equal effi-ciency. Sometimes wasting time is considered optimal, as“behavior that appears lazy or ignorant can be optimal for the organism to the
extent it prefers saving effort over maximizing performance”[56].
EMBODIMENT: This concept sees interaction as the act of being and participating in the world, in which the users feel that the technology is an extension (or part) of them. Based on ecological psychology [34], embodiment focuses on the lived experience in which user’s intention and actions are coupled with contexts (e.g., sitting on a chair, being tired). This differs from motor analysis, and with cognitive psychology (focusing on mental processing). Good interaction leverages artifacts that do not disrupt user pursuits and assist the user “in the wild”.
EXPERIENCE: This concept sees interaction as a phenomenon shaped by user expectations, momentary reactions and recall. Based on user experience research [52], it places human experience as a key factor in how interaction unfolds, by leveraging aesthetics, emotion, fulfillment, surprise, stimulation, etc. The objective is non-utilitarian: it focuses on pleasure and meaning rather than performance and efficiency. Good interaction maximizes satisfaction of the user’s psychological needs.
4.2 Extending the View of Interaction in Visualization
Through the Lens of HCI
We now discuss how the HCI concepts can extend the view of interac-tion in visualizainterac-tion we described in Sect. 3.
4.2.1 Extending the Scope of User Intent
Both HCI and visualization assume a teleological determination, i.e.
that“human intentions postulate a norm or goal of interaction”[56].
The transmission concept assumes that the user has a message in mind, the tool a task to be accomplished, the optimal behavior defines inten-tion as utility, the experience as a need to satisfy, and the other concepts include an explicit user goal. But user intent is not a requirement in HCI, that often aims for non-disruptive [34] or general-purpose tools that the user can appropriate depending on the task [5]. So while a good
design should revealhow to usethe tool (e.g., using affordances [87]), it should not imposewhat to dowith it. Tools that support unforeseen user intents actually indicate successful interaction design [31].
Visualization includes user intent more explicitly, even within high-level concepts (Sect. 3.1.1). Insight, or generation of new knowledge, is often said to be the ultimate goal of visualization [25, 65]. While this might be true in a data analysis context, interaction with a visualization can have many goals. The goal might be to engage in your local community [9], to feel emotions through a representation of self [11], to reminisce about personal memories [111], to relate to ‘humanized’ data [33], or to experience a data-driven video [49]. In professional setups also, a decision maker might have some unanticipated goals such as to unruly remove visual information [29]. So, while an intent-driven perspective is more human-centric than a data- or task-driven one [14], extracting intent is not always feasible. We argue that interaction for visualization will benefit from expanding the scope of user intent and embracing intent-agnostic concepts [36]. As Dix summarized interaction design for appropriation,“You may not be able to design
for the unexpected, but you can design to allow the unexpected”[31].
4.2.2 Extending the Scope of User Profiling
The user is a mandatory entity for interaction in both HCI and visu-alization. For HCI though, the spectrum ofwhois this user is broad; mainly anyhuman being. That is because user profiling is a full stage of interaction design, with a variety of methods such as personas anal-ysis [81], where designers construct various hypothetical archetypes narrating concrete details on each user’s mental model, environment, skills, frustrations, attitudes, etc [42]. To foster designs that are easy to use while supporting complex needs, it is common that a novice and an expert persona co-exist [42]. In fact, HCI designs often promote a transition from novice to expert usage within the same tool [23], for example by revealing progressively interface complexity [107] or by providing visual guidance [71]. In contrast, the common approach to designing interactive systems in visualization is the design study [83], that establishes user profiles from the very beginning. Narrowing user profiles allows for a thorough characterization of a domain-specific problem and of the tasks to be supported. However, design studies tend to not consider user profiles from an interaction perspective (e.g., technology expertise, device, psychological state, environment, etc..).
In contrast to HCI, the visualization research is more explicit about who the user is. According to Keefe [65], research on interaction in vi-sualization differs from HCI in that it concerns“complex analysis tasks
defined by a specific, highly motivated user population”, particularly
“scientists (or other domain experts)”. This difference becomes less
true with the emergence of casual [96] and personal [57] visualization research, as well as visualization democratization movements [59, 116]. Yet, our review reveals that the profile ofnoviceuser is overlooked, as most papers refer to analysts and formal data analysis objectives when conceptualizing interaction. Visualization research also distinguishes designers and end-users when referring to data operations [22]. How-ever, we saw in Sect. 3.3 that the roles of designers and end-users on the pipeline are ill-specified. The line between designer and end-user blurs even more with approaches that reduce the burden for programmatic generation of interactions [59, 100, 102], placing custom visualizations in the hands of broader audiences [54].
Overall, dichotomies of users (i.e. analyst vs. non-analyst, expert vs. novice) likely contribute to shaping research sub-domains that are poorly connected to each other – in other words, contributes to poor external validity [12]. We argue that user profiles need not be binary, asvisualization literacyis an often misunderstood metric [26, 27]. Also, many user profiles exist along the spectrum of expertise. Some analysts might experience novice needs such as a period of familiarization and sporadic usage of a tool; while “novices” may deal with complex tasks such as choosing a profitable real-estate investment among multiple trade-offs. We advocate for visualization research to adopt HCI methods to identify broader spectra of user profiles – even for a single tool – at the forefront of the design process.
4.2.3 Extending the Scope of what Good Interaction is
The most pronounced view of interaction both in visualization and in HCI is that of adialogue, where human and computer communicate via action-reaction pairs. HCI further stresses that such dialogue should feel natural (e.g., using effective mapping [86] and quality feedback [94]) and be as direct and simple as possible (e.g., by comparing systems on interaction complexity using GOMS [18] or stochastic [3] models).
HCI concepts emphasize other desirable properties of interaction that can apply to visualization. Thebehaviorconcept suggests that visualization research could consider bounded rationality [44] contexts, in addition to strict normative rationality [30]. In some contexts, vi-sualization users face massive cognitive overload under stress – for example decision makers that need to react real-time to tasks such as planning evacuation routes [113]. In such context, good interaction might equal simple interaction over minimum information, even at the cost of missing better alternatives [113]. Minimum information relates to thetransmissionconcept, that is already considered when designing data representations (e.g., Tufte’s data-ink-ratio [114]). This concept can also be applied to designing interaction. For example, the BIGNav technique for map navigation over uncertainty reduces user steps by progressively acquiring knowledge of the user’s intent [78], instead of requiring the user to execute navigation commands.
Several HCI concepts are further overlooked in visualization, in-cludinguser experience[36] andembodiment[74]. These relate to the notion ofubiquitousinteraction, promoting interaction that supports multiple contexts (e.g., the field, the office, the home) while remaining consistent across them – as opposed to context-dependent interactions designed for point solutions [92, 109]. To design for such environments, visualization can embrace concepts such asembedded data
representa-tionsthat integrate visual or even physical representations of data with
the physical world [121], and design principles such as polymorphism for carrying interactive tools across different visualization systems [7].
5 DEFININGINTERACTION FORVISUALIZATION
Although we saw that HCI can extend the view of interaction in visu-alization, determining the fundamental differences between the two fields is a longstanding challenge [35]. By comparing the visualization (Sect. 3) and the HCI (Sect. 4) views of interaction, we articulate these differences and propose a definition of interaction for visualization to encourage novel and more flexible interaction design practices.
5.1 Key Differences in Interaction Between VIS and HCI
We identify key differences between visualization and HCI that are related to entities, focus, intent and flexibility of interaction:
ENTITIES AT PLAY: According to the HCI review,“The folk notion behind such uses [interaction] seems to be that of two entities (computer,
human) engaged in an interplay of sorts.”[56]. In visualization, this
folk notion differs in that it must include a data entity. The entities engaged in an interplay of sorts would then be (data, computer, human), with the computer being a mediator between human and data.
PERFORMANCE FOCUS: Most HCI concepts aim for tools that are easy and intuitive to use with the objective to minimize effort, while maximizing performance. In contrast, visualization aims further at facilitating knowledge construction and sense-making [76]. Instead of minimizing effort, visualizations aim to engage users into thinking and reflecting on the data being explored [76]. Therefore, in contrast to the
embodimentconcept, constructing a mental model of a visualization
can be essential [79]. Good interaction in that case may equal effort and seemingly slow interaction to get a deep understanding of the data.
NATURE OF INTENT: We saw in Sect. 4.2.1 that the intent of users interacting with visualization can be softer than those related to formal data analysis – such as being related to emotions when interacting with artistic artifacts and engagement while interacting with a data-driven story. Yet even this broader notion of intent differs from intent related to general-purpose HCI tool in that it is related todata. While HCI systems might contain data, visualization by definition is a data interface that exposes a human to an intangible data source. Therefore, intent in visualization can be refined as being adata-related intent.
INTENT INTEGRATION: The HCI review indicates that in HCI it is often assumed that users form their goals and intentions outside of the interaction cycle. For example, a person might have the goal to order food online, and HCI concepts will help make the interaction with a computer better to make this goal of ordering food efficient, satisfying, or a unique experience. The HCI review calls it a blind spot in HCI research:“while all concepts subscribe to teleological reasoning, most
say little about how intentions are formed or affected by interaction”.
In visualization, this is clearly not the case. Data exploration is studied as an iterative process that takes many steps, during which goals and intentions evolve based on views that are updated through interaction.
FLEXIBILITY WITHIN-THE-TOOL: We saw in Sect. 4.2.3 that the HCI concepts can expand the flexibility of a tool within the outside world (e.g., not to disrupt other activities with theembodimentconcept) as well as within our internal world (i.e. to satisfy psychological needs with theexperienceconcept). Visualization differs in that it requires flexibility within the tool itself. Interacting with a visualization often results in changing tasks on the fly, to iteratively build an understanding of the data through a series of smaller data questions. So while with HCI the user would mostly interact at the view level of the visualization pipeline, with visualization they might need to interact with all levels of the pipeline. This means that the user likely benefits from having access to a large variety of means of interacting with the visualization. To summarize, by comparing the visualization and HCI literature we extend the view of interaction in visualization in terms of: scope of user intentionality, user profiling, and our notion of what good interaction means – especially with respect to the external world. Yet some questions cannot be answered by the HCI literature, mainly because HCI lacks an explicit tie to thedatacomponent. Specifically, it is unclear how to conceptualize interaction when (i) there is a
data-relateduser intent and (ii) there is a need for interactionflexibility
within-the-toolwith respect to that intent. We address the first point
about data-related intent next, through our definition of interaction. We will clarify the second point about flexibility within-the-tool in Sect. 6.
5.2 What is Interaction for Visualization?
Our definition of interaction for visualization is based on two assump-tions: i) interactions with visualizations are a subset of the interactions with interactive systems – thus we do not capture all interactions cap-tured by the HCI concepts; and ii) interactions with interactive systems are a subset of interactions with people’s own mind and environment – thus our definition does not capture all interactions people might per-form while exposed to interactive systems. By comparing findings from the visualization (Sect. 3) and the HCI (Sect. 4) literature, we synthesize the followingcompactdefinition of interaction for visualization:
Interaction for visualization is the interplay between a person and a data interface involving a data-related intent, at least one action from the person and an interface reaction that is perceived as such. This definition consists of the following mandatory interaction compo-nents (i.e. describing interaction requires all of these compocompo-nents):
INTERPLAY: We frame the definition via a dialogue metaphor as it is the common schema we observed in both visualization and HCI. The word “dialogue” itself though is an overloaded term in HCI, which might be associated with interfaces that work sequentially, like human-to-human communication. Therefore we use its synonym wordinterplay.
PERSON: We replace the commonly reported entity of human “user” with the termperson, that is more likely to be perceived as gender-neutral [13]. Although we assume that the person is a human being, the term does not exclude non-human entities [110]. Thus we do not exclude mixed initiatives [53] nor humans becoming “data interfaces”.
DATA INTERFACE: A key concern in visualization was the limited use of human and technology modalities. To broaden the modality scope, we call the visualization system entitydata interface. This al-lows for a technology-agnostic perspective including non-computerized visualization such as physicalizations, infographics and bio-inspired visualizations [89]. We do not specify the modality (e.g, “visual”) as
many modalities might apply [91], such as sonification and tactilization (described by Card et al. as “perceptualization” [16]). The data inter-face is asystemcontaining a set of controls that are perceivable by the person, and linked to a data entity. The data interface can contain other entities (e.g., a computer). The data entity itself is an abstracted intan-gible source that, like other abstracted notions such as “knowledge”, cannot physically constitute an actor in a two-way communication. Technically, the person interacts with the data interface (not the data entity), as the data interface is the one capable of providing a response.
ACTION: We adopt the termactionperformed by thepersonwithout constraining its granularity (e.g., it can be a low or a high level action). We include any action, physical or mental, and regardless of modality, that causes the reaction of the data interface.
ACTION-REACTION: Visualization and HCI agree that the interaction dialogue requires that the interfacerespondsto a person’s action. While such action-reaction does not limit to a specific modality, (e.g. touch, or thought), it is a cause-effect relationship. Consider two people A and B separated by a wall. If A speaks and B does not respond verbally, this is not a dialogue. Now, A and B are in the same room, B still does not respond verbally but A sees B smile. There was a response to the action, regardless of the modality being used (voice or facial expression).
REACTION PERCEIVED AS SUCH: Visualization and HCI agree that the interaction dialogue requires that the personperceivesthe reaction of the data interface. If A and B are separated by a wall and B responds too quietly to be heard by A, then the reaction is not perceived. If B responds loudly but in an incomprehensible way, the reaction is per-ceived, although the dialogue is a bad one. We saw that the perception of the reaction is constrained by a time entity. Time expectations can differ depending on the context [16]. For example, a system that re-quires a long time to compute a statistical model can provide a timely reaction even if it is not immediate. Therefore, we refrain from using the common descriptors of “rapid” or “immediate” reaction. Timeliness is only one factor to the person perceiving the reaction as a response to their action. In a broader sense, for a dialogue to occur the person must perceive the causality of their action (i.e., self-agency [62]). To capture causality, we specify that the reaction must be perceivedas such.
DATA-RELATED INTENT: Visualization and HCI agree that interaction involves a teleological determination (i.e. a norm or goal of interaction). What differs is that the visualization intent (Sect. 5.1) is tied to a data source and is formed iteratively within the interaction cycle. We use the
termdata-related intentto stress this difference. We do not use a term
such as “data-oriented intent” to not enforce interaction as a goal-driven activity but includeimplicit interaction[61] and coarsely approximated intent [74]. We also do not enforce the temporality of the intent (i.e., it can be formed in advance of the interaction or not). We also do not enforce who the beholder of the data-related intent is. Although the beholder is usually the person, this leaves open the possibility that the beholder of the intent be the designer of the data interface.
To further highlight the boundaries of our definition, we now answer the question “Is this an interaction for visualization?” for six scenarios.
SCENARIO1: Joe is staring at a visualization without performing any action that is interpretable by the visualization. He is reasoning (men-tally) about the visualized data. There are further (computer initiated) animations, real time changes that show important information that Joe takes into account in his reasoning process.
Answer: No. While there were severalactionsfrom the person, the visualization did not return anyreactionas a response to those actions.
SCENARIO2: Joe wants to focus on a cluster of data points. Using a mouse, he traces a lasso to select the data points. The visualization draws the lasso with the exact same color as the background. Answer: No. While there was an action-reaction, the reaction of the systemwas not perceivedby the person.
SCENARIO3: Joe notices a slider widget. He intends to filter out some data points. He moves the slider and the visualization is zoomed-in. He does not understand what is going on.
Answer: Yes. Because the reaction of the visualization (although not understood)was perceivedby the person.
SCENARIO4: An airport provides a visualization that updates automat-ically to show all departure gate data. Jack looks for his gate number, but the visualization changes too quickly. A gaze detector tracks Jack’s unfocused gaze attempts and slows down the rate at which the visual-ization changes. Jack now locates his gate number.
Answer: Yes. There was anaction-reaction perceivedby the person. Such gazing action was not interpretable by the interface in scenario 1.
SCENARIO5: Averell cannot remember where he parked his car. In the parking a screen shows car CO2 emission data to motivate car drivers to use their car less. Averell is not careful and he bumps his head on the screen. Because the screen is touch-enabled, this contact rearranges the data points. Averell sees some graphics moving around but does not pay attention. He ignores the screen and continues his search. Answer: No. While there was an action-reaction perceived by the person, there was nodata-related intent(unless the designer, having such intent, had caused Averell to non-consciously process some data).
SCENARIO6: Like Averell, William bumps his head on the display. But when he sees the graphics move around he gets curious and starts touching the display to explore what these graphic things are about. Answer: Yes. Although the interaction was not initiated by an explicit intent, there was an implicitdata-related intentinvolved in the process.
6 FLEXIBLEDATAINTERFACES
Definitions are essential to establish foundational knowledge in any applied domain. But it is also critical to make definitions actionable through applicable concepts. Our definition provides several dimen-sions that the visualization community can investigate to enrich interac-tivity in data interfaces (e.g., action, reaction, perception, intent). In this section, we provide one example of making the definition actionable by focusing on how to enrich theactionsin data interfaces.
Our review of visualization research stressed the need for more flexible interfaces in visualization (Sect. 3); while we also saw that the HCI concepts do not promote flexibility-within-the-tool – which is essential for visualization (Sect. 5.1). Here we discuss how the notion of allowable actions offered by a data interface can be used to enrich its flexibility. We first propose a classification of possible actions that we then use to operationalize the flexibility of a data interface. Then we present examples of how the concept of flexibility can help to practically describe and compare data interfaces.
6.1 Classifying Actions
Among the different levels of granularity of actions [14, 62, 103], we focus on intermediate-level actions [62] because: i) they have a data-related meaning thus can support complex cognitive activities, in con-trast to low-level interactions such as mouse clicks; and ii) they are operationalizable, in contrast to high-level interactions [104].
Such data-level actions are commonly described using the visual-ization pipeline schema [62]. However, Sect. 3.3 revealed that i) the pipeline makes it difficult to describe interaction from a system-centric perspective (e.g., propagation phenomena [62]); and that ii) its re-lation to the person’s intent is ambiguous (e.g., conflicted operation stages [21]). To avoid such problems, we adopt a human-centric inter-pretation of the pipeline. We replace the system-centric interinter-pretation with a semantic one from a person’s perspective. Particularly, our cate-gorization is based on which are the person’sallowedactions within the data interface to achieve their intents. By merging this semantic interpretation of the pipeline with related taxonomies [45, 54, 62], we consider three categories ofallowableactions within a data interface:
data actions,perceptualization data actions, andnon-data actions.
DATA ACTIONSoperate on the intangible data entity (“data change” [45]). They can beinput data actionsorprocessing data actions. • Input data actionsoperate on raw data values. Examples include:
edit, update, modify and correct data [62]; or add, create, insert and import data or meta data. These actions can be basic, e.g., importing a dataset in the system [21], sophisticated, e.g., inputting data or external knowledge [4, 118] through creating data-aware annotations [54]), and can be disregarded, e.g., collecting data [62].
• Processing data actionsapply functions/transformations to the in-put/raw data. Examples include: compile, filter, select subset, and query data [54]. These actions can be used to transform data“into
a form that is suitable for visualization”[62], to derive from the
raw data (e.g., normalized values, statistical summaries and aggre-gates [54]), and to change a statistical model or its parameters [37].
PERCEPTUALIZATION DATA ACTIONSoperate on the perceptual for-matting of the data entity (“visual change” [45]). They can bemapping
data actionsorpresentation data actions.
• Mapping data actionsassign data entities to perceptual marks and variables [62], and layout/rearrange the data. These actions constitute the abstract presentation form of the representation [62].
• Presentation data actionsoperate on the specific presentation of the data [62]. Examples include: mark something as interesting, navigate (e.g., pan and zoom) [45]), stylize, highlight, and decorate [62].
NON-DATA ACTIONSdo not operate explicitly on the data nor on the data presentation [45], but on interaction entities not captured by the pipeline model. They can bemeta,socialorinterfaceactions. • Meta actionsoperate on the person’s own actions [45]. Examples
include: undo, redo, record activity, log, and change history [45]. • Social actionsconnect the person to other persons. Examples
in-clude: communicate and discuss with peers, share results, and coor-dinate the data analysis work of multiple groups [54].
• Interface actionsoperate on other data interface components. Ex-amples include: take notes that are not bound to data items (e.g., document observations/questions/hypotheses/reflections/goals [54]), manage knowledge [45], externalize thoughts [117], and organize, open, close, maximize, and layout/rearrange the interface [54].
6.2 Operationalizing Flexibility
Several properties of allowable actions (e.g., complementarity, fitness, genre, diversity, and flexibility [105]) can describe the quality of interac-tion within a data interface. Here we focus on diversity and flexibility. As diversity, we consider the giveninteraction means: the set of distinct controls that the data interface provides to the person for per-forming actions. Interaction means range from basic to complex, thus we do not use the term “interaction technique” that is often associated to elaborated means. An action isallowableonly if the data interface provides at least one interaction means for that action. There can be more than one interaction means per action (e.g., sort data points by: clicking on a button, speaking a voice command, or rearranging data points manually). An interaction means can be characterized according to itscardinality,human modality, andtechnology modality.
As flexibility, we consider concept that is broader than diversity and that builds on our data-oriented interpretation of Gibson’s concept of affordance [43] (it differs from the affordance we saw in Sect. 4.2.1 by Norman [87]). In Gibson’s terms,“affordance is what the environment
offers the individual” [43]. The set of affordances depends on the
object (the data interface) and the person (i.e., a chair affords sitting for an adult, but not for a baby). By offering more interaction means, a flexible data interface can bolster diversity of affordances, which in turn can help design for inter-individual differences and accessibility. We conflate our classification of allowable data-level actions (whatthe person can do with the data) with the concept of interaction means (how
the person can perform these actions) to define flexibility as follows: Flexibility within a data interface is the number of distinct, allow-able actions of a person on the interface, as well as the number of interaction means with which the person can perform each action. This operationalization of flexibility makes it possible to describe and compare data interfaces. The purpose is not to plainly count features, but to provide a simple and actionable way of describing interactive visualization systems. Indeed more interactions does not mean better interface, as more interactions than necessary have a cost [72, 115]. Next we show through two examples how to compare the flexibility of existing tools using i) the cardinality of interaction means and ii) the cardinality of allowable actions based on their category.