A
Hybrid Algorithm for K-medoid Clustering of
Large Data Sets
Weiguo
Sheng
Department
of
Information
System
and
Computing, Brunel University,UBX
3PH London, UK
Email: [email protected]Abstract-ln this paper, we propose a novel local search heuristic and then hybridize it with a genetic algorithm for k- medoid clustering of large data sets, which is an NP-hard optimization problem The local search heuristic selects k medoids from the data set and tries to efficiently minimize the total dissimilarity within each cluster. In order to deal with the local optimality, the local search heuristic is hybridized with a genetic algorithm and then the Hybrid IC-medoid Algorithm (HKA) is proposed. Our experiments show that, compared with previous genetic algorithm based k-medoid clustering approaches
.
GCA and RAR.-GA, HKA can provide better clustering solutioos and do so more efficiently. Experiments use two gene expression data sets, which may involve large noise components.1. INTRODUCITON
Clustering is useful in exploratory data analysis. Cluster analysis organizes data by grouping individuals in a population in order to discover structure or clusters. Various types of clustering algorithms have been proposed to suit different requirements. To cluster large data sets, there is a general consensus that partitional algorithms are imperative [5]. Partitional clustering algorithms generate a single partitioning, with a specified or estimated number of clusters. in an attempt to recover natural groups present in the data. Many partitional algorithms have been proposed, some based on k-centroid, some based on k-
medoid, some based on fuzzy analysis, etc.
K-medoid clustering is similar to k-centroid clustering.
Both of them attempt to partition the data by assigning each object to a representative and then optimizing a statistical homogeneity criterion - namely, the total expected squared dissimilarity. However, k-medoid clustering only allows objects to be chosen as representatives. In comparison with k-centroid, the use of medoids for clustering has several advantages. Firstly, this method has been shown to be robust to the existence of noise or outliers (i.e., objects that are very far away from the rest of objects) and generally produces clusters of high quality Secondly, this method can he used not only on points or vectors for which the mean is defined but also on any objects for which a similarity measure between two
Xiaohui Liu
Depafiment
of
Information
System
and Computing, Brunel University,UBX
3PH London,
UK
Email: objects is given. Moreover, there are fundamentd modeling reasons to prefer medoids over centroids [ l I].K-medoid clustering of large data sets is
an
NP-hard optimization problem and genetic algorithms have been introduced to handle the problem. For example, Lucasius et al. [51 proposed the Genetic Clustering Algorithrn (GCA), which was tested on three simulated large data sets. Estivill-Castro and Murray131
recommended anothcr method called RAR,-GA. It is basedon
a crossover operator named Random Assorting Recombination (RARJ. which tries to supply desirable properties (respect and proper assortment) to the genetic search.One main problem of earlier work on applying genetic algorithm to k-medoid clustering of large data sets is that it is computationally expensive. In this paper, we propose a novel local search heuristic and then hybridize it with a genetic algorithm for k-medoid clustering. The local search heuristic selects k medoids from the data set and tries to efficiently minimize the total dissimilarity within each cluster. In order to deal with the local optimality, the local search heuristic is hybridized with a genetic algorithm and then the Hybrid K-medoid Algorithm (HKA) i s proposed. Our experiments show that. compared with GCA and RAR,-GA, HKA can provide better clustering solutions and do so more efficiently. Experiments use two gene expression data sets, which may involve large noise components since genes can show large variations under minor changes of the experimental conditions.
The outline of the paper is
as
follows. W e briefly review k-means algorithm in section 2. Sections 3 and 4provide the details of our proposed local search heuristic and its genetic algorithm hybridization - HKA. Data sets employed in this work are described in section 5 . Section
6 contains a description of how various parameters for HKA can be set. Section 7 details the experiments and compares the HKA against GCA and RAR,-GA. Lastly, section 8 presents our conclusions and future work.
11.
K-MEANS
ALGORITHMThe k-means algorithm [41 has been popularly used for clustering because of its simplicity and efficiency. It is an
iterative scheme attempting to minimize the sum of squared Euclidean distances between objects and cluster centers. Let x, (i=1,2,. ..n) be a data set X with n objects. k, the number of clusters, m,, the centroid of cluster C,
(i=I,Z,.,.k). Then the algorithm tries to minimize the cost function - Mean Square Error (MSE)
Starting from an initial distribution of cluster centers in data space, each object is assigned to the cluster with the closest center, after which each center itself is updated as the center of mass of all objects belonging to that particular cluster. The procedure is repeated until convergence. Mathematically the steps can be stated below.
Step 1.
Step 2.
Step 3.
Step 4.
Place k points into the space represented by the objects that are being clustered. These points represent initial group centroids.
Assign each object to the group that has the closest centroid under squared Euclidean distance metric.
When all objects have been assigned, recalculate the positions of k centroids m,.
Repeat steps 2 and 3 until the centroids do not change any more.
This scheme is known to converge sufficiently fast. However it's not designed for the k-medoid problem, in which only objects are allowed to he chosen as representatives.
111. T H E LOCAL SEARCH HEURISTIC
Our local search heuristic is based on k-medoid. Replacing the centroids with the medoids and considering the Euclidean distance in equation (I), we obtain the following cost function
-
Sum of Euclidean Distance (SED), where m, represents the medoid of cluster C,(j=l,Z,..
.k).Compared with the popularly used squared Euclidean distance. the consideration of Euclidean distance is mathematically more difficult, however, it is statistically more robust 171. Outliers or noise, which by nature should be regarded with less weight than other objects, are given far much more weight than other objects if the squared value is utilized.
Strictly speaking, an exhaustive search over the data set X is required to solve equation (2). However, following
the efficient k-means algorithm, we describe the local search heuristic below to identify the k medoids.
Step 1. Fix the number of clusters k and the number of the nearest neighborsp.
Step2. Randomly select k medoids (without replacement) from the data set
X.
These objects represent initial k medoids.Assign each object in X to the cluster Cj with the closest medoid under Euclidean distance metric. Update k medoids. For j=l to the number of clusters k do
a) Within the cluster Cj, choose a subset CsUaser
that corresponds to m, and its p nearest neighbors (which have no1 been evaluated before current iteration) of m,.
Step 3. Step4.
b) Calculate the new medoid
after that the old medoid mj is replaced by q
if it is different from m,.
c) Repeat steps (a) and (b) until the medoid does not change any more.
Repeat steps 3 and 4 until k medoids do not change any more.
Step5.
To minimize the function (2), our heuristic mainly consists of two loops (outer loop and inner loop). The outer loop searches for k medoids with progressively lower costs. Starting from the initialization by randomly selecting k medoids from the data set that is being clustered, the outer loop firstly assigns each object to a corresponding cluster with the closest medoid. after which the k medoids are updated by inner loop. This procedure repeats until convergence. The inner loop (a)-(c), however, searches for a medoid with progressively lower costs within the corresponding cluster. If the current medoid has already been compared with its p nearest neighbors and is still the lowest cost, the current medoid is declared to be a "local" minimum of the corresponding cluster otherwise it is replaced by the one with the lowest cost. This procedure repeats until convergence and all k medoids are updated in this way. The idea of using size p
is to get a group of objects around a medoid within the corresponding cluster and then identify an object with a lower cost as well as the direction where there may exist an object that can minimize the cost.
Unlike some other k-medoid clustering algorithms which typically have time complexity of O(nz) per iteration, our heuristic only requires O(ipn), where i is the iteration number of inner loops and p is a small number of the nearest neighbors e.g. 3 is used in our experiments. Furthermore. our heuristic is more general i n the sense that it is applicable to situations where the objects to be clustered cannot he represented by numerical features. For
example, it can be used to cluster web objects (pages, URLs), which are nonnumeric in nature.
Iv.
HYBRID &MEDOID ALGORITHM The local search k-medoid clustering heuristic works quite efficiently, however it falls in the category of alternating cluster estimation paradigm[91
and is not guaranteed to find the global minimum. The standard solution may the heuristic many times from different initialization and retain the best solution, i.e. the one with the smallest SED. Our suggestion here, however, is to hybridize the local search heuristic with a genetic algorithm which works as follows.Step 1 . Randomly initialize a population with P
individuals. Each individual uniquely encodes
a
candidate solution of the k-medoid clustering problem.Calculate SED value according to equation (2) for each individual in the initial population and set the fitness value
as
f
= IISED.Repeat (a) to (e) until the stopping criterion is met.
a) Use 2-fold tournament selection to select PI2 parent pairs for reproduction.
h) Do mix subset recombination crossover
on
parent pairs and then perform p i p mutationon each feature of the offspring with some probability.
c) Run one step of the local search heuristic on
the new offspring with some probability and update the offspring.
d) Calculate SED value according to equation (2) for each offspring member and set fitness of the member equal to IISED,
e) Create the new generation of size P from the one best member of the previous generation and the best offspring.
S t e p 4 . Provide the individual for the terminal population member with the best fitness. Step 2.
Step 3.
A. Representation
The representation consists of a vector of k features (integer numbers), which represent the index of
an
object selected as a medoid and k is the number of medoids. Cluster assignment is done implicitly based on distance of the objects to the medoids. Only valid individuals that have no duplicated index are considered to be included in the initial population.B. Crossover and Mutation
Crossover is a probabilistic process that exchanges information between two parent individuals for generating
two offspring. In order
to
avoid producing illegal individuals or producing offspring identical to the parents, we apply the mix subset recombination crossover 151, whichhas
a built-in mutation with probability of Pm,,*Given two parent individuals X, and X, with k features, mix subset recombination crossover works
as
follows: ( I ) MixX,
and X, to obtian X,, by appending one parentindividual to another and then the features of resulting Xmb are randomly scrabled.
(2) Perform flip mutation on each feature of X,,,, with a predetermined probability Pm,,, and then randomly scrable the features of X,,again.
(3) Build the offspring
X,
by coping features from X,, starting at the IeAmost feature and going featurewise to the right, subject to the condition that features already in X, are skipped.(4) Build the offspring
X,
by coping features from X,, starting at the rightmost feature and going featurewise to the left. subject to the condition that features already in X, are skipped.The crossover is applied
on
each paired parent with probability of P,.After crossover, the probability P, of flip mutation will be applied to the offspring. Flip mutation replaces the chosen feature by another randomly generated feature, subject to the restriction that the new feature is not presented in the current genotype of the individual. C. Fitness Function
The fitness calculation of an individual
is
based on the medoids formed according to the features encoded in the chromosome. It was definedas
f
= USED, in which SED is computed according equation (2),sa
that the maximization of the fitness leads to the minimization ofSED.
D. Stopping Criteria
There are several possibilities for determining when the alogirhtm should stop. Options include the fitness threshold, population convergence and fitness convergence, etc. In HKA, two different stopping criteria are used separately in our experiments. The first stopping criterion is that the fitness value of the best population member has not changed for n generations. The second
one
is
the number of generations, i.e. the evolution stops when the user-specified number of generations has been run.V.
DATASKTDESCRIPT~ONA. Serum Data
This data set is described and used in (61. It corresponds to the selection of 517 genes whose expression vary in response to serum concentration in
human fibroblasts (the data can be downloaded from: htto:llwww-iabmc.u-strasha.frloroiets/fc~seNm.txt~. There are IO clusters found by [61. Here, we expect the same number of clusters from it.
B. Subyeast Dara
The subyeast is a subset of the yeast cell cycle data set provided by [I]. The yeast cell cycle data set contains time-course expression profiles for more than 6220 genes, with 17 time points for each gene taken at 10-min intervals covering nearly two yeast cell cycles (160min). This data set is very attractive because a large number of genes contained in it are biologically characterized and have been assigned to different phases of the cell cycle. The subyeast data used in this work is from [IO]. We used the same selection of 2945 genes, which are most variable genes out of 6220. In that selection, the data for the time points 90 and 100 min are excluded because of less elticient labeling of their mRNA during the original chip hybridizations. The 2945 genes are clustered into 30
clusters using k-means in that paper. Here, we set the same number of clusters for our experiments.
Both gene data sets are normalized so that every gene has an average expression value of zero and a standard deviation equal to one. Normally, to measure the dissimilarity between two genes one tends to choose correlation coefficients which capture the similarity of the “shapes” of two expression profiles, and ignores differences between their magnitudes. However, Euclidean distance metric is used for all results reported here since it has heen’shown that the correlation coefficient and Euclidean distance are equivalent on a standardized gene expression data set [12].
VI. PARAMETERS CONFIGURATION Before running HKA, there are some parameters that need to be set including the crossover probability P,,
mutation probability P,, build-in mutation probability
P,,,,
population size, the order of tournament selection. probability of one step of local search heuristic and its number of the nearest neighbor size p.Generally, we have found that a crossover rate of 0.9- 1.0 offers best results, thus the probability (P,) is set to 0.95. The mutation rate
(P.)
and build-in mutation rate ( P m , A were set at 0.02 and 0.05 respectively. Both mutations are useful to add new features to offspring individuals and allow them to search other areas that have not explored by the algorithm.For population size setting. we found HKA performs well
on
a generally small population. However, a too small population would retard the search ability of HKA. Based on vial runs, we found a population size of 30 for serum data and 50 for subyeast data to he an acceptable lower limit, and better performance can he obtained by using a large population size.The order of tournament selection controls how quickly dominant individuals take over a population. A higher order of tournament selection leads to faster convergence to a local extremum and restricts the HKA’s space search capability. In order to alleviate the selection pressure and provide adequate search, the tournament order is set to he as low as possible, i.e. 2 .
The optimal probability of applying one step of local search heuristic and its p size have been determined based
on a number of trials. We found
a
probability of 0.2 ofapplying one step of local search heuristic withp size of 3
performs well on the two gene expression data sets.
VII. EXPERIMENTS
In this section, we compare the performance of HKA with GCA and RAR,-GA in terms of efficiency and solution quality on above two gene expression data sets. Rather than fitness value, we report the SED value for all experiments. This allows us to compare performance of the different algorithms with similar hut different fitness functions. All results reported in this section are obtained on a PC with
A M D
Athlon 1800 running Windows2000 operation system.Before comparing the performance of the three algorithms, we give a brief description of the genetic algorithm used in GCA and RAR,GA. In GCA, a genetic algorithm based on roulette selection, a mix subset recombination crossover and a flip bit mutation are used with integer coding for k-medoid clustering. In RAR,-GA. a similar genetic algorithm was used but with a crossover method called Random Assorted Recombination (RARJ, which tries to supply desirable properties (respect and proper assortment) [31 to genetic search. Given two parent individuals XI and X , with
k
features, RAR, iteratively added features into one single offspring X,. At each iteration, a random number was drawn uniformly inI0,ll. If <cur (a predefined threshold), a feature was selected randomly from (XI
n
X&X, and included intoX,. If >cut, a feature was selected randomly and uniformly from (XI U X,)-[(Xl l l X,) U Xn] and included into X,. If
(XI
r7 X,)-X, or ( X I U X&[(XI
n
X,) U X,]was empty before X o had k features, Xn was completed with random features from ( X , U X,)-X, The fitness function for both GCA and RAR,-GA is the inverse of the total distortion, however in GCA it is further modified by a linear scaling.
To make the comparison among the three algorithms more meaningful, the population size setting of GGA and RAR,-GA on the two data sets is identical to that in HKA. The rest of the parameters of GCA and RAR,,-GA are shown in table I . They are specified according to the original papers for best performance. (Note: A much smaller mutation probability is used for RAR,,-GA and HKA because it is applied on each feature of the offspring individuals. However, in GCA the mutation probability is applied on each individual of the offspring.)
Table 1. THE PARAME'ER SEl"GS OF THE THREE ALGORITHMS (GCA. RARwGA AND HKA) FOR EXPERMENTS ON TWO GENE EXPRESSION DATA SETS
~~~
Build-inmutation probability PmmY
I
AlprithmGCA
1
RARwGAI
HKA Parameter,2i
NIA oo5Algofitbm Cut value ( w )
nei hhors )
Probability of one step of local search heuristic
m
j
N,A
Two different sets of experiments are carried out using different stopping criteria. One set of experiments applies the first stopping criterion that the fitness value of the best population member has not changed for n generations. For experiments on serum data, a reasonable n value is set to be 20 for HKA and 100 for both of GCA and RAR,-CA. On subyeast data, it is set to be
IO
and50
respectively. Another set of experiments applies the second stopping criterion that the evolution stops when the user-specified number of generations has been run. In order to make the comparison among the three algorithms as fair as possible under the second stopping criterion, we have carefully determined the number of generations performed by each algorithm in such a way that all the three algorithms go through roughly the same number of solution evaluations. This is fair because the majority of processing time in the three algorithms is taken by solution evaluations. More precisely, the n u d e r of generations setting and corresponding total number of solution evaluations are listed as follows in table 2 for serum and subyeast data. (Note: The total number of solution evaluations is averaged over IO trials since each mn of HKA for the same number of generations it i s slightly different.) Table 1. THE NUMBER OF GENERAnONS SETIWG AND CORRESPONDING TOTAL NUMBER OF SOLUTION EVALUATlON FOR EXPERIMENTS USETHE SECOND
STOPPING CRITERION ON TWO GENE EXPRESSION DATA SETSSerumdata
I
Suhyeast data SEDR~~ time SED Runtime
(seconds) (seconds)
... ...
... ...
... ... .... ...
1
Solution TotalNo.of Eval. (30,0111 49,952~ , o w I
50,000 (30.0001 ~O.WOJParameter Population
Size Generations
To compare performance of the three algorithms in
terms of efficiency and solution quality, we recorded average run rime and SED value found from the experiments that use the first stopping criterion. They are
Algorithm
GCA RAR.-GA HKA
Serumbubyeas' Scrumbuhyeas Serum(Subyeas1
30
1
50 30I
50 30I
50420
I
435 loo0I
loo0 loo01
IWOobtained by generating 10 random starting populations, and running each experiment once with each of the 10
random starting populations. All the results were then averaged over the 10 trials. All experiments used the same
IO random starting populations. Table
3
lists the average values of run time and SED found by the three algorithms on serum and subyeast data.Table 3. COMPARING THE AVERAGE VALUES OF RUN TIME AND SED FOUND BY THE THREE ALGORITHMS (GCA, RARwGA AND HKA) FROM THE EXPERIMENTS THAT USE THE FIRST STOPPING CRITERION ON TWO GENE EXPRESSION DATA SETS. THE RESULTS ARE AVERAGED OVER THE 10 TRIAL5
-1
HKA 17.2 861.076 1395.6 8019.2Testing on Serum gene expression data, table
3
shows that, on average, each run of GCA and RAR,-CA needs69.5 and 66.3 seconds respectively, which takes about 4
times longer than HKA. Furthermore, on average HKA achieves better clustering solution than that of OCA and RAR,-GA. Testing on subyeast gene expression data, similar results are obtained. On average, GCA takes 5150.8 seconds and results in ove.SED=8079.4, while
RARw-GA takes 6200.3 seconds and results in
a v e . S E D 4 1 16.8. However HKA needs only 1395.6 seconds and achieves ave.SED=8019.2.
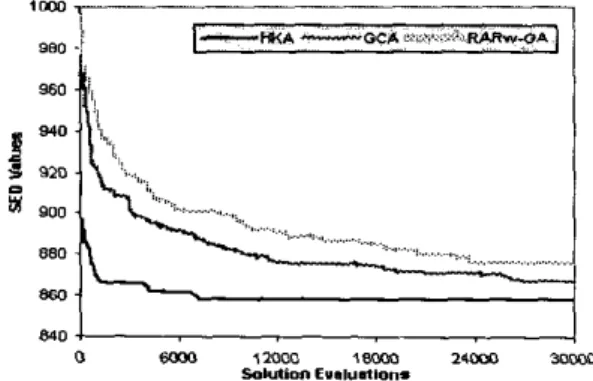
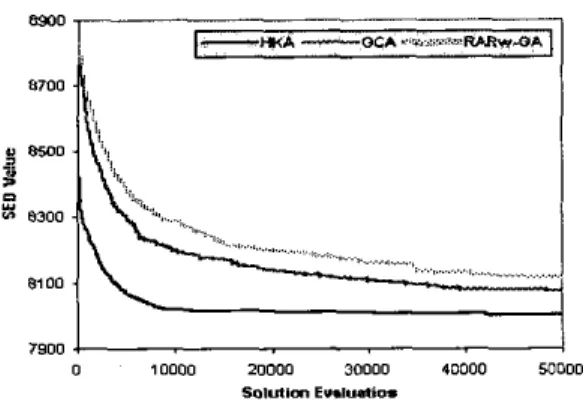
Another set of experiments is carried out using the second stopping criterion and run 10 repeated experiments over the three algorithms using random initialization. The average leaming curve for each of the three algorithms is then calculated. Figures I and 2 show the performance of the three algorithms in terms of SED value against solution evaluations.
950
880
85(1
Fig. 1. Toe average SED value found an scmm data by the three algorithms (HKA, GCA and RAR,GA) plotted against solution e"ill"ati0"S
g 8 7 0 0 f i 8500 f: 'i; D .,... .,... s... ... 8300 , _.,, ii'. .. . .:...: ..,.,, ....,... : ... ~ 8300 0 10000 20000 3" moo0 M O O O 50,UllDn E".l".tiO.
Fig. 2. The average SED value found an subyeast data by the
three algorithms (HKA, GCA and RARUGA) plotted against
solution evaluations.
As
can
be clearlyseen
from the above figures,HKA
ismuch more efficient than the other two within the first several thousands solution evaluations. For GCA and RAR,-GA, even at the end of total allocated solution evaluations, the solution obtained can only be comparable with the solution found by HKA at around 1,000 and
4,000 solution evaluations on serum and yeast data respectively.
VIII. CONCLUSIONS AND FUTURE WORK
In this paper, we considered the k-medoid clustering problem of
large
data sets. Since it isan
NP-hard optimization problem, genetic algorithms have been introduced to handle the problem. However earlier work on the applications of genetic algorithm to the k-medoid clustering is computationally expensive. In this paper, we solve the problem by proposing a novel local search heuristic and hybridize it witha
genetic algorithm. We test our proposed HKA on two gene expression data sets, which may involve large noise components. Our experiments show that, compared with previous genetic algorithm based approaches-
GCA and RAR,-GA, HKA can provide better clustering solutions and do so more efficiently.HKA presented here can he used not only for gene expression data where the mean is defined, but also on any objects for
which
a
similaritymeasure
between
two
objectsis
given.
Besides,
thepromising
results leadus
believe that HKA can be extended to a class of real world large clustering problems where other methods have not been appropriate.There are several issues for future research. For
example, an interesting area is to get better results by applying other genetic operators and studying the best way of hybridizing the local search heuristic with a genetic algorithm. A dynamic HKA which does not require specification of the number of clusters priori will also be investigated, perhaps involving a fitness function which maximizes both the homogeneity within each cluster and
the heterogeneity among clusters.
Finally
we intendto
evaluate HKA against non-GA based k-medoid clustering approaches.REFERENCES
R.J. Cho, M. Campbell, E. Winzeler, L. Steinmetz. A.
Conway, L. Wodicka, T. Wolfsberg. A. Gabrielian, D. Landsman, D. Lockhart. and R. Davis: A Genome-Wide Transcriptional Analysis of the Mitotic Cell Cycle. Molecular Cell 2(1) (1998) 65-73
D.E. Goldberg: Genetic Algorithms in Search, Optimization. and Machine Leaming. Addison-Wesley, Reading, Mass (1989)
V. Estivill-Casuo and A.T. Murray: Spatial Clustering for
Data Mining with Genetic Algorithms. Proceedings of the International ICSC Symposium on Engineering of Intelligent Systems (1998)
I.A. Hanigan, and M.A. Wong: A k-means clustering algorithm. Applied Statistics. 28 (1979) 100-110 C.B. Lucasius. A.D. Dane and G. Kat.": On k-medoid clustering of large data sets with the aid of a genetic algorithm: background. feasibility and comparison. Analytical Chimica Acta. 282 (1993) 647-669
Y R . Iyer, M.B. Eisen, D.T. Ross, G. Schuler, T. Moore, I.C.F. Lee, J.M. Trent, L.M. Staudt. I. Hudson, M.S. Boguski,
D.
h h k a r i , D. Shalon, D. Butstein, and P.O. Brown.: The Transcriptional Program in the Response of Human Fibroblasts to Serum. Science, 283 (1999) 83-87 L. Kaufman and P. J . Rousseeuw: Finding groups in data: an introduction to cluster analysis. John Wiley & Sons, NY. USA(1990)C. A. Murthy and Nirmalya Chowdhury: In search of
optimal clusters using genetic algorithms. Pattern Recognition Letters. 17 (1996) 825-832
T.A. Kunkler and J.C. Berdek: ACE: A tool for clustering and rule extraction, E E E Transactions on Fuzzy Systems, (1999) 377-393
S. Tavzoie, D. Hughes,]. M.J. Campbell, R.I. Cho. and G.M. Church: Systematic determination of genetic network architecture. Nalure Genetics. 22 (1999) 281-285 C. Watson-Candy: A note on the center of gravity in depot location. Management Science, 18 (1972) 478-481 Yeung. K.Y.: Clustering analysis of gene expression data. PhD Thesis, University of Washington (2001)
[IO]
[ I 11 [I21