Motor abundance and control structure in the golf swing
Morrison, A.a, McGrath, D.b, Wallace, E.S.a
aSport and Exercise Science Research Institute, Ulster University, UK
bSchool of Public Heath, Physiotherapy and Population Science, University College Dublin, Ireland
Abstract
Variability and control structure are under-represented areas of golf swing research. This study investigated the use of the abundant degrees of freedom in the golf swing of high and intermediate skilled golfers using uncontrolled manifold (UCM) analysis. The variance parallel to (VUCM) and orthogonal to (VOrth) the UCM with respect to the orientation and location of the clubhead were calculated. The higher skilled golfers had proportionally higher values of VUCM than lower skilled players for all measured outcome variables. Motor synergy was found in the control of the orientation of the clubhead and the combined outcome variables but not for clubhead location. Clubhead location variance zeroed-in on impact as has been previously shown, whereas clubhead orientation variance increased near impact. Both skill levels increased their control over the clubhead location leading up to impact, with more control exerted over the clubhead orientation in the early downswing. The results suggest that to achieve higher skill levels in golf may not lie simply in optimal technique, but may lie more in developing control over the abundant degrees of freedom in the body.
1. Introduction
The golf swing has received a great deal of attention in the scientific literature. Keogh and Hume (2012) found an initial 329 articles contributing to the golf biomechanics and motor control literature between 1975 and 2011. However, they suggest that studies using more advanced measures of coordination should be conducted to better understand how to improve performance. More
specifically they suggest that it has yet to be clearly identified which coordinative pattern should be allowed to vary and which should be invariant in the golf swing. Although recent reviews have attempted to clarify the structure of movement variability (Glazier, 2011; Knight, 2004; Langdown, Bridge, & Li, 2012), there still remains a gap in the literature.
Recent studies have addressed movement variability in the golf swing. At the moment of impact between club and ball, a strong relationship has been found between the variability in clubhead orientation and the variability in direction of launch of the golf ball (Betzler, Monk, Wallace, & Otto, 2014). With regards to the downswing movement, a decrease in the variability of the clubhead trajectory has been found leading up to impact using both spanning sets (Horan, Evans, & Kavanagh, 2011) and a variability volume method (Morrison, McGrath, & Wallace, 2014). Conversely, there was no corresponding decrease in the movement variability in the rest of the body (Horan et al., 2011). While this decrease in variability, or zeroing-in, on the demands of the task is consistent with research into other movements such as table tennis (Bootsma & Van Wieringen, 1990) and long jump (Lee,
Roly, & Thomson, 1982; Scott, Li, & Davids, 1997), the mechanism underpinning this phenomenon has not yet been investigated in golf.
A possible framework that could explain the observed patterns of variability are the principles of motor abundance and motor synergy. Motor abundance is based on the idea that most movements have more degrees of freedom (DOF) in the effector system than in the outcome of the skill. Although originally termed motor redundancy, a recent re-formulation of the problem suggested that the term redundancy implied that these DOF needed to be eliminated (Latash, 2000, 2012). Instead the principle of motor abundance suggests that all DOF are used in the task. The central nervous system creates families of solutions to the problem that are all equally able to solve the task (Latash, 2010). Using this principle of motor abundance, motor synergy can be defined as “a neural organization that ensures co-variation among elemental variables (along time or across repetitive attempts at a task) that stabilizes the value or time profile of the performance variable” (Latash, 2010, p. 643). The stability of the performance variables referred to by Latash (2010) is the notion that the outcome of the task tends towards being unchanging in the face of perturbations to the joint configuration.
Although synergy has been a much used yet poorly defined term, a method that has been used successfully to quantify the strength of synergy in human movement is the uncontrolled manifold (UCM) hypothesis (Scholz & Schöner, 1999; Schöner, 1995; Latash, Scholz & Schöner, 2002). The UCM hypothesis suggests that the variance in a body’s joint configuration can be partitioned into that which has an effect on the outcome of the skill (VOrth), and that which does not (VUCM). UCM analysis achieves this by finding the joint configurations that are associated with unchanging outcome,
essentially the multiple solutions to the forward kinematic model of the system. The variance that is parallel to the solution, or manifold, is said to have no effect on the outcome of the skill (VUCM), while the variance orthogonal to the manifold does have an effect (VOrth). If there is a significantly greater proportion of VUCM then the joint configuration is said to have synergy, in that the abundant DOF in the body are used to minimise the variance in the outcome of the skill (Latash et al., 2002). This method has been used to investigate pointing (Domkin, Laczko, Djupsjöbacka, Jaric, & Latash, 2005; Domkin, Laczko, Jaric, Johansson, & Latash, 2002), shooting (Scholz, Schöner, & Latash, 2000), sit-to-stand (Reisman, Scholz, & Schöner, 2002; Scholz, Reisman, & Schöner, 2001; Scholz & Schöner, 1999), finger force production (Kapur, Zatsiorsky, & Latash, 2010; Martin, Terekhov, Latash, & Zatsiorsky, 2013; Park, Sun, Zatsiorsky, & Latash, 2011; Scholz, Kang, Patterson, & Latash, 2003; Wu, Pazin, Zatsiorsky & Latash, 2012; Wu, Truglio, Zatsiorsky & Latash, 2015), throwing (Yang & Scholz, 2005) and stone knapping tasks (Rein, Bril, & Nonaka, 2013). Results of these studies have differed with respect to practice, skill level and phase of the skill. However, those studies
investigating movements more closely related to the golf swing, such as throwing and striking, have yielded some commonalities.
Yang and Scholz (2005) studied Frisbee throwing in 3-dimensions and analysed the effect of practice on joint configuration variance. Firstly, they found a decrease in the total variance of the body movement with practice. When looking at the orientation and path of the hand, they found decreases in the variance both parallel to and orthogonal to the UCM with practice. However, the variance parallel to the UCM actually increased as a proportion of the overall variance. This suggested that the proportional increase with practice was associated with greater ability to exploit the abundant DOF as well as more stability in the outcome of the skill (Yang & Scholz, 2005). They also found that the variance parallel to the UCM decreased over the course of the movement, while the variance orthogonal to the UCM did not. Therefore, the strength of the synergy was seen to decrease over the course of the movement.
In the stone knapping of experts and novices, Rein et al (2013) confirmed that experts have less overall variance in the body movement. They also found that over the course of the movement the strength of the synergy, based on the definition above, also decreased in the novice participants but not in the experts, suggesting that near impact the experts had a higher level of movement
compensation. This may well be consistent with the Yang and Scholz (2005) Frisbee study, as the participants in that study were all novices that were still learning the skill. Although Rein et al (2013) did not give details of the overall difference in the strength of synergy between groups, higher levels of synergy at the end of the skill in the expert group agrees somewhat with the higher levels with practice in the Yang and Scholz (2005) study. These apparent differences in the strength of synergy between skill levels and movement phases may help to explain the mechanism behind the zeroing-in of variability observed in the golf swing.
Consequently, the aim of this study was to investigate the control structure of the left arm in the golf swing with respect to the orientation and position of the golf club using the UCM analysis. Position and orientation of the clubhead were chosen as they have been shown to have a major influence on shot direction (Betzler et al., 2014), and they have previously been investigated using UCM analysis (Rein et al., 2013; Scholz et al., 2000). It is acknowledged that there are other outcome characteristics of the movement of the clubhead that have an effect on the shot outcome, such as club path, angle of attack and clubhead speed (Betzler et al., 2014); however, their inclusion is beyond the scope of this study. It was hypothesised that VUCM would be significantly greater than VOrth with respect to both outcome variables. Additionally, it was hypothesised that this difference will be proportionally greater in higher skilled players, and will change over the phases of the swing to indicate greater movement compensation in expert players near impact.
2. Methods 2.1. Participants
Twenty-two male volunteers participated in this study and each was assigned to one of two groups of eleven golfers representing two non-continuous skill levels based on handicap. The handicap brackets used to designate skill level were 10-18 for the intermediate skill level group (handicap 13.3 ± 2.8) and less than 4 for the high skill level group (handicap -0.2 ± 2.0).Thus the skill levels were distinctly different with no golfers in the intervening handicap range of 5-9. High skill level characteristics were (mean ± SD: age 25.9 ± 8.4 yrs; mass 80.9 ± 10.2 kg; height 1.83 ± 0.35 m) and intermediate skill level (age 40.3 ± 9.6 yrs; mass 89.0 ± 15.5 kg; height 1.79 ± 0.59 m). All participants provided written informed consent, and were free from injury at the time of testing. All procedures used in this study complied with the ethical approval granted by the university’s institutional review board.
2.2. Procedure 2.2.1. Apparatus
A 19-camera, 1000 Hz Oqus 300 system and Qualisys Track Manager (Qualisys AB, Gothenburg, Sweden) were used to collect and calculate the three-dimensional coordinate data. Thirteen dynamic and a further nine static spherical retro-reflective markers of sizes varying from 6.4 mm to 12.7 mm were used for tracking the left arm and club. A further 3 pieces of retro-reflective tape were used for
the club and ball tracking. The details of the marker locations and attachments can be found in Appendix A.
2.2.2. Equipment setup
The testing took place in the Biomechanics Research Suite at Ulster University. The cameras were attached to a 7m x 7m x 4m gantry and multiple tripods to get full coverage of the calibrated volume. Participants hit shots from a golf mat into a net situated 10m away. A fairway was projected onto the net with a target to increase the ecological validity of the setup. Any perceived lines or aids to alignment in the lab were covered up to allow the players to use their own alignment strategies.
2.2.3. Data collection
Prior to marker attachment the participants were allowed a self-directed warm up with the clubs of their choice. After the markers were attached, a static file was captured. The participants then performed movements for the functional joint centre calculations of the glenohumeral and wrist joint (Schwartz & Rozumalski, 2005), using Visual3D software (C-Motion Inc, USA). Next, the static markers were removed and the participants were given further time to familiarise themselves with hitting shots with the markers attached to them and their clubs.
Forty shots hit with their own driver were captured for each player. The purpose of this study was to analyse the control structure during the golf swing and as the players have developed this control using their own drivers it was important to maintain this player/ club association. The addition of the clubhead markers added 10 g to the mass of the club, with no negative consequences of marker attachment reported by the players in the study. This is consistent with the findings of Harper, Roberts, & Jones (2005) who found this level of equipment adjustment was not reliably detected by golfers. As the analysis assumes that each shot is independent of the other shots, participants were given no external feedback about the outcome of the shots until after completion of the entire testing session. Prior to commencing the 40 shots, the players were asked to describe the type of shot they would be hitting (e.g. fade, draw, high, low). The players were instructed to attempt to hit the same type of shot each time and were reminded of this requirement throughout the testing. This was to avoid multiple shot strategies being used and adding confounding variables to the data (see Langdown et al (2012) for “strategic shot selection” vs “movement variability”). All shots, regardless of
outcome, were recorded for analysis. A minimum delay of 45 s between shots was enforced and a 5-minute break after every 8 shots was taken. Pilot work undertaken showed that with these precautions the players were able to hit the shots without any fatigue effect, as evidenced by no reduction in their clubhead speed decreasing over the course of the testing. Participants were also given refreshments in the breaks. Players were allowed to perform their own pre-shot routines prior to each shot.
2.3. Data analysis 2.3.1. Data reduction
All data analysis was carried out in Matlab (R2014a, The Mathworks, Inc., Natick, MA, USA). The clubhead model was based on a previously validated method (Betzler, Monk, Wallace, & Otto, 2012).
Due to the curvature of modern driver club faces, the face markers were fitted to a sphere of radius 253mm, and then translated back onto the club face. Even at a capture frequency of 1000 Hz the instant when the club first makes contact with the ball was often not captured. Therefore, the last frame in which the centre of the clubhead sphere and the centre of the ball were further apart than their combined radii was taken as the final frame of the capture, and all data after this frame were trimmed.
Due to the rapid change in direction of the markers near impact (the final frame) 20 data points were added using linear extrapolation before filtering, and then removed afterward (Giakas, Baltzopoulos, & Bartlett, 1997; Vint & Hinrichs, 1996). The data were filtered using a zero-lag 4th order Butterworth filter, as has been used in other golf studies (Brown, Selbie, & Wallace, 2013; Horan & Kavanagh, 2012; Kwon, Como, Singhal, Lee, & Han, 2012; Sinclair, Currigan, Fewtrell, & Taylor, 2014; Tucker, Anderson, & Kenny, 2013). Residual analysis was used to identify the appropriate cut-off frequencies for the different segments of the body (Winter, 2009). After filtering, the start of the trial was also trimmed up to the takeaway event. This was defined as the point at which the clubhead velocity in the negative x-direction (away from the target) exceeding 0.2 m/s (Betzler, 2010).
Cubic best fit extrapolation was used to determine the time at which the distance between face and ball was closest to zero. This between-frame time was then used to extrapolate the other markers up to impact, and shift forward the remaining time series data via cubic interpolation.
2.3.2. Time normalization and events
Time normalization methods used in golf swing analyses are variable. Three methods were used in the current study: a 101-point time normalization method (N101), a shaft angle based events method (SA), and a standard swing event method.
Using traditional 101-point normalization for the full swing would be difficult to interpret. Given that the time taken on the backswing and downswing differ within and between players, the top of the backswing would occur at different percentages. With the change in direction at the top of the backswing being a possible opportunity for in-swing adaptations, comparison between players of this event is important in variability studies (Morrison et al., 2014). Therefore, the backswing and
downswing were each normalized to 101 points separately, thus allowing for comparison of these phases in the players’ swings.
A further issue to be considered when attempting to compare shots within and between individuals is that each player may achieve a very different length of swing. While it is often assumed that the shaft must be horizontal at the top of the swing (Mann & Griffin, 1999), the actual angle of the shaft to horizontal in this study varied from 72 degrees above horizontal to 33 degrees past horizontal. To time normalize the backswing or downswing would mean the same percentage of the movement
corresponding to drastically different swing positions. Therefore, an event-based method was also used, based on the angle of the shaft to the x-axis (pointing to the target) in the x-z plane. This allowed for comparison of equivalent positions in the swing, but it did discount any data past the length of the shortest swing. Therefore, the last event in the backswing for all players was 75 degrees to the horizontal, similarly for the first event in the downswing (figure 1).
Shaft angle-based events and 101-point normalization were used to display the data for qualitative analysis purposes. However, statistical analyses were only performed on established golf swing events to reduce the number of factors in the ANOVA and the associated error in the analysis. These events represented a combination of time normalized and swing position based events, and were as follows: takeaway, mid-backswing, late backswing, top of the backswing, early downswing, mid-downswing, and impact (Kwon et al., 2012).
2.3.3. Forward kinematics model
In order to perform the UCM analysis, a 3-dimensional forward kinematic model was constructed. As per figure 2, the full model comprised 5 segments: the club/hand segment, forearm segment, upper arm segment, and two segments representing the rest of the body. The hand/club segment ran from the wrist joint centre to the clubface centre. While this includes possible movement between hand and club, it was beyond the forward kinematic model to include this. This segment has been used previously by Coleman and Rankin (2005). The joint between the global coordinate system and the lower body segment comprised 2 DOF, and the subsequent joint to the upper body segment comprised 1 DOF. The joint between upper body and upper arm comprised 3DOF, the elbow joint comprised 1 DOF and the wrist joint comprised 3 DOF. The elbow joint was limited to 1 DOF in
flexion/extension; however, as per Scholz et al (2000), fixed rotations about the other 2 axes in this joint were used as the coordinate systems of the upper arm and forearm segments were not aligned. These rotations were different for each player, but fixed across trials. Consequently, the full model had 10 DOF (Appendix B).
x y z x y z x y z x y z x z y
Fig 2. Graphic representing the segment orientations of the forward kinematic model of the body and the golf club, from which the
uncontrolled manifold analysis was calculated (GCS=Global coordinate system) z y x GCS 75° 90° 105° 120° 135° 150° 165° 180° 195° 210° 225° 240°255°
Fig. 1. The angles used in the shaft angle event method for the swing. Angles are referenced to the horizontal position of the club shaft at the top of the swing. Soon after the start of the backswing the shaft will reach the 255° event, whereas 75° would be the last event in backswing, then the first event in the downswing. Impact between club and ball would occur soon after 255° in the downswing.
Three sets of outcome variables were used in the analysis: location of the clubface centre (3DOF), orientation of the clubhead (3 DOF), and a combination of both (6 DOF). The orientation of the clubhead was represented by two vectors: one pointing out of the face of the club, and one pointing from the centre to the toe of the club. Although these two vectors have 6 components combined, three of these are cancelled out in the calculations and result in 3DOF.
The full model was previously stated as having 10 DOF, but when dealing with the orientation of the clubhead as an outcome variable the location of the glenohumeral joint centre is not needed.
Therefore, the first 3 DOF are not required for the calculations, reducing the system to 7 DOF.
2.3.4. Joint angles calculations
The initial values for joint angles were calculated from a 6 DOF model in Visual3D. In order to create the forward kinematic model required for the UCM analysis, the segment lengths must be constant for each player. As the club is not permanently attached to the hand of the player, the length of this segment changed between trials. The mean length of this segment was the best approximation possible.
Having established the segment lengths, an iterative optimization algorithm was used to extract the joint angles based on these metrics. The angles were calculated for each of the 26 shaft angle based events, and at 10% intervals for the backswing and downswing.
There were inevitably errors associated with the difference between the anatomical and geometrical models. Due to the fixing of the 2 DOF in the elbow, the greatest of these errors was in this joint which had a root mean square error (RMSE) of 0.03 rad. This was still smaller than the error found previously by Scholz et al (2000) of 0.05 rad. All remaining joints had errors less than 0.02 rad.
2.3.5. Uncontrolled Manifold
The purpose of this analysis was to separate the joint variance into that which does and does not affect the outcome of the task to better understand the control structure of the golf swing. In all models presented here, there is redundancy in the skill, i.e. the number of DOF in the effector system is greater than the number of DOF in the outcome of the task. This redundancy represents the concept that there is more than one combination of joint angles that can create equivalent outcome values. The UCM analysis provides a method by which the amount of the variance that has no effect on the outcome can be partitioned from the total variance. The dimension on which this variance exists is known as a manifold, and more specifically in this case it is known as the UCM as it does not affect the outcome of the skill. While the system may have available multiple joint solutions it does not necessarily mean they are used. If the system in question uses multiple joint combinations to achieve the same solution, then the variance along this UCM will be greater than the variance orthogonal to it. Alternatively, there may be high variance in all joint angles resulting in high outcome variance, or the variance of outcome may be low due to low variance in the joint angles (Scholz et al., 2000).
The UCM analysis utilises the forward kinematic model created for the skill, in that it allows a solution to the model to be calculated. In order for the analysis to be carried out the UCM must be approximated as linear, so the variance along it can be measured. In reality this is not the case, as the solution to the forward kinematic model would certainly be non-linear. This linear approximation is
carried out at each time event described earlier, be it percentage or event based. At each point in time the mean joint configuration is calculated from the 40 trials. Based around this joint configuration a linear version of the forward kinematic equations was created. This linear approximation was calculated using the Jacobian of the forward kinematic equation at this joint configuration. The Jacobian is a matrix of the first-order partial derivatives of the forward kinematic equation. This linear approximation has been shown to be valid over the short range of values obtained in the trials (Scholz & Schöner, 1999). The RMSE in the calculation of the end point using the approximated forward kinematic compared to the full forward kinematic model was calculated as 2.2mm x 1.9mm x 2.4mm, this is considerably less than the 27.8mm and 19.7mm quoted by Scholz and Schöner (1999). The UCM analysis was carried out as given by Martin (2005), starting with the linearized forward kinematic model:
𝑟 − 𝑟#= 𝐽 𝜃# ∙ (𝜃 − 𝜃#) (1)
where Ɵ0 is the mean joint configuration, and r0 is the corresponding outcome variable. J(Ɵ0) is the Jacobian matrix of dimensions, d x n (outcome DOF by effector system DOF).
The null space of the Jacobian is then solved:
0 = 𝐽 𝜃# ∙ 𝜀
- (2)
The null space of the Jacobian here gives i basis vectors, for which i has length n - d. The component of the deviation of the joint angles from the mean, Ɵ -Ɵ0, which lies in the UCM, is calculated by:
𝜃./0 = ((𝜃 − 𝜃#) ∙ 𝜀-)×𝜀 -234
-56
(3) where εi
has been normalized. The component orthogonal to the UCM is calculated by:
𝜃789: = 𝜃 − 𝜃# − 𝜃
./0 (4)
The variance per DOF is the calculated for both dimensions:
𝑉./0 = 𝜃./0 < = >56 𝑛 − 𝑑 × 𝑁 (5) 𝑉789: = (𝜃 789:)< = >56 𝑑×𝑁 (6) And also for the total variance of the effector system:
𝑉BC9DE =
( 𝜃 − 𝜃# )< =
>56
where N is the number of trials, which in the current study was 40, and ƟUCM and ƟOrth are the lengths
of the deviation vectors. The variance of the outcome variables was calculated similarly to the effector system variance.
Similarly to Scholz et al (2000), to compare the relative values of VUCM and VOrth and quantify the strength of synergy, the ratio RV of VUCM/VOrth was also evaluated. As experienced golfers, all of the participants involved in this study had some level of control of the swing, and this control may present in different ways. With regards to RV, a value greater than 1 would suggest that a variety of joint angle combinations may be used to control the outcome variables, i.e. synergy. A value equal to 1 would suggest that the system variables may be indifferent to the outcome variables. A value of less than 1 would suggest that variance introduced into the system variables may be amplified in the outcome variables (Latash et al., 2002). While the value of Rv gives a measure of the strength of the synergy, it is the presence of a significant difference between the two components of variance that define whether the system is synergistic or not (Latash et al., 2002).
2.4. Statistical analysis
Statistical analysis was performed on outcome variance, system variance, RV, and the partitioned variance of VUCM and VOrth. The Kolmogorov-Smirnov test was applied to verify normality of the data and sphericity of the data was tested using Mauchly’s test. Where the assumption of sphericity was violated the Greenhouse-Geisser correction was used (Field, 2009). The values of outcome variance, system variance and RV were analysed using two-way mixed ANOVAs. The between-participant factor was skill level (2) and the within-participant factor was swing events (7) for this analysis. The partitioned variance was compared using a three-way mixed ANOVA with skill level (2) as the between-participant factor, and swing event (7) and variance type (2) as the within-participant factors. Repeated contrasts were used for swing event comparisons, i.e. each swing event except the first is compared to the previous event. The alpha level for significance for this analysis was set at 0.05.
3. Results
3.1. Participant data
Neither height nor mass was found to be significantly different between groups. Whilst age was found to be significantly higher in the intermediate skilled golfers (F=0.67, p<0.01) this was not considered to have any meaningful effect on the skill variables under investigation.
3.2. Outcome variance
The outcome variance appeared to show a similar profile for both N101 and SA methods with regards to the clubhead location, (figures 3(b) and (c)). The lowest variance appeared to be near the takeaway and impact events, with higher variance showing for late backswing and early downswing. Overall variance appeared to be higher in the intermediate skilled group. This was supported by the statistical analysis. The intermediate skilled group had significantly higher variance than the high skilled group overall (F= 30.8, p<0.01). Significant changes were also found between all adjacent phases
differed between the groups. The increase in variance from takeaway was greater in the intermediate skilled group (F= 21.9, p<0.01). There was a sharper decrease in variance from mid-backswing to late backswing in the intermediate skilled group (F= 5.7, p<0.05), and again from mid-downswing to impact (F= 9.8, p<0.01) (fig 3(a)).
With regards to the club orientation, the profile differed slightly (figure 3(d-f)). While the variance increased similarly to the clubhead location in the backswing, in the downswing the variance levelled off with a slight increase near impact. Again the statistical analysis suggested that the variance in the intermediate skilled group was significantly higher (F= 13.4, p<0.01). There were also some
significant changes between events, with an increase in variance from takeaway to mid-backswing
Fig 3. Plots of variance per DOF for clubhead location and orientation using swing events, shaft angle method (SA) and 101 point time normalization method (N101) († denotes sig diff from previous event irrespective of group (HS=High skilled, IS=Intermediate skilled), * denotes sig diff between groups from previous event) (Error bars represent one SEM) (TA=takeaway, MBS=mid backswing, LBS=late backswing, Top=top of the backswing, EDS=early downswing, MDS=mid downswing)
(F= 22.0, p<0.01), a decrease from the top of the backswing to early downswing (F= 43.0, p<0.01), and an increase from mid-downswing to impact (F= 8.9, p<0.01). However, these changes were not significantly different between groups.
3.3. Effector system variance
Fig 4. Plots of total variance per DOF for 10DOF and 7DOF systems using swing events, shaft angle method (SA) and 101 point time normalization method (N101) († denotes sig diff from previous event irrespective of group (HS=High skilled, IS=Intermediate skilled)) (Error bars represent one SEM) (TA=takeaway, MBS=mid backswing, LBS=late backswing, Top=top of the backswing, EDS=early downswing, MDS=mid downswing)
The effector system variance for the 10 DOF and 7 DOF systems appeared to have very similar profiles, with the variance slightly higher in the 7 DOF system. The variance in the SA analysis appeared steady with an increase near impact (fig 4(b) and (e)), while the N101 analysis showed an increase and decrease at around 60% of the backswing (fig 4(c) and (f)). The statistical analysis showed that the intermediate skilled group had significantly higher variance than the high skilled group in both the 7DOF and 10DOF systems (F= 15.8, p<0.01 and F= 17.5, p<0.01 respectively). Additional, a significant increase in variance is shown from mid-downswing to impact in both models (F= 12.7, p<0.01 and F= 12.6, p<0.01) (fig 4(a) and (d)). There were no significant group*event interactions.
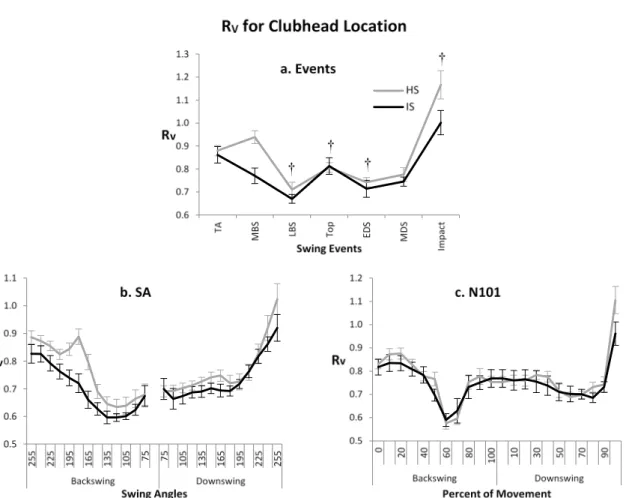
3.4. Variance ratio, RV
The values for RV with regards to the club location were predominantly less than 1. As motor synergy is defined here as the system having a significantly greater proportion of VUCM compared to VOrth, this suggested a lack of motor synergy. While the general profiles of RV in the N101 and SA analysis were broadly similar (fig 5(b) and (c)), with a decrease to the top and an increase up to impact, there were some important differences. There appeared to be another increase and decrease in variance around
Fig 5. Ratio (RV) of VUCM /VOrth for clubhead location at swing events, shaft angle method (SA) and 101
point time normalization method (N101) († denotes significant differences from previous event irrespective of group (HS=High skilled, IS=Intermediate skilled)) (Error bars represent one SEM) (TA=takeaway, MBS=mid backswing, LBS=late backswing, Top=top of the backswing, EDS=early downswing, MDS=mid downswing)
the top of the swing in the N101 analysis. Also the separation between the two groups appeared greater in the SA analysis, with the lines crossing each other multiple times in the N101 analysis. The statistical analysis suggested that the high skilled group had significantly higher values of RV than the intermediate skilled group (F= 10.2, p<0.01) (fig 5(a)). There were significant differences across events, most notably a large and highly significant increase from mid-downswing to impact (F= 57.7, p<0.01). However, there did not appear to be any significant group*event interactions.
The values of RV with respect to clubhead orientation all achieved a value greater than 1, and
therefore suggest synergy in the system with respect to this outcome. The profiles of the N101 and SA analyses appeared to differ here. They both started with high RV values that drop in the backswing, but where SA analysis stayed level in the downswing, the N101 analysis value for RV steadily increased. Again, the SA analysis appeared to show greater separation between groups than the N101 analysis (fig 6(b) and (c)).
The statistical analysis showed differences between both events and groups. The high skilled group had a significantly higher RV value than the intermediate skilled group (F= 5.7, p<0.05). Many of the differences between adjacent events were significant (fig 6(a)), most notably was a highly significant increase in RV from the top of the backswing to early downswing (F= 161.7, p<0.01). There were also significant event*group interactions (F= 4.2, p<0.01). The change in RV between takeaway and
mid-Fig 6. Ratio (RV) of VUCM /VOrth for clubhead orientation at swing events, shaft angle method (SA) and 101
point time normalization method (N101) († denotes sig diff from previous event irrespective of group (HS=High skilled, IS=Intermediate skilled), * denotes sig diff between groups from previous event) (Error bars represent one SEM) (TA=takeaway, MBS=mid backswing, LBS=late backswing, Top=top of the backswing, EDS=early downswing, MDS=mid downswing)
backswing was significantly different between groups, with the high skilled group increasing and the intermediate skilled group decreasing (F= 19.6, p<0.01). There were also significant differences between groups for changes between mid-backswing and late backswing (F= 6.6, p<0.05), and the top of the backswing and early downswing (F= 11.8, p<0.01).
Finally, the values for RV for the combined clubhead position and orientation models were
predominantly above 1 and seemingly higher than those for the orientation model alone. The profiles of these plots appeared to be similar to this for the clubhead orientation model (fig 7(b) and (c)). Again, the high skilled group had a significantly higher RV than the intermediate skilled group (F= 6.3, p<0.05). There were significant decreases in RV during the backswing (p<0.01), and a highly significant increase from the top of the backswing to early downswing (F= 101.1, p<0.01) (fig 7(a)).
3.5. Partitioned variance, VUCM and VOrth
With regards to the clubhead location, in both the high skilled and intermediate skilled groups the decrease in RV during the backswing appeared to be caused by an increase in VOrth while VUCM stayed
Fig 7. Ratio (RV) of VUCM /VOrth for combined clubhead location and orientation at swing events, shaft
angle method (SA) and 101 point time normalization method (N101) († denotes sig diff from previous event irrespective of group (HS=High skilled, IS=Intermediate skilled)) (TA=takeaway, MBS=mid backswing, LBS=late backswing, Top=top of the backswing, EDS=early downswing, MDS=mid downswing)
reasonably consistent (fig. 8(a) and (b)). This is confirmed in the statistical analysis with a significant difference between VOrth and VUCM from mid-backswing to late backswing (F= 12.3, p<0.01). Other significant interactions between variance type and event were evident from late backswing to the top of the backswing and the top of the backswing to early downswing (fig. 8(a) and (b)), but most notably there was a decrease in VOrth and increase in VUCM from mid-downswing to impact, which showed a highly significant interaction between event and variance type (F= 41.9, p<0.01). In the case of the high skilled group, VOrth and VUCM crossed over, hence the value of RV exceeding 1.
Fig 8. Partitioned variance (VUCM and VOrth) for high skilled (HS) and intermediate skilled (IS), and for
clubhead location, orientation and combined at swing events († denotes sig change between variance type from previous event irrespective of group (HS=High skilled, IS=Intermediate skilled)) (Error bars represent one SEM) (TA=takeaway, MBS=mid backswing, LBS=late backswing, Top=top of the backswing, EDS=early downswing, MDS=mid downswing)
A significant difference was found between the two types of variance (F= 178.1, p<0.01), which suggests that the lack of synergy of the system was significant across groups for clubhead location. The type*group interaction was also found to be significant (F= 20.9, p<0.01). This suggests that while neither group achieved synergy, the high skilled group was closer to it. This was backed up by the higher RV for the high skilled group.
In the clubhead orientation model, the early drop in RV appeared to be attributed to an increase in VOrth with comparatively consistent VUCM values (fig. 8(c) and (d)). A highly significant event*type interaction was seen from the top of the backswing to early downswing (F=51.0, p<0.01). This was due to a decrease in VOrth and an increase in VUCM, and explains the significant increase in RV over the same period. A significant difference was found between the two types of variance (F= 318.6,
p<0.01), suggesting that the synergy in the system was significant. With the type*group interaction approaching significance (F= 3.8, p=0.067) there may have also been greater strength of synergy in the high skilled group, which was again backed up by the high value of RV in the high skilled group. The combined outcome model showed very similar results to the clubhead orientation model, but with slightly lower values for VOrth (fig. 8(e) and (f)). The decrease in RV around the top of the swing appeared to be caused by the drop in VUCM and an increase in VOrth, followed by the reverse from the top of the backswing to early downswing. Although both VOrth and VUCM increased from mid-downswing to impact, VUCM increased significantly more rapidly (F= 12.8, p<0.01), hence the increase in RV over the same period. Again, significant differences were found between the two types of variance (F= 400.8, p<0.01), suggesting significant synergy in the system. The type*group
interaction was also significant (F= 7.4, p<0.05), suggesting that the strength of synergy in the high skilled group was significantly higher.
4. Discussion
This study has provided new insights into the mechanisms that control the variance in the golf swing. The hypothesis of synergy being present in the control of the clubhead orientation and combined models was confirmed, as was the hypothesis of greater strength of synergy for combined outcomes in the high skilled group. However, the hypothesis that the body was synergistic in its control of the variance in clubhead location was rejected, although the proportional level of VUCM was greater in the high skilled group.
4.1. Time normalization vs swing angles
Previous research using the UCM analysis has normalised the time series of the action phase of the movement to 101 points (Rein et al., 2013; Scholz & Schöner, 1999; Scholz et al., 2000; Yang & Scholz, 2005). Similarly, studies of variance in the golf swing have normalised the backswing and downswing to 1001 points each (Morrison et al., 2014; Tucker et al., 2013) or just the downswing to 101 points (Horan et al., 2011). Also within golf, specifically defined events are also used. As well as the initiation of the movement (takeaway), change in direction of the movement (top of the
backswing), and impact, these also include events based on the position of the golf club (Kwon et al., 2012). With a large disparity between the length of the shortest and longest backswings between players it would be difficult to compare equivalent data between players based on percentage of the movement alone.
This study has compared the two methods qualitatively to identify any differences, and it appears that there are some noteworthy differences. Although the variance plots of the outcome variables were broadly similar in their shape, the N101 method appeared to have higher values for variance than the SA method (fig 3). This was particularly evident in the backswing where peak values for the clubhead location variance in the N101 method were nearly double that of the SA method. With the backswing being a slower movement, this can be accounted for by the variance in timing between shots for each player. Additionally, the events for the SA method were based on club shaft orientation and, therefore, likely to produce lower variance for club location. While the difference between the clubhead
orientation variance between N101 and SA method was not as great, it was still inflated in the N101 method and still suggests timing differences.
The variance in the effector systems had more comparable magnitudes between N101 and SA methods (fig 4). However, there did appear to be an additional peak in the variance at 60% of the backswing using the N101 method. Even for the longest swing this percentage of the backswing was still within the portion that the SA method shows, and should show a corresponding peak. Again this may be a timing issue between swings.
With regards to RV, a different phenomenon presented. Again the plot profiles were fairly similar, notwithstanding the missing information at the top of the swing in the SA method. However, the separation between the two skill levels was very much reduced in the N101 method. The lines crossed on multiple occasions in the N101 plots, with only minimal occurrences in the SA plots. This may be more related to the differences in timings between groups, with the value of RV going through drastic changes across the movement. Another consideration is the difference in the movement speed with different events. It has been shown that as movement speed increases so does VUCM but not VOrth (Scholz, Dwight-Higgin, Lynch, Tseng, Martin, Schöner, 2011). Although the values of VUCM and VOrth are calculated separately for each event for each player, the player’s values may align differently when the mean group value for the different normalisation methods. Taking both swing length and swing speed into consideration, it is difficult to predict what effect this might have, only that it could account for some of the differences seen.
This study therefore highlights an important methodological issue when using events and time normalization in analysis of the golf swing. A prudent approach is required, with careful comparisons between methods undertaken, and clear justification for either method provided.
4.2. Clubhead location
Previous research into the variability of the clubhead trajectory in the golf swing has found similar trends to the current study (Horan et al., 2011; Morrison et al., 2014). While the increase in clubhead trajectory variance in the backswing may be attributed to the highly repeatable setup position of having the club next to the ball, the decrease in variance during the downswing at high speed has been more difficult to explain.
The results here showed a significant effect of skill level, with the high skilled group having lower variance in clubhead location, and also in the effector system. However, the changes between events appeared to indicate a difference between the input variance from the body and the outcome variance in the clubhead location. While the outcome variance decreased significantly from mid-downswing to impact, there was a significant increase in the effector system variance over the same period.
The mechanism behind this disparity appears to lie in the use of the abundant DOF in the effector system. RV was significantly higher in the high skilled group than the intermediate skilled group. However, the partitioned variance and RV shows a significant lack of synergy in both. Although below 1 for the majority of the swing, the significant increase in RV from mid-downswing to impact pushes the value marginally above 1 in the high skilled group. The system went from amplifying “errors” to simply being indifferent to the outcome (Latash et al., 2002). While the difference did not show a significant group*event interaction, there did appear to be a sharper increase in the high skilled group. This may explain how the clubhead location variance decreased considerably more rapidly in the high skilled group than the intermediate skilled group.
The partitioned variance of the effector system gave an insight into why RV changed. In both high skilled and intermediate skilled groups, the change in variance differed between VUCM and VOrth from mid-downswing to impact. VUCM appeared to increase leading up to impact. While there was also a decrease in VOrth over the same period, the overall effector system variance increased. This increase in VUCM prior to impact appears to be the mechanism by which the effector system increases its variance but not at the expense of the clubhead location variance; on the contrary, it decreases.
Previous studies on throwing (Yang & Scholz, 2005), striking (Rein et al., 2013) and shooting (Scholz et al., 2000) have found significant levels of synergy with respect to end-effector location. It is worth noting that arm and end point are visible during the majority of each of these movements, whereas this is not the case in the golf swing. The suggestion that sight may have an influence on levels of synergy is speculative, but an investigation into other unsighted movements may be interesting. Additionally, RV has been seen to increase leading up to the impact in stone knapping (Rein et al., 2013), but it has also been seen to decrease in shooting (Scholz et al., 2000). This may be related to the priority of the outcomes within the skill. While the golf swing and stone knapping are both striking skills with focussed targets to make contact with, shooting has a wider range of location possibilities at the point of firing, with the orientation of the gun more of a priority. This does suggest that the particular type of skill may well be influential in how the body structures its control.
In a very different type of movement, Krishnan et al. (2013) investigated the control of the foot location during walking using UCM analysis. While the current study of the golf swing found an initial increase in strength of synergy followed by a decrease, Krishnan et al. (2013) found the opposite. Their suggestion was that during the mid-stance phase, where the strength of synergy was highest, the central nervous system was attempting to avoid mediolateral limb collision. They go on to say that the lack of synergy in foot placement at heel strike is not to suggest that it is unimportant, but that it may be under more direct control by the individual. Similarly, in the golf swing the individual may exert more direct control over the clubhead at the top of the backswing, while the high speed movement near impact may require motor synergy to achieve the required accuracy of clubhead location.
In summary, while the player may not use the abundant DOF in the body to minimise the variance in the clubhead location for the majority of the swing, it does appear to approach this strategy near impact. Although the values were low, it is still important that they were higher in the high skilled group and therefore still related to skill level. Morrison et al (2014) previously suggested that the increase in clubhead location variance at the top of the swing may be an opportunity for adaptations. If this is the case, these adaptations were not synergistic in nature. It appears that the body only approaches a weak synergy near impact, the point of highest clubhead speed, and only in high skilled
golfers. An interesting development of this hypothesis would be to assess elite professional golfers in the same way to see if the trend continues.
4.3. Clubhead orientation
Although clubhead orientation and variability in clubhead orientation at impact have been shown to be critical with regards to shot direction (Betzler et al., 2014), no previous research has been conducted into clubhead orientation for the full swing. This may be due to the methodological difficulties in capturing a relatively small object in a large volume that changes orientation by such a degree. The current study achieved this and reveals new insights into the control of the club
orientation during the golf swing.
The variance in clubhead orientation followed a similar profile to clubhead location through the early parts of the swing. An initial increase peaked at the top of the backswing followed by a decrease into early downswing and mid-downswing. With no significant changes in effector system variance through the swing up to mid-downswing, and none that differed between groups, these changes were likely associated with RV as indicated by the significant drop in RV in the late backswing and increase in early downswing. Of particular interest is the significant difference in the increase in RV from the top of the backswing to early downswing, with the high skilled group increasing significantly more quickly. Although there is no similar group difference in the outcome variance over this period, the fact that this value of RV at early downswing is the highest in the downswing would suggest that the central nervous system exerts most of its control over clubhead orientation variance in this portion of the swing, and particularly in the high skilled group. This contrasts with clubhead location, where the peak value of RV appeared to be at impact, along with the lowest variance in clubhead location. For clubhead orientation the outcome variance increases from mid-downswing to impact. This may be explained by the significant increase in effector system variance with no significant increase in RV. Although RV does not increase into impact, VUCM does appear to increase up to impact similar to clubhead location. However, this is accompanied by an increase in VOrth as well.
Continuing the discussion on the difference between striking and shooting skills, the orientation of the end effector appears to have opposite trends as well. While RV in clubhead orientation appeared to level out or decrease near impact, in pistol shooting the value appeared to increase (Scholz et al., 2000). Again this may be linked to priority of the outcomes in the skill. However, this may not be the whole story, as clubhead orientation does have overall higher values for RV and would therefore suggest it was more of a priority. It may be the case that the outcome variables are controlled at the phase of the movement most appropriate to them.
In summary, with interaction between group and types of variance approaching significance, and a statistically significant difference between groups for RV, it appears that the body did use the
redundant DOF freedom throughout the swing to decrease variance in clubhead orientation, and more so in the high skilled group. With a different strategy to the clubhead location, this appears to peak in the early downswing, particularly for the high skilled group. Clubhead orientation variance does not appear to zero-in on impact like the clubhead location variance.
As the clubhead orientation and location are controlled for simultaneously during the swing, it was important to examine the combination of the two. Although values for RV for clubhead location did not reach 1, the combination of the two systems did appear to achieve higher values of RV than the clubhead orientation alone. In addition to this, the interaction between group and variance type was also significant, confirming that the amount of VUCM was significantly higher than VOrth and more so in the high skilled group. While there was some difference between how clubhead orientation and location approached impact individually, in combination RV appears in increase near impact and VUCM increases more quickly than VOrth. This continues to suggest an overall priority placed on the joint configuration being synergistic near impact.
4.5. Limitations
Before attributing group difference to skill level alone, other group differences were considered. The only other group difference found were in the ages of the participants, and it is an issue that has been encountered in previous studies with skill level based groups in golf (Fedorcik, Queen, Abbey, Moorman, & Ruch, 2011; Zheng, Barrentine, Fleisig, & Andrews, 2008). Differences in the strength of motor synergy have previously been found with aging (Verrel, Lövdén, & Lindenberger, 2012), where VUCM appeared to be lower in the later stages of a pointing movement in the older group. However, the difference in mean age in that study was approximately 48 years, and no differences were found in the early stages of the movement. With the current study presenting skill level differences over the majority of the movement and with a considerably smaller age gap of 15 years, this is unlikely to be an issue here. Nevertheless, this does remain a limitation of the study.
4.6. Implications
There has been a push from some quarters to find an optimal technique for the golf swing (Mann & Griffin, 1999). Much of the biomechanics literature compares the absolute movements of elite vs non-elite, high skilled vs low skilled, professional vs amateur golfer, the implication being that elite golfers have more optimal and desirable technique. Knight (2004) frames the issue well by suggesting that a swing that evolves from the intention to minimising the variability at impact, and one that is modelled on an elite player may hold important differences. The findings presented here indicate that higher skilled golfers were able to coordinate the abundant degrees of freedom in their body more effectively than the intermediate skilled golfers. This suggests that to attain higher skill levels within golf may not lie in simply altering the movement to a perceived “correct” or invariant technique, but may lie more in how the player develops control over the abundant degrees of freedom in the body. While there are undoubtedly limits to the notion that the golf swing can take any form, to better understand how high performance is achieved in golf, research emphasising the control structure of the swing and how this is best developed should be prioritised.
In more general terms, the findings of this study contribute valuable insights for the field of motor control. These findings appear well aligned with previous research suggesting an increase in the strength of synergy with practice (Wu & Latash, 2014); assuming the high skilled golfers in the present study were more practiced than intermediate skill level golfers. However, to the authors’ knowledge this is one of the most complex, high speed movements in which this type of analysis has been performed. While the understanding of more simple everyday tasks are important, the limits to which an individual can control the variation of movement should also be explored. Although high
speed movements with this level of complexity are more common in a sporting environment, they are also highly applicable to fields such as manufacturing and the arts. Therefore, it is hoped that further study is devoted to movements of this complexity to gain a greater understanding of the limits of human skill acquisition.
5. Conclusion
Motor abundance and control structure were analysed in the golf swing and the results indicated that: (1) higher skilled golfers utilised the abundant degrees of freedom better than lower skilled players for all measured outcome variables; (2) synergy was evident in the control of the orientation of the clubhead and the combined outcome variables but not for clubhead location; and (3) both skill levels increased their control over the clubhead location leading up to impact, while more control was exerted over the clubhead orientation in the early downswing. Finally, the results suggest that the achievement of higher golf swing skill levels may not lie simply in optimal technique, but may lie more in developing control over the abundant DOF in the body.
References
Betzler, N. F. (2010). The Effect of Differing Shaft Dynamics on the Biomechanics of the Golf Swing
(PhD thesis). Edinburgh Napier University.
Betzler, N. F., Monk, S. A., Wallace, E. S., & Otto, S. R. (2012). Variability in clubhead presentation characteristics and ball impact location for golfers’ drives. Journal of Sports Sciences, 30, 439–448.
Betzler, N. F., Monk, S. A., Wallace, E. S., & Otto, S. R. (2014). The relationships between driver clubhead presentation characteristics, ball launch conditions and golf shot outcomes.
Proceedings of the Institution of Mechanical Engineers, Part P: Journal of Sports Engineering and Technology, 228, 242–249.
Bootsma, R. J., & Van Wieringen, P. C. (1990). Timing an attacking forehand drive in table tennis.
Journal of Experimental Psychology: Human Perception and Performance, 16, 21. Brown, S. J., Selbie, W. S., & Wallace, E. S. (2013). The X-Factor: An evaluation of common
methods used to analyse major inter-segment kinematics during the golf swing. Journal of Sports Sciences, 31, 1156–1163.
Coleman, S., & Rankin, A. (2005). A three-dimensional examination of the planar nature of the golf swing. Journal of Sports Sciences, 23, 227–234.
Domkin, D., Laczko, J., Djupsjöbacka, M., Jaric, S., & Latash, M. L. (2005). Joint angle variability in 3D bimanual pointing: uncontrolled manifold analysis. Experimental Brain Research, 163, 44–57.
Domkin, D., Laczko, J., Jaric, S., Johansson, H., & Latash, M. L. (2002). Structure of joint variability in bimanual pointing tasks. Experimental Brain Research, 143, 11–23.
Fedorcik, G. G., Queen, R. M., Abbey, A. N., Moorman, C. T., & Ruch, D. S. (2011). Differences in wrist mechanics during the golf swing based on golf handicap. Journal of Science and Medicine in Sport.
Field, A. (2009). Discovering Statistics using SPSS (3rd ed.). London: Sage.
Giakas, G., Baltzopoulos, V., & Bartlett, R. (1997). Improved extrapolation techniques in recursive digital filtering: a comparison of least squares and prediction. Journal of Biomechanics, 31, 87–91.
Glazier, P. (2011). Movement variability in the golf swing: Theoretical methodological and practical issues. Research Quarterly for Exercise and Sport, 82, 157–161.
Harper, T. E., Roberts, J. R., & Jones, R. (2005). Driver swingweighting: a worthwhile process?
Proceedings of the Institution of Mechanical Engineers, Part B: Journal of Engineering Manufacture, 219, 385–393.
Horan, S. A., Evans, K., & Kavanagh, J. J. (2011). Movement Variability in the Golf Swing of Male and Female Skilled Golfers. Medicine & Science in Sports & Exercise, 43, 1474–1483. Horan, S. A., & Kavanagh, J. J. (2012). The control of upper body segment speed and velocity during
the golf swing. Sports Biomechanics, 11, 165–174.
Kapur, S., Zatsiorsky, V. M., & Latash, M. L. (2010). Age-related changes in the control of finger force vectors. Journal of Applied Physiology, 109, 1827–1841.
Keogh, J. W. L., & Hume, P. A. (2012). Evidence for biomechanics and motor learning research improving golf performance. Sports Biomechanics, 11, 288–309.
Knight, C. A. (2004). Neuromotor Issues in the Learning and Control of Golf Skill. Research Quarterly for Exercise and Sport, 75, 9–15.
Krishnan, V., Rosenblatt, N. J., Latash, M. L., & Grabiner, M. D. (2013). The effects of age on stabilization of the mediolateral trajectory of the swing foot. Gait & Posture, 38, 923-928. Kwon, Y.-H., Como, C. S., Singhal, K., Lee, S., & Han, K. H. (2012). Assessment of planarity of the
golf swing based on the functional swing plane of the clubhead and motion planes of the body points. Sports Biomechanics, 11, 127–148.
Langdown, B. L., Bridge, M., & Li, F.-X. (2012). Movement variability in the golf swing. Sports Biomechanics, 11, 273–287.
Latash, M. L. (2000). There is no motor redundancy in human movements. There is motor abundance.
Motor Control, 4, 259–260.
Latash, M. L. (2010) Stages in learning motor synergies: A view based on the equilibrium-point hypothesis. Human Movement Science, 29, 642-654.
Latash, M. L. (2012). The bliss (not the problem) of motor abundance (not redundancy). Experimental Brain Research, 217, 1–5.
Latash, M. L., Scholz, J. P., & Schöner, G. (2002). Motor control strategies revealed in the structure of motor variability. Exercise and Sport Sciences Reviews, 30, 26–31.
Lee, D. N., Roly, J., & Thomson, J. A. (1982). Regulation of gait in long jumping. Journal of Experimental Psychology: Human Perception and Performance, 8, 448–459.
Mann, R., & Griffin, F. (1999). Swing Like a Pro: The Breakthrough Scientific Method of Perfecting Your Golf Swing (1st ed.). Broadway Books.
Martin, J. R., Terekhov, A. V., Latash, M. L., & Zatsiorsky, V. M. (2013). Optimization and Variability of Motor Behavior in Multifinger Tasks: What Variables Does the Brain Use?
Journal of Motor Behavior, 45, 289–305.
Martin, V. (2005). A dynamical systems account of the uncontrolled manifold and motor equivalence in human pointing movements (Doctoral dissertation). Ruhr-Universität Bochum.
Morrison, A., McGrath, D., & Wallace, E. (2014). Changes in club head trajectory and planarity throughout the golf swing. Procedia Engineering, 72, 144–149.
Park, J., Sun, Y., Zatsiorsky, V. M., & Latash, M. L. (2011). Age-related changes in optimality and motor variability: an example of multifinger redundant tasks. Experimental Brain Research,
212, 1–18.
Rein, R., Bril, B., & Nonaka, T. (2013). Coordination strategies used in stone knapping: Coordination Strategies Used in Stone Knapping. American Journal of Physical Anthropology, 150, 539– 550.
Reisman, D. S., Scholz, J. P., & Schöner, G. (2002). Coordination underlying the control of whole body momentum during sit-to-stand. Gait & Posture, 15, 45–55.
Scholz, J. P., Kang, N., Patterson, D., & Latash, M. L. (2003). Uncontrolled manifold analysis of single trials during multi-finger force production by persons with and without Down syndrome. Experimental Brain Research, 153, 45–58.
Scholz, J. P., Dwight-Higgin, T., Lynch, J. E., Tseng, Y. W., Martin, V., & Schöner, G. (2011). Motor equivalence and self-motion induced by different movement speeds. Experimental Brain Research, 209, 319-332.
Scholz, J. P., Reisman, D., & Schöner, G. (2001). Effects of varying task constraints on solutions to joint coordination in a sit-to-stand task. Experimental Brain Research, 141, 485–500.
Scholz, J. P., & Schöner, G. (1999). The uncontrolled manifold concept: identifying control variables for a functional task. Experimental Brain Research, 126, 289–306.
Scholz, J. P., Schöner, G., & Latash, M. L. (2000). Identifying the control structure of multijoint coordination during pistol shooting. Experimental Brain Research, 135, 382–404. Schöner, G. (1995). Recent developments and problems in human movement science and their
Schwartz, M. H., & Rozumalski, A. (2005). A new method for estimating joint parameters from motion data. Journal of Biomechanics, 38, 107–116.
Scott, M. A., Li, F.-X., & Davids, K. (1997). Expertise and the regulation of gait in the approach phase of the long jump.pdf. Journal of Sports Sciences, 15, 597–605.
Sinclair, J., Currigan, G., Fewtrell, D. J., & Taylor, P. J. (2014). Biomechanical correlates of club-head velocity during the golf swing. International Journal of Performance Analysis in Sport,
14, 54–63.
Tucker, C. B., Anderson, R., & Kenny, I. C. (2013). Is outcome related to movement variability in golf? Sports Biomechanics, 1–12.
Verrel, J., Lövdén, M., & Lindenberger, U. (2012). Normal aging reduces motor synergies in manual pointing. Neurobiology of Aging, 33, 200.e1–200.e10.
Vint, P. F., & Hinrichs, R. N. (1996). Endpoint error in smoothing and differentiating raw kinematic data: An evaluation of four popular methods. Journal of Biomechanics, 29, 1637–1642. Winter, D. A. (2009). Biomechanics and motor control of human movement (4th ed.). Hoboken, N.J:
Wiley.
Wu, Y.-H., & Latash, M. L. (2014). The effects of practice on coordination. Exercise and Sport Sciences Review, 42, 37-42.
Wu, Y.-H., Pazin, N., Zatsiorsky, V.M., & Latash, M.L. (2012). Practicing elements versus practicing coordination: Changes in the structure of variance. Journal of Motor Behavior, 44, 471-478. Wu, Y.-H., Truglio, T.S., Zatsiorsky, V.M., & Latash, M.L. (2015). Learning to combine variability with high precision: Lack of transfer to a different task. Journal of Motor Behavior, 47, 153-165
Yang, J.-F., & Scholz, J. P. (2005). Learning a throwing task is associated with differential changes in the use of motor abundance. Experimental Brain Research, 163, 137–158.
Zheng, N., Barrentine, S. W., Fleisig, G. S., & Andrews, J. R. (2008). Kinematic analysis of pro and amateur golfers. International Journal of Sports Medicine, 29, 487–493.
Appendix A
Table A1. Marker locations, descriptions and sizes (FJC – used to find functional joint centre)
Segment Marker description Type of
markers Acromion (semi-rigid
marker cluster) (6.4mm)
Acromioclavicular joint (AC) Dynamic
Acromion angle (AA) Dynamic
5cm along the spine of the scapula (A3) Dynamic Glenohumeral joint centre
(GHJ)
Functional joint centre between acromion and upper arm clusters, tracked by acromion cluster
Computed Upper arm (semi-rigid
marker cluster, under-wrapped) (10mm)
Lateral surface of the distal humerus, under-wrapped by foam rubber backed lycra material
Dynamic Elbow (10mm) Medial epicondyle of the humerus Static
Lateral epicondyle of the humerus Dynamic Elbow joint centre Mid-point between elbow markers, tracked by
upper arm cluster
Computed Forearm (under-wrapped)
(6.4mm) Medial-caudal ulna styloid Dorsal radial head Dynamic Dynamic 5cm proximally along the radius Dynamic Wrist joint centre Functional joint centre between forearm and hand
clusters, tracked by forearm cluster
Computed
Hand (6.4mm) 2nd metacarpal head Static/FJC
4th metacarpal head Static/FJC
Base of the 3rd metacarpal Static/FJC Club shaft (tape) Two pieces of retro-reflective tape 20cm apart Dynamic Clubhead (12.7mm) Three crown markers attached using fabric and tape Dynamic
Clubface (6.4mm) Face centre Static
Toe, top groove Static
Heel, top groove Static
Toe, bottom groove Static
Heel, bottom groove Static
Face centre Referenced to face centre marker and translated back to surface of the face, tracked by clubhead cluster
Computed Club sphere centre The 5 clubface markers were fitted to a sphere of
253mm radius, this is the centre of that sphere Computed Apex of ball (tape) Small piece of retro-reflective take on the apex of
the ball, approx. 6mm diameter
Dynamic Ball centre Situated 1 x radius vertically below the apex of the
ball marker
Appendix B
Rotation matrices for forward kinematic segments: GCS-lower body joint:
𝑅6= cos 𝜃6 0 sin 𝜃6 0 1 0 − sin 𝜃6 0 cos 𝜃6 𝑅<= 1 0 0 0 cos 𝜃< − sin 𝜃< 0 sin 𝜃< cos 𝜃< Lower-upper body joint:
𝑅M= 1 0 0 0 cos 𝜃M − sin 𝜃M 0 sin 𝜃M cos 𝜃M Shoulder joint: 𝑅N= 1 0 0 0 cos 𝜃N − sin 𝜃N 0 sin 𝜃N cos 𝜃N 𝑅O= cos 𝜃O 0 sin 𝜃O 0 1 0 − sin 𝜃O 0 cos 𝜃O
𝑅P= cos 𝜃sin 𝜃PP − sin 𝜃cos 𝜃PP 00
0 0 1
Elbow joint fixed rotations:
𝑅Q= 1 0 0 0 cos 𝜃Q − sin 𝜃Q 0 sin 𝜃Q cos 𝜃Q 𝑅R= cos 𝜃R 0 sin 𝜃R 0 1 0 − sin 𝜃R 0 cos 𝜃R Elbow joint free rotation:
𝑅S= cos 𝜃S − sin 𝜃S 0 sin 𝜃S cos 𝜃S 0 0 0 1 Wrist joint: 𝑅6#= 1 0 0 0 cos 𝜃6# − sin 𝜃6# 0 sin 𝜃6# cos 𝜃6#
𝑅66=
cos 𝜃66 0 sin 𝜃66
0 1 0
− sin 𝜃66 0 cos 𝜃66
𝑅6<= cos 𝜃sin 𝜃6<6< − sin 𝜃cos 𝜃6<6< 00
0 0 1
Segment lengths (1= lower body, 2= upper body, 3= upper arm, 4= lower arm, 5= hand/club):
𝑃6= 0 𝐿6 0 , 𝑃< = 0 𝐿< 0 , 𝑃M= 𝐿M 0 0 , 𝑃N= 𝐿N 0 0 , 𝑃O= 𝐿O 0 0
Forward kinematic of club position:
𝑃 = 𝑅 -6< -56 𝑃O+ 𝑅 -S -56 𝑃N+ 𝑅 -P -56 𝑃M+ 𝑅 -M -56 𝑃<+ 𝑅 -< -56 𝑃6
The forward kinematic equation for the two orientation vectors of the club face were as follows:
𝑉6= 𝑅 -6< -5N 0 0 −1 𝑉< = 𝑅 -6< -5N 0 −1 0
where V1 and V2 are the product of the last 9 rotation matrices (R4 to R12) and negative unit y and unit z vectors.