Application of multiple linear regression and machine learning algorithms
to elucidate the association of poor glycemic control and
hyperhomocysteinemia with microalbuminuria
Iyyapu Krishna Mohan1, NN Sreedevi1, KSS Sai Baba1, M Vijaya Bhaskar1, Tajamul Hussain2, 3, Salman A Alrokayan3, 4 & Shaik Mohammad Naushad5*
1Nizam’s Institute of Medical Sciences, Punjagutta, Hyderabad -500 082, Telangana, India 2
Center of Excellence in Biotechnology Research, College of Science; 3Department of Biochemistry, Research Chair for Biomedical Applications of Nanomaterials; 4Department of Biochemistry,
College of Science, King Saud University, Riyadh -11451, Saudi Arabia
5
Sandor Speciality Diagnostics Pvt. Ltd., Banjara Hills, Hyderabad -500 034, Telangana, India Received 10 February 2018; revised 08 November 2018
Microalbuminuria is an early biomarker of general vascular dysfunction and a predictor of risk for cardiovascular and renal diseases. It is also considered as a marker of insulin resistance in both diabetic and non-diabetic patients. The rationale of this study was to elucidate threshold values of fasting blood glucose (FBS) and glycosylated hemoglobin (HbA1c) that are associated with microalbuminuria. In the parallel association of microalbuminuria with hyperhomocysteinemia was investigated. Machine learning algorithm and multiple linear regression were applied to study the association of poor glycemic control on microalbuminuria and hyperhomocysteinemia. In non-diabetic subjects with FBS <102 mg/dL and HbA1c <6.3%; and in diabetic subjects with good glycemic control (FBS: 102-118 mg/dL; HbA1c: 6.3-7.0%), urinary microalbumin levels were <40µg/mg creatinine. Poor glycemic control (FBS >172 mg/dL and HbA1c >9.0%) was associated with microalbumin >40µg/mg creatinine. Age, gender, HbA1c and FBS were shown to explain variability in urinary microalbumin to the extent of 54.4% as shown by multiple linear regression model. Analysis of variance (ANOVA) revealed higher levels of FBS (F: 39.77, P <0.0001), HbA1c (F: 64.31, P <0.0001) and total plasma homocysteine (F: 3.69, P =0.04) in microalbuminuria and clinical microalbuminuria groups when compared to subjects with normal microalbumin levels. Diabetic patients with poor glycemic index had a more B12 deficiency. Poor
glycemic index and hyperhomocysteinemia were associated with clinical microalbuminuria.
Keywords: Diabetes, HbA1c, Homocysteine, Machine learning algorithms, Microalbuminuria India is emerging as the diabetes capital of the world
with 62 million individuals affected with diabetes1. The global prevalence of microalbuminuria was reported to be 39%2. The duration of diabetes and HbA1c levels were reported to have positive association with urinary microalbumin levels3,4. Urinary proteome analysis of microalbuminuria cases revealed α2-HS-glycoprotein, vitamin D binding protein, CD59, an extracellular matrix protein 1 (ECM1), factor H and myoglobin5. The α2-HS-glycoprotein was associated with functions such as endocytosis, brain development and formation of bone tissue. Vitamin D binding protein binds vitamin D2, vitamin D3 and their 25-hydroxylated forms and facilitates their transport across different tissues. CD59 causes microvesicular damage while ECM1 and factor H influence mesangial cell proliferation.
25-hydroxy vitamin D deficiency was reported to be associated with diabetes and renal disease6.
A recent study showed elevated plasma homocysteine levels in type II diabetes mellitus and this elevation increases further due to increased insulin resistance and poor glycemic control7. In healthy adults, plasma homocysteine was reported to be positively associated with microalbumin in men8. Patients with type II diabetes, long-term treatment with metformin and smoking were shown to have a higher prevalence of vitamin B12 deficiency
9
. B12 supplementation in children
was shown to influence the regulation of several metabolically important type II diabetes-associated genes through methylation of miR 2110.
In view of the positive association of diabetes and HbA1c with microalbuminuria, the association of treatment-induced vitamin B12 deficiency in type II
diabetes, the current study was planned to investigate the thresholds of fasting blood glucose, HbA1c ——————
*Correspondence:
Phone: +91-8331088685 (Mob) Email: naushadsm@gmail.com
and total plasma homocysteine associated with microalbuminuria and clinical microalbuminuria. Materials and Methods
Recruitment of subjects
We have enrolled a total of 975 subjects, which includes 873 diabetic patients (514 men and 359 women) and 102 non-diabetic controls (57 men and 45 women) at the out-patient unit of Nizam’s Institute of Medical Sciences, Hyderabad, India. The mean ages in diabetic and non-diabetic patients were 60.6±13.1 year and 58.9±10.5, respectively. The study protocol was approved by the Institutional Ethical committee of Nizam’s Institute of Medical Sciences, Hyderabad, India. All the enrolled subjects consented for the study.
Biochemical evaluation
Blood glucose levels were estimated by hexokinase method using Roche Cobas c501 fully automated chemistry analyzer (Roche Diagnostics, U.S.A.). HbA1c levels were estimated by using the Bio-Rad D-10TM Dual Program intended for the percent determination of HbA1c in human whole blood using ion-exchange high-performance liquid chromatography (HPLC). The samples are automatically diluted on the D-10 and injected into the analytical cartridge. The D-10 delivers a programmed buffer gradient of increasing ionic strength to the cartridge, where the hemoglobins are separated based on their ionic interactions with the cartridge material. The separated hemoglobins then pass through the flow cell of the filter photometer, where changes in the absorbance 415 nm are measured. The A1c area is calculated using an exponentially modified Gaussian (EMG) algorithm that excludes the labile A1c and carbamylated peak area from the A1c peak area. Immunoturbidimetric assay on Roche Coas c501 analyzer was used to estimate urinary microalbumin levels. Anti-albumin antibodies react with the antigen in the sample to form antigen/antibody complexes which, following agglutination, are measured turbidimetrically. Vitamin B12, Folate and Homocysteine assays are
performed on ADVIA Centaur® XP Immunoassay system using kits manufactured by Simens Healthcare Diagnostics Inc., U.S.A.
Statistical analysis
Student t-test was performed for bivariate and ANOVA was performed for trivariate datasets of
continuous variables. Tetraplot software was used to plot trivariate models. The multiple linear regression model was developed using age, gender, FBS, HbA1c and diabetic status as the predictors and urinary microalbumin levels as the output using www.wessa.net. The association statistics were based on a machine learning algorithm developed using the computational software “www.bigml.com”.
Results
The diabetic subjects had elevated microalbumin levels in comparison to non-diabetic subjects (79.0±185 vs. 3.51±1.55 µg/mg creatinine, P <0.0001). The FBS levels in non-diabetic subjects were 97.17 ± 13.7 mg/dL. The FBS levels in diabetic patients were segregated based on HbA1c levels as shown below: HbA1c<6.0%: 112.29 ± 26.9 mg/dL; HbA1c: 6.0-8.0 %: 125.30 ± 29.7 mg/dL; HbA1c >8.0-10.0%: 161.57 ± 51.9 mg/dL; and HbA1c >10.0%: 234.29 ± 81.3 mg/dL. Analysis of variance (ANOVA) revealed that FBS levels are associated with glycosylated hemoglobin (F: 187.3, P <0.0001).
The microalbumin data was segregated into normal microalbumin (<30 µg/mg creatinine), microalbuminuria (30-300 µg/mg creatinine) and clinical microalbuminuria (>300 µg/mg creatinine). Further, segregation was done based on glycosylated hemoglobin. All cases of microalbuminuria were shown to have glycosylated hemoglobin >6.0 except one. The prevalence of microalbuminuria in subjects with HbA1C levels 6.0-8.0%, >8.0-10.0% and >10% were 26.3%, 33.7% and 66.0%, respectively, (2: 87.98, P <0.0001) while the prevalence of clinical microalbuminuria were 5.9%, 10.1% and 29.8%, respectively, (2: 14.54, P =0.0001).
The fasting blood glucose levels were within the renal threshold range in normal microalbumin group i.e.131.69 ±43.9 mg/dL. In microalbuminuria and clinical microalbuminuria the FBS levels are 163.73 ± 70.0 mg/dL and 171.79 ± 86.9 mg/dL, respectively, (F: 39.77, P <0.0001). Trivariate plot (Fig. 1) clearly demonstrates that in subjects with HbA1c <6.0% and fasting blood glucose within the renal threshold limit, there was no association with microalbuminuria.
As illustrates in (Fig. 2), B12 deficiency was
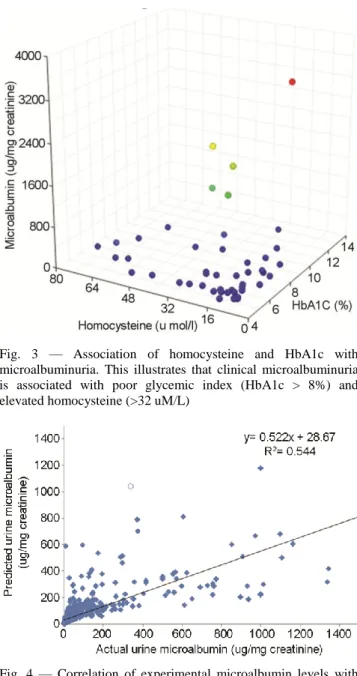
associated with poor glycemic index while folate status has no association. Clinical microalbuminuria was shown to be associated with HbA1c >8% and homocysteine >32 µM/L (Fig. 3).
Fig. 1 — Association of Glycosylated hemoglobin and Fasting blood sugar with urinary microalbumin. This clearly illustrates that Glycosylated hemoglobin <6.0% and Fasting blood sugar <100 mg/dL is not associated with microalbuminuria
Fig. 2 — Association of B12 and folate with glycemic index.
This illustrates that low B12 status is associated with the
poor glycemic index while folate status has no influence on the glycemic index
Fig. 3 — Association of homocysteine and HbA1c with microalbuminuria. This illustrates that clinical microalbuminuria is associated with poor glycemic index (HbA1c > 8%) and elevated homocysteine (>32 uM/L)
Fig. 4 — Correlation of experimental microalbumin levels with predictions based on multiple linear regression. The experimental microalbumin levels were correlated with multiple linear regression based predicted values (r2: 0.544)
Furthermore, we have deduced the following equation to depict the contribution of different variables towards urinary microalbumin using the multiple linear regression model:
Log 10 (Urine microalbumin) = −0.237477 + [0.00288253×age] + [0.0442243×gender] + [0.0811325×glycosylated hemoglobin] + [0.000990878×Fasting blood sugar] + [0.589106×diabetic]
This model explained 54.4% variability in urinary microalbumin (Fig. 4). The association statistics
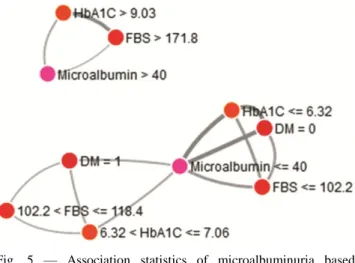
of machine learning algorithm reveal that non-diabetic subjects with FBS <102 mg/dL and Hb1Ac <6.32%; and diabetic subjects with FBS in the range of 102-118 mg/dL and HbA1c 6.32-7.06% will have microalbumin levels <40 µg/mg creatinine. Subjects with uncontrolled diabetes i.e.
FBS>171.8 mg/dL and HbA1c >9.03% are associated with microalbumin >40 µg/mg creatinine (Fig. 5). Discussion
The current study adds a new dimension to the already documented association of poor glycemic index and microalbuminuria by providing the thresholds of fasting blood glucose and HbA1c that are strongly associated with microalbuminuria. In order to establish these thresholds, machine learning algorithms were used for the first time. FBS >172 mg/dL and HbA1c >9.0 are associated with urine microalbumin >40 µg/mg creatinine. This is in agreement with another Indian study that demonstrated an increase in microalbumin levels with an increase in HbA1c11.
The renal threshold of glucose in type II diabetes patients was reported to vary based on age, disease duration and body mass index12. A large-scale study demonstrated that urinary albumin-creatinine ratio, age, weight, HbA1c, blood glucose, total cholesterol, antihypertensive drugs and heart rate as the key determinants of microalbuminuria in diabetes patient13, which is in agreement with our multiple linear regression model. Another large-scale study
applied multiple logistic regression model and demonstrated that microalbuminuria was associated with hyperglycemia and HbA1c in the non-obese group; and hypertension and HbA1c in the obese group in younger subjects14. Even in prediabetic subjects who have a genetic predisposition to diabetes due to Glucokinase (GCK) rs2908289, fasting blood glucose was associated with microalbuminuria even after adjusting for confounding factors such as age, gender, smoking, systolic blood pressure, waist circumference and serum triglycerides15. Prediabetic subjects were reported to have interleukin-6 (IL-6) and hyperinsulinemia indicating subclinical inflammation and insulin resistance even in prediabetic period16. Strong positive association was observed between IL-6 and insulin in these subjects16.
Consistent with our study, total plasma homocysteine levels were found to be higher in diabetic subjects and were positively associated with microalbuminuria17. Higher incidence of B12 deficiency
was reported in the elderly population, with longer diabetes mellitus duration, hypothyroidism and treatment with metformin18. Our results are in agreement with Passaro et al., in demonstrating association of poor glycemic control with hyperhomocysteinemia19. Subjects with microalbuminuria were reported to have higher blood pressure and homocysteine levels compared to those with normal microalbumin levels20. Dietary glycemic index was shown to have a positive association with homocysteine21. In type II diabetes patients, renal mishandling of thiamine increased degradation of vitamin B6 and cytosolic metabolic resistance to
vitamin B12 was reported 22
. A recent meta-analysis reported normal homocysteine levels in type I DM patients without any complications, however, in subjects with T1DM associated microvascular complications, such as diabetic retinopathy and diabetic neuropathy, hyperhomocysteinemia was observed23. In subjects with type II diabetes, the baseline plasma homocysteine and mean HbA1c levels were reported to be independent predictors of microalbuminuria24.
The strength of the current study are: (i) large sample size; (ii) application of multiple linear regression to understand the contribution of different variables towards microalbuminuria; (iii) establishment of thresholds of fasting blood glucose and HbA1c that contribute to microalbuminuria. The limitations are: (i) diabetes subjects were not grouped into type I or type II diabetes; (ii) information on diet Fig. 5 — Association statistics of microalbuminuria based
on a machine learning algorithm. The association statistics reveal that non-diabetic subjects with FBS <102 mg/dL and Hb1Ac <6.32; and diabetic subjects with FBS in the range of 102-118 mg/dL and HbA1c 6.32-7.06% will have microalbumin levels <40 µg/mg creatinine. Subjects with uncontrolled diabetes i.e. FBS >171.8 and HbA1C >9.03% are associated with microalbumin >40 µg/mg creatinine
and other lifestyle risk factors were not available. Future studies are warranted to investigate whether type I and type II diabetes subjects behave differently towards microalbuminuria.
Conclusion
Subjects with FBS >172 mg/dL and HbA1c >9.0% are associated with urine microalbumin >40 µg/mg creatinine. B12 deficiency was observed in subjects
with poor glycemic index. Clinical microalbuminuria is associated with hyperhomocysteinemia (>32 µM/L). References
1 Joshi SR, Diabetes care in India. Ann Glob Health, 81 (2015) 830.
2 Parving HH, Lewis JB, Ravid M, Remuzzi G & Hunsicker LG, Prevalence and risk factors for microalbuminuria in a referred cohort of type II diabetic patients: a global perspective. Kidney Int,69 (2006) 20573.
3 Aggarwal J & Kumar M, Prevalence of microalbuminuria among rural north indian population with diabetes mellitus and its correlation with glycosylated haemoglobin and smoking. J Clin Diagn Res, 8 (2014) CC11.
4 Kundu D, Roy A, Mandal T, Bandyopadhyay U, Ghosh E & Ray D, Relation of microalbuminuria to glycosylated hemoglobin and duration of type 2 diabetes. Niger J Clin Pract, 16 (2013) 216.
5 Marikanty RK, Gupta MK, Cherukuvada SV, Kompella SS, Prayaga AK, Konda S, Polisetty RV, Idris MM, Rao PV, Chandak GR & Dakshinamurty KV, Identification of urinary proteins potentially associated with diabetic kidney disease. Indian J Nephrol, 26 (2016) 434.
6 Mohan IK, Khan SA, Jacob R, Sai Baba KSS, Hussain T, Alrokayan SA & Naushad SM, Insights into the association of vitamin d deficiency with parathyroid hormone levels with relevance to renal function and insulin resistance. Curr Nutr Food Sci,13 (2017) 1.
7 Ala OA, Akintunde AA, Ikem RT, Kolawole BA, Ala OO & Adedeji TA, Association between insulin resistance and total plasma homocysteine levels in type 2 diabetes mellitus patients in south west Nigeria. Diabetes Metab Syndr, 11 suppl 2 (2017) S803.
8 Sabanayagam C & Shankar A, Association between plasma homocysteine and microalbuminuria in persons without hypertension, diabetes mellitus, and cardiovascular disease. Clin Exp Nephrol, 15 (2011) 92.
9 Khan A, Shafiq I, Hassan Shah M. Prevalence of Vitamin B12 deficiency in patients with type ii diabetes mellitus on metformin: a study from khyber pakhtunkhwa. Cureus, 9 (2017) e1577.
10 Yadav DK, Shrestha S, Lillycrop KA, Joglekar CV, Pan H, Holbrook JD, Fall CH, Yajnik CS & Chandak GR, Vitamin B12 supplementation influences methylation of genes associated with Type 2 diabetes and its intermediate traits. Epigenomics, 10 (2018) 71.
11 Poornima MA, Shenoy R & Hegde A, Laboratory assessment of the diabetes scenario with respect to hba1c and microalbuminuria. J Clin Diag Res,4 (2010) 2489.
12 Yue XD, Wang JY, Zhang XR, Yang JH, Shan CY, Zheng MY, Ren HZ, Zhang Y, Yang SH, Guo ZH, Chang B & Chang BC, Characteristics and impact factors of renal threshold for glucose excretion in patients with type 2 diabetes mellitus. J Korean Med Sci, 32 (2017) 621.
13 Chatzikyrkou C, Menne J, Izzo J, Viberti G, Rabelink T, Ruilope LM, Rump C, Mertens PR & Haller H, Predictors for the development of microalbuminuria and interaction with renal function. J Hypertens, 35 (2017) 2501.
14 Cho H & Kim JH, Prevalence of microalbuminuria and its associated cardiometabolic risk factors in Korean youth: Data from the Korea National Health and Nutrition Examination Survey. PLoS One,12 (2017) e0178716. 15 Choi JW, Moon S, Jang EJ, Lee CH & Park JS, Association
of prediabetes-associated single nucleotide polymorphisms with microalbuminuria. PLoS One, 12 (2017) e0171367. 16 Agarwal A, Hegde A, Yadav C, Ahmad A, Manjrekar PA &
Rukmini MS, Interleukin-6 in impaired fasting glucose. Indian J Biochem Biophys,55 (2018) 424.
17 Ozmen B, Ozmen D, Turgan N, Habif S, Mutaf I & Bayindir O, Association between homocysteinemia and renal function in patients with type 2 diabetes mellitus. Ann Clin Lab Sci,32 (2002) 279.
18 Tavares Bello C, Capitão RM, Sequeira Duarte J, Azinheira J & Vasconcelos C, Vitamin B12 deficiency in type 2 diabetes mellitus. Acta Med Port, 30 (2017) 719.
19 Passaro A, Calzoni F, Volpato S, Nora ED, Pareschi PL, Zamboni PF, Fellin R & Solini A, Effect of metabolic control on homocysteine levels in type 2 diabetic patients: a 3-year follow-up. J Intern Med,254 (2003) 264.
20 Kuang ZM, Wang Y, Feng SJ, Jiang L & Cheng WL, Association between plasma homocysteine and microalbuminuria in untreated patients with essential hypertension: a Case-Control Study. Kidney Blood Press Res,42 (2017) 1303.
21 Murakami K, Sasaki S & Uenishi K, Japan dietetic students’ study for nutrition and biomarkers group. dietary glycemic index, but not glycemic load, is positively associated with serum homocysteine concentration in free-living young japanese women. Nutr Res, 34 (2014) 25.
22 Adaikalakoteswari A, Rabbani N, Waspadji S, Tjokroprawiro A, Kariadi SH, Adam JM & Thornalley PJ, Disturbance of B-vitamin status in people with type 2 diabetes in Indonesia--link to renal status, glycemic control and vascular inflammation. Diabetes Res Clin Pract, 95 (2012) 415.
23 Feng Y, Shan MQ, Bo L, Zhang XY & Hu J, Association of homocysteine with type 1 diabetes mellitus: a meta-analysis. Int J Clin Exp Med,8 (2015) 12529.
24 Cho EH, Kim EH, Kim WG, Jeong EH, Koh EH, Lee WJ, Kim MS, Park JY & Lee KU, Homocysteine as a risk factor for development of microalbuminuria in type 2 diabetes. Korean Diabetes J, 34 (2010) 200.