Available online at www.iim.ftn.uns.ac.rs/ijiem_journal.php ISSN 2217-2661
UDK: 658.286
Selection of Supply Chain Performance Measurement
Frameworks in Electrical Supply Chains
Masoud Rahiminezhad Galankashi
PhD Candidate, Department of Material, Manufacturing and Industrial Engineering, Faculty of Mechanical Engineering, Universiti Teknologi Malaysia, Skudai, Malaysia, [email protected]
Ashkan Memari
PhD Candidate, Department of Material, Manufacturing and Industrial Engineering, Faculty of Mechanical Engineering, Universiti Teknologi Malaysia, Skudai, Malaysia
Ali Anjomshoae
PhD Candidate, Department of Material, Manufacturing and Industrial Engineering, Faculty of Mechanical Engineering, Universiti Teknologi Malaysia, Skudai, Malaysia
Azanizawati Ma'aram
Faculty Member, Department of Material, Manufacturing and Industrial Engineering, Faculty of Mechanical Engineering, Universiti Teknologi Malaysia, Skudai, Malaysia
Syed Ahmad Helmi
Faculty Member, Department of Material, Manufacturing and Industrial Engineering, Faculty of Mechanical Engineering, Universiti Teknologi Malaysia, Skudai, Malaysia
Received (17.07.2014); Revised (18.09.2014); Accepted (01.10.2014)
Abstract
Performance measurement plays an important role in today’s competitive market due to its direct
effect on supply chain's profitability. Many approaches have been applied for evaluating performance of firms, including financial, operational and balanced frameworks. Companies peruse to find the best fit performance measurement framework due to a variety of existing approaches. The main significance of performance framework selection is its important role in strategic decisions where many factors related to the companies’ performance may be neglected. Due to the nature of electrical companies such as high uncertainty in demand, short life cycle of products and competitive market, they have to frequently assess their performance. A fit framework should be determined based on the characteristics of this competitive market. In this study, a multi criteria decision making (MCDM) approach is used to find a proper framework for performance evaluation in electrical companies. Analytical hierarchical process (AHP) has been applied to select the best performance measurement framework based on supply chain macro processes. Finally, performance metrics for the selected framework are determined..
Key words: supply chain performance measurement; performance measurement frameworks; MCDM; AHP; Performance measurement metrics
1. INTRODUCTION
Performance measurement is a critical task to guarantee companies’ success in today’s competitive market. Performance measurement is referred to collection and analyzing of data to evaluate work done and results achieved. Performance measurement tries to answer the question of how the enterprise is doing to achieve its predetermined goals or how the company is performing them versus its competitors. The concept of performance measurement is not new; however it has been appeared in the initial theory of management contexts while a task could not be managed if cannot
be measured [1]. Performance measurement comprises to activities which try to analyze the achievement of a group, program, individual, policy or strategy by comparing actual situation and the expected one [2]. It is also defined as the task of qualifying the efficiency and effectiveness of an action [3].
Performance metrics have been changed rapidly due to the effect of today’s competitive global market. Performance measurement has been done through quality management and customer satisfaction, human resource management, financial management and process management [4, 5, and 6]. All performance measures need to be aligned with firms' supply chain
Period Characteristics of Business Organization Characteristics of PMS Before 1980
Systematic large organizations Cost Accounting
1980- 1990
Business organization became global
Cost and operation
1990- 2000
Automation of business processes
Mixed financial and non-financial
Process, quality and customer focus
2000- now
e-commerce and borderless business activities
Balanced integration Organization perspectives
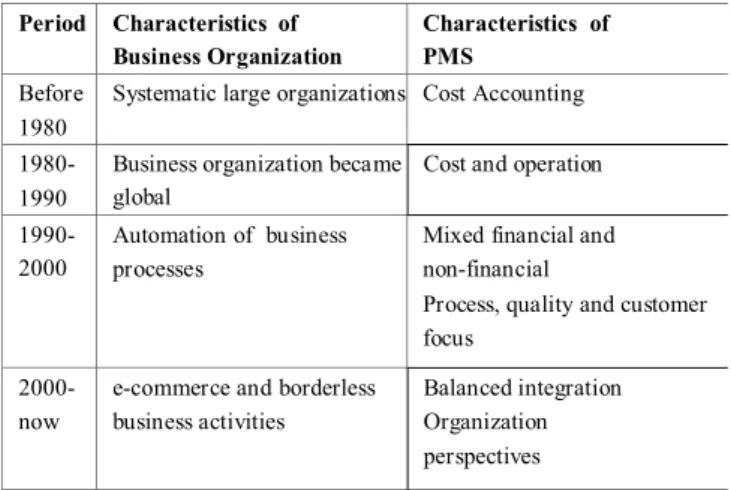
strategies [7]. The revolution of performance measurement shows a streamline of financial performance measurement to a balanced and integrated orientation [8, 9, and 10].
Table 1. Revolution of performance measurement
Performance measurement selection is a complex process due to the high variety of available frameworks in previous literature. The available performance measurement frameworks have their special characteristics and there is no integrated instruction to guide for selecting a performance measurement framework. It can be more complicated due to rapid changes in market characteristics, uncertainty in demand, product specifications, and operational tasks.
This research aims to select a fit performance measurement framework to evaluate electrical companies’ performance. Seven frameworks have been extracted from literature which are balanced score card (BSC), economic value added (EVA), total quality management (TQM), Skandia Navigator (SN), supply chain operation reference model (SCOR), logistic score board, and six sigma DMAIC process. A compariative analysis was performed based on supply chain macro processes containing supplier relationship management (SRM), customer relationship management (CRM) and internal supply chain management (ISCM).
2. LITERATURE REVIEW
Technology improvement and increasing competition in the markets notified companies about the importance of measuring their performance not only based on financial perspectives, but also based on other measures like customer satisfaction and innovation. BSC approach was developed in order to assist companies to balance the financial perspectives. Financial perspectives are proper to clarify the past events which are mainly long term categories and not suitable for critical success [11, 12]. BSC approach is proposed to help managers in order to analyze the enterprise performance not only based on financial perspective, but also three additional sections including customer, internal business, and learning and growth perspectives.
However, many companies still use financial perspective, such as EVA which is defined as the difference between an enterprise net operating income after taxes and its costs of capital [13]. This method was originally developed by Steven Steward and used by many researchers from 1990s to 2000. TQM approach can also be used to measure the performance, but it mainly focuses on quality characteristics. Quality can be categorized into eight main dimensions which are performance, features, conformance, reliability, durability, serviceability, aesthetics and perceived quality [14].
Supply chain council (SCC) has offered a model to measure the performance aiming to consider and link performance metrics and processes involved in the supply chain to increase the effectiveness and efficiency of supply chain management. SCOR model is mainly based on five processes which are plan, source, make, deliver and return, with four levels containing top level (process types), configuration level (process categories), process element level (decompose processes) and implementation level (decompose process elements) [15].
Intangible factors are not considered in financial approaches as it practiced by the Skandia Insurance Co. Ltd through special method called Skandia Navigator (SN). It focuses on the strategic intents similar to BSC [16]. The main difference between the BSC and SN is the combination of Skandia navigator’s human perspective with the other four BSC perspectives [17].
Another performance measurement approach is logistic score board developed by the logistic resources international. It is an integrated set of performance metrics containing logistic financial performance measures, logistic productivity measures, logistic quality measures and logistics cycle time measure [18].
Six Sigma DMAIC process, originated at Motorola in 1987, is the last approach investigated for the aim of this study. It is applied to find and remove the cause of defects in manufacturing supply chains. DMAIC is the acronym of define, measure, analyze, improve and control [19].
Six sigma DMAIC process applications in performance measurement can be related to its ability to decrease the variation in the manufacturing process to meet customer specifications. The effects of variation on lead time can be analyzed for supply networks where it imposes an extra inventory to supply chain [20, 21 and 22].
The variation in the supply chain can be decreased by six sigma DMAIC process resulting in less inventory and better performance. The contributors to variation in the supply chain are shown in Table 2 applicable to develop a conceptual model for the application of six sigma methodologies in supply chain improvement [23, 24].
Table 2. Contributors to variation in supply chain Demand Supply
Timing of orders Lead time to supply
Orders’ size and composition Quantity to supply
Institutional and random factors affecting demand infor mation
Quality
Data accuracy on product prices
Data accuracy
Delivery time and timings Prices
There are many frameworks providing different metrics to evaluate companies’ performance. The variety of these approaches make the performance measurement framework selection more complicated. Comparison of different performance measurement frameworks was not considered in previous studies due to the lack of specific criteria for this evaluation. This study deployed three supply chain macro processes as the main criteria to compare performance measurement frameworks. The result of frameworks comparison was used to find the fittest one to evaluate electrical companies’ performance.
3. RESEARCH METHODOLOGY
This study aims to find a performance measurement framework to measure electrical companies’ performance using a multi criteria decision making approach. An analytical hierarchical process (AHP) is deployed to achieve this goal [25]. AHP contains decision making, decision criteria and alternatives selection stages. In this study, decision making stage is performance measurement framework selection. Decision making criteria stage deploys supply chain macro processes including SRM, CRM and ISCM to evaluate alternatives [26].
The last hierarchy stage is to determine available alternative sets. In this research, alternatives include seven performance measurement frameworks BSC, EVA, TQM, SN, SCOR, L SC, and six sigma DMAIC process. Any AHP has specific pairwise comparison matrixes that compare criteria and alternatives as well. The methodology for comparing the criteria and alternatives is based on the literature and expert interview from electrical industries. A consistency test performed to show the level of consistency between the determinants, alternatives and consequently the whole AHP calculation. The final part of this study discusses the selected framework and its metrics will be developed.
4. MODEL DEVELOPMENT
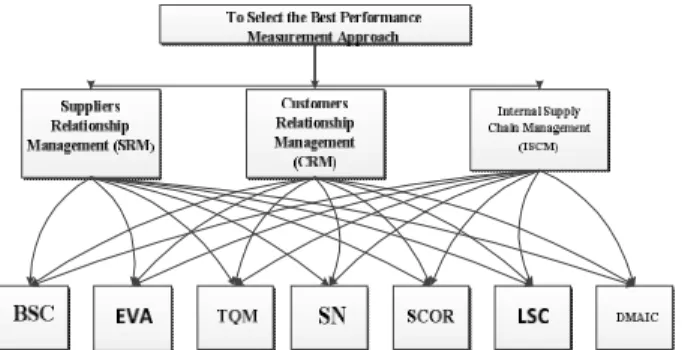
The developed model aims to select the best performance measurement framework. Selecting criteria include ISCM, SRM and CRM. The alternatives are seven performance measurement frameworks containing BSC, EVA, TQM, SN, SCOR, LSC and six sigma DMAIC process mentioned before in the literature review. Fig. 1 shows hierarchy stages.
Figure 1. AHP model to select a best performance measurement framework
5. FINDING AND DISCUSSION A. Notation
The following notations are used in AHP calculation. • SRM: Supplier Relationship Management • ISCM: Internal Supply Chain Management • CRM: Customer Relationship Management • BSC: Balanced Score Card
• EVA: Economic Value Added • TQM: Total Quality Management • SN: Skandia Navigator
• SCOR: Supply Chain Operation Reference Model • LSC: Logistic Score Card
• DMAIC: Six Sigma DMAIC Process
B. Pairwise Comparisons
Pairwise comparison is defined as a process in which the decision maker determines how well each alternative scores on criteria [26]. A standard preference scale can be used for the aim of comparison between alternatives which is shown in Table 3. This scale determined by experienced researchers in AHP for a reasonable basis to compare two alternatives. For example, if the A alternative is "moderately preferred" to the B, then a value of 3 is assigned to this particular comparison.
Table 3. Standard Preference Scale
Preference Level Numeric Value
Equally Preferred 1
Equally to moderately preferred 2
Moderately Preferred 3
Moderately to strongly preferred 4
Strongly Preferred 5
Strongly to very strongly preferred 6
Very strongly preferred 7
Very strongly to extremely preferred 8
Extremely preferred 9
It is critical to rank the criteria to calculate the overall score. The criteria pairwise comparison matrix is shown in Table 4.
Table 4.Criteria Pair Wise Comparison
Criteria SRM CRM ISCM
SRM 1 1/6 1/8
CRM 6 1 1/3
ISCM 8 3 1
The final step is calculating the row average resulted from each criterion score divided by its cumulative value and then calculating each row average. The final results are shown in Table 5.
Table 5.Determinants’ Row Average
Determinant SRM CRM ISCM Row Average
SRM 0.0667 0.04 0.0857 0.0641
CRM 0.4000 0.24 0.2286 0.2895
ISCM 0.5333 0.72 0.6857 0.6463
Total 1.0000
The next step is comparing each alternative under SRM criteria as shown in Table 6.
Table 6.Alternatives Comparison under SRM Criteria
SRM SCBS EVA TQM SN SCOR LSC DMAIC
SCBS 1 5 4 3 2 6 7 EVA 1/5 1 1/2 1/3 1/6 1/2 2 TQM 1/4 2 1 2 1/4 3 2 SN 1/3 3 1/2 1 1/2 2 3 SCOR 1/2 6 4 2 1 4 6 LSC 1/6 2 1/3 1/2 1/4 1 2 DMAIC 1/7 1/2 1/2 1/3 1/6 1/2 1
The row averages were calculated by same steps applied for criteria table. The results are shown in Table 7.
Table 7. Alternatives Comparison Row Average under
SRM Criteria SRM Row Average SCBS 0.35 EVA 0.05 TQM 0.11 87 SN 0.11 SCOR 0.25 LSC 0.06 DMAIC 0.03 Total 1.00
The next step is comparing alternatives under CRM criteria. The results are shown in Table 8.
Table 8.Alternatives Comparison under CRM Criteria
Moreover, the average row is calculated for CRM determinant as shown in Table 9.
Table 9.Alternatives Comparison Row Average under CRM
CRM Row Average SCBS 0.3174 EVA 0.0733 TQM 0.1553 SN 0.1044 SCOR 0.2731 LSC 0.0495 DMAIC 0.027 Total 1.0000
The last step of pairwise comparison is to compare alternatives under ISCM criteria as shown in Table 10.
Table 10.Alternatives Comparison under ISCM Criteria
ISCM SCBS EVA TQM SN SCOR LSC DMAIC
SCBS 1 5 5 7 2 9 6 EVA 1/5 1 4 3 1/3 3 5 TQM 1/5 1/4 1 1/5 1/9 1/2 1/3 SN 1/7 1/3 5 1 1/7 1/2 1/2 SCOR 1/2 3 9 7 1 5 6 LSC 1/9 1/3 2 2 1/5 1 2 DMAIC 1/6 1/5 3 2 1/6 1/2 1
The row average for this step is shown in Table 11.
Table 11. Alternatives Comparison Row Average under
ISCM Criteria
ISCM Row Average
SCBS 0.3812 EVA 0.1337 TQM 0.0320 SN 0.0568 SCOR 0.2764 LSC 0.0625 DMAIC 0.0573 Total 1.0000
The final step is to calculate an overall score, which is the summation of the alternative row averages and the criteria row averages. For example, the supply chain performance measurement overall score for the BSC is equal to
[0.0641 X 0.3511) + (0.2895 X 0.3174) + (0.6463X 0.3812)] = 0.3608
Table 12 shows the overall AHP calculation and the final alternative rankings.
Table 12.AHP Overall Score Alternatives Overall Ranking
SCBS 0.3608 1 EVA 0.1110 3 TQM 0.0732 5 SN 0.0743 4 SCOR 0.2743 2 LSC 0.0589 6 DMAIC 0.0474 7
C.Consistency Test
AHP is mainly based on the pairwise comparisons to determine preferences between alternatives. The normal procedure of AHP to develop pairwise comparisons is based on an interview to establish criteria or alternatives ranking based on the decision makers point of view, using the preference scales shown in table 3. When decision makers have to make lots of comparisons (i.e., three or more), the track of previous responses may get lost. It is compulsory that the rankings are valid and consistent. A preference determined for a set of pairwise comparisons needs to be consistent with another set of comparisons [28]. As priorities make sense only if derived from consistent matrices, a consistency check must be applied. A consistency index (CI) is proposed to reach this goal shown as follows [27].
CI= λmax-n/n-1 (1) Where λmax = maximal eigenvalue
The consistency ratio, the ratio of CI and RI, is given by: CR=CI/RI (2) Where RI is the random index resulted from the average CI of 500 randomly filled matrices. If CR is less than 10%, then the matrix can be considered as having an acceptable consistency. Random indexes are shown in Table 13 [28-31].
Table 13.AHP Random Index
N 2 3 4 5 6 7 8 9 10
RI 0 0.58 0.9 1.12 1.24 1.32 1.45 1.45 1.51 Consistency results are shown in Table 14.
Table 14.AHP Consistency Result Consistency
Element Value Result
Deter minants 0.0641 <0.10
SRM 0.0412 <0.10
CRM 0.0972 <0.10
ISCM 0.0944 <0.10
6. DISCUSSION AND IMPLICATION
BSC is selected as the main performance measurement framework proper to be deployed by electrical companies to evaluate their performance. This decision is followed by SCOR, EVA, SN, TQM, LSC and DMAIC based on their rankings. Table 12 shows the overall AHP calculation and can be analyzed using a different approach.
The row average related to each criteria show that the ISCM has the most significant effect on selecting the best performance measurement framework followed by CRM and SRM respectively. The ISCM high impact is caused by the scope of this study, which mainly focuses on measuring the performance within the firm. This concept is different for supplier selection cases where the cross functional performance and inter organizational performance measurement is more important compared to internal performance measurement. BSC has four perspectives which are
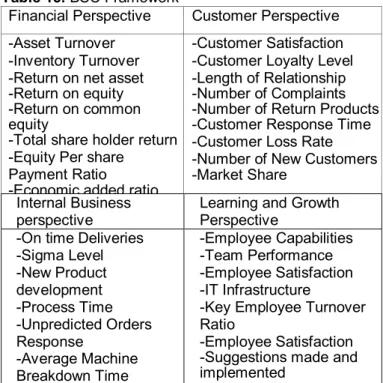
financial, customer, internal business and learning and growth and each perspective has its special metrics. Metrics for evaluating used in each BSC are varied due to the high availability of existing literature. Electrical industries have special characteristics to be considered in BSC perspectives. To find critical common performance metrics, a review was conducted based on 50 electrical case studies’ performance measurement among the available literature. The BSC developed for the aim of this study is shown in Table 15 (a) and (b).
Table 15. BSC Framework
Financial Perspective Customer Perspective -Asset Turnover
-Inventory Turnover -Return on net asset -Return on equity -Return on common equity
-Total share holder return -Equity Per share
Payment Ratio
-Economic added ratio
-Customer Satisfaction -Customer Loyalty Level -Length of Relationship -Number of Complaints -Number of Return Products -Customer Response Time -Customer Loss Rate -Number of New Customers -Market Share
Internal Business perspective
Learning and Growth Perspective
-On time Deliveries -Sigma Level -New Product development -Process Time -Unpredicted Orders Response -Average Machine Breakdown Time -Employee Capabilities -Team Performance -Employee Satisfaction -IT Infrastructure
-Key Employee Turnover Ratio
-Employee Satisfaction -Suggestions made and implemented
7. CONCLUSION
Performance measurement is a task which should be done in any company seeking for success in today’s competitive market. It helps the companies to have the benefit of measuring their performance beside suppliers simultaneously. Performance measurement can ease the strategic planning due to its ability to show how the company is doing and also the amount of its achievement based on predetermined goals. This study aimed to find the best performance measurement framework for evaluating electrical companies’ performance. Selecting the best performance measurement framework considering specific industry characteristics using supply chain macro processes was the main novelty of this study. BSC was selected based on a multi criteria decision making approach. It is critical to involve experts’ opinion in the selecting process and consequently motivated authors to use a multi criteria decision making approach compared to other approaches neglecting this. The perspectives in any BSC are same and contain financial, customer, internal business and innovation and growth perspectives. However, the metrics for analyzing these perspectives play an important role in the accuracy of performance measurement. Overall, this study proposed a BSC framework with specified metrics to evaluate electrical companies’ performance. Selecting a
framework using experts’ opinions aligned with proposing proper metric to evaluate performance can be a significant contribution for electrical companies concerning about their performance measurement. 8. REFERENCES
[1] S. Sink, P.E. (1986). Performance and productivity measurement: the art of developing creative score boards, Industrial Engineer, Vol. 1, no. , 86-90.
[2] Brady, M. K., Cronin Jr, J. J., & Brand, R. R. (2002). Performance-only measurement of service quality: a replication and extension. Journal of business research, 55(1), 17-31. [3] Neely, A., Gregory, M., & Platts, K. (1995). Performance
measurement system design: a literature review and research agenda. International journal of operations & production management, 15(4), 80-116.
[4] Caplice, C., & Sheffi, Y. (1995). A review and evaluation of logistics performance measurement systems. International Journal of Logistics Management, The,6(1), 61-74.
[5] Jammernegg, W., & Reiner, G. (1997). Customer satisfaction-oriented evaluation of quality (process) improvements. Total Quality Management, 8(2-3), 191-194.
[6] Cheung, K. L., & Hausman, W. H. (2000). An exact performance evaluation for the supplier in a two-echelon inventory system. Operations Research, 48(4), 646-653.
[7] Ittner, C. D., Larcker, D. F., & Randall, T. (2003). Performance implications of strategic performance measurement in financial services firms. Accounting, Organizations and Society, 28(7), 715-741
[8] Gomes, C. F., Yasin, M. M., & Lisboa, J. V. (2004). A literature review of manufacturing performance measures and measurement in an organizational context: a framework and direction for future research. Journal of Manufacturing Technology Management, 15(6), 511-530.
[9] Morgan, C. (2007). Supply network performance measurement: future challenges?. International Journal of Logistics Management, The, 18(2), 255-273.
[10] Kurien, G. P., & Qureshi, M. N. (2011). Study of performance measurement practices in supply chain management. Int. J. Bus. Manage. Soc. Sci, 2(4), 19-34.
[11] Kaplan, R. S., & Norton, D. P. (1996). Using the balanced scorecard as a strategic management system. Harvard business review, 74(1), 75-85.
[12] Kaplan, R. S., & Norton, D. P. (1996). Linking the balanced scorecard to strategy. California management review, 39(1). [13] Chen, S., & Dodd, J. L. (1997). Economic value added (EVA™):
An empirical examination of a new corporate performance measure. Journal of Managerial Issues, 318-333.
[14] Garvin, D. A. (1988). Managing quality: The strategic and competitive edge. Simon and Schuster.
[15] Council, S. C. Supply Chain Operations Reference Model: Overview of SCOR Version 7.0, 2005. Available online at: www. supply-chain. org (accessed 25 June 2006).
[16] Yeniyurt, S. (2003). A literature review and integrative performance measurement framework for multinational companies. Marketing Intelligence & Planning, 21(3), 134-142. [17] Bukowitz, W. R., & Petrash, G. P. (1997). Visualizing, measuring
and managing knowledge. Research-Technology Management, 40(4), 24-31.
[18] Bora, A., & Krairit, S. C. D. (2004). Developing Key performance indicators for performance controlling of a supply chain. In Proceedings of the Fifth Asia Pacific Industrial Engineering and Management Systems Conference.
[19] Lee-Mortimer, A. (2006). Six Sigma: a vital improvement approach when applied to the right problems, in the right environment. Assembly Automation, 26(1), 10-17.
[20] George, M. L., & George, M. (2003). Lean six sigma for service (pp. 117-130). New York: McGraw-Hill.
[21] Geary, S., Childerhouse, P., & Towill, D. R. (2002). Uncertainty and the seamless supply chain. SUPPLY CHAIN MANAGEMENT REVIEW, V. 6, NO. 4 (JULY/AUG. 2002), P. 52-61: ILL.
[22] Memari, A., Anjomshoae, A., Galankashi, M. R., & Bin Abdul Rahim, A. R. (2012, December). Scenario-based simulation in production-distribution network under demand uncertainty using ARENA. In Computing and Convergence Technology (ICCCT), 2012 7th International Conference on (pp. 1443-1448). IEEE. [23] McGuffog, T., & Wadsley, N. (1999). The general principles of
value chain management. Supply Chain Management: An International Journal, 4(5), 218-225.
[24] Knowles, G., Whicker, L., Femat, J. H., & Canales, F. D. C. (2005). A conceptual model for the application of Six Sigma methodologies to supply chain improvement. International Journal of Logistics: Research and Applications, 8(1), 51-65. [25] Saaty, T. L. (1988). What is the analytic hierarchy process? (pp.
109-121). Springer Berlin Heidelberg.
[26] Chopra, S., & Meindl, P. (2007). Supply chain management. Strategy, planning & operation (pp. 265-275). Gabler.
[27] Taylor III, B. W. (2005). Introduction to Management Science 8th Edition. New Jersey: Prentice Hall.
[28] Saaty, T. L. (1977). A scaling method for priorities in hierarchical structures.Journal of mathematical psychology, 15(3), 234-281. [29] Ishizaka, A., & Labib, A. (2009). Analytic hierarchy process and
expert choice: Benefits and limitations. OR Insight, 22(4), 201-220.
[30] Galankashi, M. R., Moazzami, A., Madadi, N., Roudsari, A. H., & Helmi, S. A. (2013). Supplier Selection for Electrical Manufacturing Companies Based on Different Supply Chain Strategies. Electrical Engineering.
[31] Dargi, A., Anjomshoae, A., Galankashi, M. R., Memari, A., & Tap, M. B. M. (2014). Supplier Selection: A Fuzzy-ANP Approach. Procedia Computer Science, 31, 691-700.
Izbor okvira merenja performansi lanca snabdevanja u
lancima snabdevanja električnom opremom
Masoud Rahiminezhad Galankashi, Ashkan Memari, Ali Anjomshoae, Azanizawati Ma'aram, Syed Ahmad Helmi
Primljen (17.07.2014) Recenziran (18.09.2014); Prihvaćen (01.10.2014)
Rezime
Merenje performansi igra važnu ulogu na današnjem konkurentnom tržištu zbog svog direktnog efekta na profitabilnost lanca snabdevanja. Mnogi pristupi su primenjivani za evaluaciju performansi kompanija, uključujući finansijske, operacione i balansirane okvire. Kompanije istražuju kako bi pronašle okvir merenja performansi koji im najviše odgovara usled postojanja velikog broja postojećih
pristupa. Glavni značaj u izboru okvira performansi je u njegovoj važnoj ulozi u strateškim odlukama gde mnogi faktori koji su vezani za performanse kompanije mogu da budu zapostavljeni. Zbog prirode elektrotehničkih kompanija, poput velike nesigurnosti potražnje, kratkog životnog veka proizvoda i konkurentnog tržišta, oni moraju često da procene svoje performanse. Odgovarajući okvir bi trebalo da se odredi na osnovu karakteristika ovog konkurentnog tržišta. U ovoj studiji, pristup višekriterijumskog donošenja odluka (MCDM) koristi se kako bi se pronašao odgovarajući okvir za evaluaciju performansi u elektrotehničkim kompanijama. Analitički hijerarhijski proces (AHP) se primenjuje radi izbora najboljeg okvira za merenje performansi zasnovanog na makro procesima lanca snabdevanja. Na kraju, određena je metrika performansi za izabrani okvir.
Ključne reči: merenje performansi lanca snabdevanja; okvir merenja performansi; MCDM; AHP; metrika merenja performansi