Hogan, H (2014) The Scale and Scope of Preventable Hospital Deaths. PhD thesis, London School of Hygiene & Tropical Medicine. DOI: https://doi.org/10.17037/PUBS.01776586
Downloaded from: http://researchonline.lshtm.ac.uk/1776586/ DOI:10.17037/PUBS.01776586
Usage Guidelines
Please refer to usage guidelines at http://researchonline.lshtm.ac.uk/policies.html or alterna-tively contactresearchonline@lshtm.ac.uk.
The Scale and Scope of Preventable
Hospital Deaths
Thesis submitted to the
University of London for the
Doctor of Philosophy Degree
PhD candidate: Dr Helen Hogan
Supervisor: Professor Nick Black
Department of Health Services Research and Policy,
Faculty of Public Health and Policy
3
Abstract
In 2008, the lack of a robust estimate for the proportion of patients experiencing preventable deaths in English acute hospitals was fuelling debate and hindering progress in tackling the underlying problems associated with serious patient harm. In this thesis a narrative literature review and a study of harm measures in a single acute hospital are used to guide the choice of method for a study to determine the proportion of preventable hospital deaths.
A subsequent retrospective case record review (RCRR) of 1000 randomly sampled deaths from 10 English acute hospitals found the proportion of preventable deaths to be 5.2% (95% CI, 3.8% to 6.6%) which would equate to 11,859 (95% CI 8712 to 14 983) preventable deaths per year in NHS hospitals in England, 60% of whom had a life expectancy of less than 1 year. The proportion was lower than previous estimates based on US RCRR studies but consistent with a recent Dutch study which reviewed 3,983 hospital deaths.
The majority of underlying problems in care were related to clinical monitoring, diagnostic error and drug and fluid problems, and 44% occurred during ward care. Problems were more likely to occur in surgical than medical patients (23.6% vs12.7%). Three-quarters were omissions, rather than commissions, in care and accumulated throughout the hospital episode. While there was a strong positive correlation between proportions of preventable deaths in hospitals and MRSA bacteraemia rates (r=0.73; p<0.02) there were no other significant associations with common measures of safety, including HSMR.
Improvements are needed to reduce human error and to provide better quality of care for acutely ill older people to reduce serious harm in acute hospitals. A national mortality review process, based on this study, is to be rolled out across the NHS and will provide one mechanism for monitoring progress.
4
Acknowledgments
This thesis would not have been possible without the continuous support and encouragement of my supervisor, Nick Black, for which I am extremely grateful. I appreciated the “open door” and the subtle pressure to get the job done. I would like to acknowledge the support from my advisors, Graham Neale and Jenny Neuburger, who dealt with my queries with great patience. Graham was a pioneer in the field of patient safety and will be sadly missed following his recent death. I would also like to thank the other PRISM Steering Group members, Amanda Cale, Frances Healey, Charles Vincent and Richard Thomson, without their academic input and constructive criticism this work would not have been possible. Finally, but not least, I am deeply grateful to the special people in my life who have kept me going through the difficult times and were all there to rally me to the finish line.
5
Table
of
Contents
Declaration ... 2 Abstract ... 3 Acknowledgments ... 4 List of Tables ... 9 List of Figures ... 11 List of Boxes ... 12 Abbreviations ... 13 Glossary ... 14 Chapter 1 Introduction ... 17 1.1 Context ... 171.2 Aims and Objectives ... 21
1.3 Conceptual Framework ... 22
1.3.1 Defining Harm ... 22
1.3.2 Design of a Conceptual Model for Safety and Harm Measurement ... 24
1.4 Structure of the thesis ... 30
1.5 Contribution of the candidate to the thesis ... 31
1.6 Overall contribution of the thesis to field of study ... 32
Chapter 2 Measuring Harm in Healthcare: Background ... 34
2.1 Introduction ... 34
2.2 The Development of Harm Measurement ... 35
2.3 An Exploration of Harm Measures ... 38
2.3.1 Health Service Orientated Measures ... 38
2.3.1.1 Routine Data ... 38
2.3.1.2 Incident Reporting ... 41
2.3.1.3 Morbidity and Mortality Meetings ... 42
2.3.2 Health Service and Research Orientated Measures ... 43
2.3.2.1 Retrospective Case Record Review ... 43
2.3.2.2 Global Trigger Tool ... 44
2.3.2.3 Claims Files ... 45
6
2.3.3 Research Orientation ... 47
2.3.3.1 Direct Observation ... 47
2.3.3.2 Patient Reported Harm ... 47
2.3.3.3 Case Control Studies ... 48
2.4 The Epidemiology of Harm ... 50
2.5 Key Issues in Harm Measurement ... 53
2.5.1 Scope of Harm Measured ... 53
2.5.2 Judgement of Preventability ... 54
2.5.3 Validity ... 56
2.5.4 Reliability ... 59
2.5.5 Retrospective versus Prospective Approaches ... 63
2.5.6 Content and Context ... 64
2.5.7 Denominators ... 65
2.5.8 Sampling ... 65
2.5.9 Case Mix Adjustment ... 67
2.6 Comparison of Harm Measures for the Measurement of Preventable Deaths ... 75
2.7 Conclusion ... 77
Chapter 3 Research Paper 1 ... 79
3.1 Introduction to Research Paper 1 ... 79
3.2 Research Paper 1 Cover Sheet and Copyright
...
80Chapter 4 Method ... 93
4.1 Introduction ... 93
4.2 The Pilot Study ... 93
4.3 The Preventable Incidents Survival and Mortality Study: Main Methods... 97
4.3.1 Determining Sample Size ... 97
4.3.2 Sample Exclusions and Inclusions ... 98
4.3.3 Hospital Recruitment ... 98
4.3.4 Reviewer Recruitment and Training ... 99
4.3.5 The Structured Medical Review Form ... 100
4.3.6 The Review Process ... 101
4.3.7 Approaches to Reduction of Bias ... 103
4.3.8 Ethical Issues ... 104
4.3.9 Data Entry ... 105
4.3.10 Analysis of Quantitative Data ... 106
7
4.4 Conclusion ... 108
Chapter 5 Research Paper 2 ... 110
5.1 Introduction to Paper 2 ... 110
5.2 Research Paper 2 Cover Sheet and Copyright ... 111
Chapter 6 Research Paper 3 ... 124
6.1 Introduction to Paper 3 ... 124
6.2 Research Paper 3 Cover Sheet ... 125
Chapter 7 Research Paper 4 ... 152
7.1 Introduction to Paper 4 ... 152
7.2 Research Paper 4 Cover Sheet ... 153
Chapter 8 Discussion ... 176
8.1 Introduction ... 176
8.2 Key Findings ... 176
8.2.1 Objective 1 and 2: To describe the strengths and weaknesses of current measures of patient safety for identifying harm in hospitals and compare the scale and scope of hospital harm identified by different measures of patient safety ... 176
8.2.2 Objective 3: To determine the proportion of preventable deaths, causes, contributory factors, subpopulations affected, and years of life lost in acute hospitals in England ... 177
8.2.3 Objective 4: To determine whether the proportion of preventable death across hospitals correlates with other patient safety indicators ... 178
8.3 Setting Thesis Findings in Context ... 179
8.4 Strengths and Limitations of the Research ... 181
8.4.1 Strengths ... 181
8.4.2 Limitations ... 183
8.5 Implications for the NHS ... 187
8.5.1 Implications for Clinical Safety in the NHS ... 187
8.5.2 Implications for Patient Safety Measurement ... 190
8.6 Areas for Future Research ... 197
8.7 Conclusion ... 198
8
Appendix 1. Search Strategy for Literature Review ... 219 Appendix 2. Structured Medical Review Form ... 221
9
List
of
Tables
Table 2.1 Summary of findings on patient harm from the largest international RCRR
Studies ... 52 Table 2.2 Comparison of harm measures ... 68 Table 3.1 National Reporting and Learning System’s harm grading for patient safety
incidents ... 88 Table 3.2 Description of data sources collecting information on patient safety in one
hospital and issues related to using such sources to monitor patient safety .... 89 Table 3.3 Number of incidents identified by each of the seven data sources for adult
medical and surgical patient admissions between 1.4.04 and 31.3.05 ... 90 Table 3.4 Degree of overlap between incidents identified by each data source,
April 2004 to March 2005 ... 90 Table 3.5 Numbers and proportions of incidents in each category detected by different data sources, April 2004 to March 2005 ... 90 Table 3.6 Patient administration system: infection control incident ... 90 Table 3.7 Proportion of incidents in different harm grades for each data source,
April 2004 to March 2005 ... 91 Table 5.1 Comparison of study sample and all National Health Service hospital deaths in England (2009) ... 120 Table 5.2 Comparison of the characteristics of patients who died having experienced a
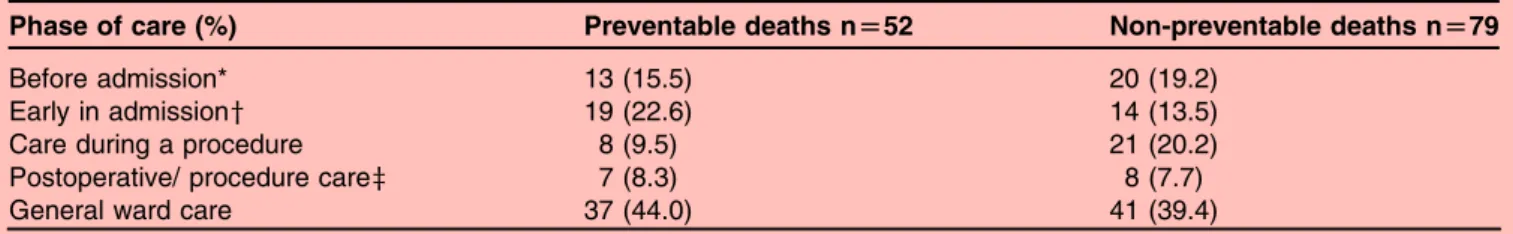
problem in care that contributed to their death with those that did not ... 121 Table 5.3 Reviewers rating of the overall quality of care received by patients ... 121 Table 5.4 Phases of care during which problem in care that contributed to death
Occurred ... 122 Table 5.5 Types of problems in care that contribute to patient death ... 122
10
Table 6.1 Comparison of problem types amongst medical and surgical patients ... 134
Table 7.1 Sources and description of eight safety measures ... 162
Table 7.2 Hospital characteristics and patient safety indicator values, 2009 ... 165
Table 7.3 Distribution of patient safety measure values across ten acute hospitals ... 167 Table 7.4 Correlations between preventable deaths and other patient safety measures 168
11
List
of
Figures
Figure 1.1 Conceptual model outlining points where harm can occur and preventative interventions focused ... 25 Figure 1.2 Thomas and Petersen’s framework for harm measures ... 26 Figure 1.3 Conceptual model outlining points where factors in the generation of
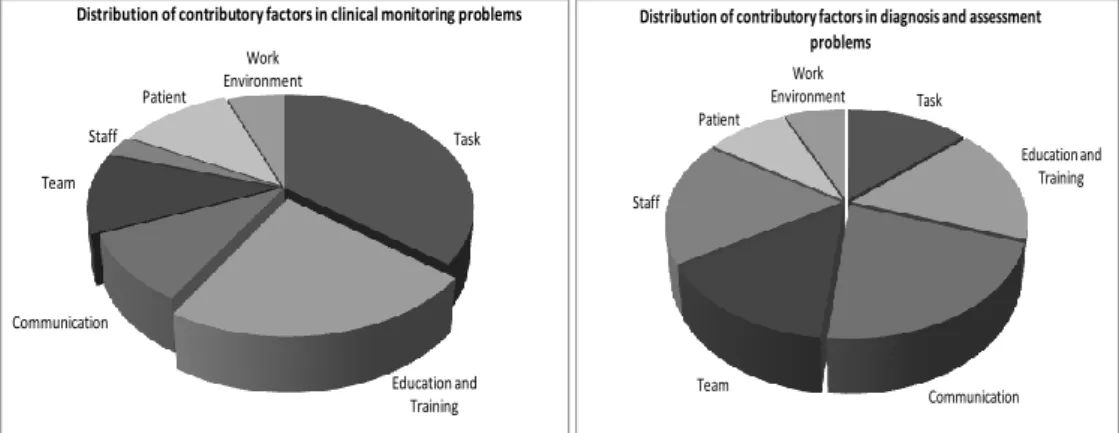
healthcare-related harm and harm itself can be measured ... 27 Figure 3.1 An approach to exploring incidents related to clinical assessment ... 91 Figure 6.1 Pie Charts showing the distribution of problem in care subtypes across medical and surgical preventable deaths ... 136 Figure 6.2 Pie charts showing the distribution of contributory factors across different
categories of problems in care ... 142 Figure 7.1 Proportion of preventable deaths across ten English acute hospitals ... 166 Figure 7.2 Scatter plot of hospital apportioned MRSA bacteraemia rates and hospital
preventable death proportion ... 169 Figure 8.1 James Reason’s Swiss cheese model of harm generation ... 188 Figure 8.2 A framework for safety measurement and monitoring ... 196
13
Abbreviations
AE Adverse Event
AHRQ Agency for Healthcare Research and Quality
CMO Chief Medical Officer
DH Department of Health
GTT Global Trigger Tool
HMPS Harvard Medical Practice Study
HSMR Hospital Standardised Mortality Ratio
ICD International Classification of Diseases
IHI Institute for Healthcare Improvement
NCEPOD National Confidential Enquiry into Patient Outcome and Death (formally
National Confidential Enquiry into Perioperative Deaths)
NHS National Health Service
NPSA National Patient Safety Agency
NRLS National Reporting and Learning System
PSI Patient Safety Indicators
QAHCS Quality in Australian Healthcare Study
RCRR Retrospective Case Record Review
14
Glossary
Acts of Commission: affirmative actions related to the active delivery of care, such as incorrect treatment or management
Active Failures: errors committed at the interface between the health professional and the patient
Acute Hospital: a hospital providing care for both elective and emergency patients across a broad range of medical and surgical specialties
Adverse Event: an unintended injury or complication resulting in prolonged hospital stay, disability at the time of discharge, or death caused by healthcare management rather than by the patient’s underlying disease process
Care Delivery Problem: a problem that arises in the process of care due to actions or omissions by staff
Clinical Technical Processes: the processes related to diagnosis and management that are targeted at the patients’ presenting problems
Complications: unexpected harm where care had been delivered to an acceptable standard and was error free, such as a drug reaction on the first dose of a new medication
Contributory Factors: underlying or intervening variables at individual, team or organisation level which lie behind the failure of processes of care
Explicit Review: case record review that uses predetermined criteria to assess processes of care
Harvard Medical Practice Study: the largest retrospective case record review study which examined 30,121 randomly selected case records from 51 New York acute hospitals in the 1980s
15
Hospital Standardised Mortality Ratio: a measure calculated from the ratio of a hospital’s observed death rate to an expected death rate derived from a regional or national average. Scores above the average are said to identify organisations with excess deaths
Implicit Review: reviews of the case records conducted without any pre-set criteria, and which use clinician judgements based on knowledge and experience to assess whether processes of care were of an acceptable standard
Latent Failure: error- provoking conditions within the organisational environment that can increase the likelihood of patient harm
NHS Outcomes Framework: a collection of national indicators used by the English Department of Health to hold the NHS to account
National Patient Safety Agency: a national agency established in the early 2000s to lead and contribute to improvements in patient safety across the NHS
National Reporting and Learning System: a national patient safety incident reporting system housed by the National Patient Safety Agency
Non-Technical Processes: processes related to the wider aspects of healthcare delivery beyond the clinical doctor- patient encounter and determined by organisational factors such as leadership, modes of communication or teamwork
Omissions: inactions such as failure to diagnose or treat
Patient Safety Incident: an unintended or unexpected incident that could have harmed, or led to harm of NHS patients
Problem in Care: patient harm resulting from:
a) Acts of omission (inactions), such as failure to diagnose or treat
b) Acts of commission (affirmative actions), such as incorrect treatment or management
16
Retrospective Case Record Review: traditionally a two-stage process consisting of an initial nurse-led screening stage followed by an in-depth review of screen positive records by a senior doctor to identify whether patients were harmed by healthcare
Service Delivery Problem: a problem associated with decisions, procedures and systems at organisational level
Summary Hospital-level Mortality Indicator: a measure derived from routine hospital data calculated from the ratio of a hospital’s observed death rate to an expected death rate derived from a regional or national average. It differs from HSMR by including all in-patient deaths and deaths within 30 days of discharge in the analysis
System-Related Harm: harm that arises from factors related to the structure or organisational aspects of care delivery
17
Chapter
1
Introduction
1.1
Context
Around 15 million people are admitted to hospital each year in England and Wales, and the majority are treated safely and discharged, satisfied with the outcome.1-2 Unfortunately, for some patients something will go wrong, resulting in harm and sometimes death. Florence Nightingale was one of the earliest figures to attempt to assess the degree of harm caused by healthcare through closely observing the outcomes of her patients. Yetit was not until after the Second World War, when new and more complex therapies were rapidly being
introduced, that consciousness began to spread amongst health professionals of the risks attached to such therapies. In 1964, Schimmel described as ‘noxious episodes’ all untoward events, complications, and mishaps resulting from diagnostic or therapeutic procedures instituted in the hospital.3 His clinical staff reported that 20% of patients receiving hospital care experienced a noxious event. Despite the gradually emerging evidence, a strong belief in technological innovation as a force for good led to a prevalent attitude amongst healthcare professionals that healthcare benefits outweighed the risks of harm.4
Rising litigation costs in the US from the 1950s onwards saw a renewed focus on the scale and scope of healthcare related harm. In California, as part of an investigation into the feasibility of a state-wide, ‘no fault’ insurance scheme, the first large-scale investigation into the proportion of such adverse events was undertaken using retrospective case record reviews (RCRR).5 The seminal Harvard Medical Practice Study (HMPS), conducted in the late 1980s, examined 30,121 randomly selected records from 51 acute hospitals in New York and for the first time established a baseline for such events.6 Over the next two decades, replica healthcare harm studies were undertaken across the developed world and, more recently, such studies have begun to emerge from the developing world.7
18
Although awareness of healthcare related harm grew steadily amongst healthcare professionals during the half century after the second World War, it was not until the publication in the US of the Institute of Medicine report, To Err is Human: Building a safer healthcare system in 1999,8 that acknowledgement of its potential scale spread to a wider community of politicians, policy makers, patients and the general public. The report estimated that between 44,000 and 98,000 Americans died each year as a result of the healthcare they received, and concluded that this harm represented the eighth leading cause of death in US hospitals. In 2000, the UK Department of Health’s (DH) Chief Medical Officer (CMO) published a review of patient safety in the National Health Service (NHS), entitled An organisation with a memory,9 in which he extrapolated figures from the US studies to estimate that between 60,000 and 250,000 patients might be suffering severe injury or death as a result of NHS care. The report indicated that settlement of the resulting clinical negligence claims cost the NHS around £400 million per year, and that the
additional hospital bed days cost as much as £2 billion annually. Furthermore, highly publicised failures such as at Bristol Royal Infirmary (high death rates following paediatric surgery)10 and Stoke Mandeville Hospital (deaths following an outbreak of Clostridium difficile),11 were leading to increasing concern that the true burden of healthcare related harm in the NHS had not been uncovered.
During the early 2000s, debate increased over the scale and scope of severe harm, and its ultimate outcome - preventable death in acute hospitals. The estimates in the CMO report had been drawn from the findings of two studies conducted in the 1980s and 1990s: the HMPS study and a subsequent study of 14,000 patient records in Utah and Colorado.6 12 A range of alternative estimates for the proportion of deaths in the NHS associated with healthcare harm were also in circulation. In 2001, the Bristol Inquiry report quoted 25,000 deaths annually.10 This figure was based on the US estimate of 98,000 deaths per year approximately adjusted for the size of the UK population. In 2004, Aylin et al cited the figure of 40,000 deaths,13 which was followed in 2005 by citation of the figure of 34,000
19
deaths in the National Audit Office report, A Safer Place for Patients: Learning to improve patient safety.14 Both of these estimates were based ona pilot RCRR conducted by Vincent et al in 1999, which reviewed the records of 1014 patients from two London hospitals.15 The accuracy of these estimates is questionable, reliant as they are on relatively small numbers of deaths in the study sample. In contrast, a Dutch RCRR undertaken in 2005 of 8,415 patient records, including nearly 4,000 deaths, found preventable harm associated with death in 4.1% of patients.16 This would equate to a figure for the NHS of 11,250 preventable deaths per year.
Although traditional RCRR studies are designed to measure the proportion of preventable harm in patients who die, they are not designed to assess the causal association between the preventable harm and the subsequent death, i.e. whether the harm caused the death. This would require the reviewer to also take into consideration factors such as the acuity of presentation, co-morbidities or typical prognosis that also have a bearing on the risk of death. A single study from the US, which examined 116 deaths across Veterans
Administration System hospitals, did consider these factors and found the proportion of preventable deaths to be 6%.17 This study also showed that the majority of patients
experiencing preventable deaths had very limited life expectancies. This was in contrast to the Institute of Medicine report which, by suggesting that US deaths caused by healthcare harm are equivalent in number to two jumbo jets crashing every day, created the impression that the problem was as likely to impact on the young as the old.8
Hospital safety incident reporting systems can offer another approach to understanding the nature of serious healthcare-related harm. The National Patient Safety Agency’s National Reporting and Learning System (NRLS) collected 6,688 reports of incidents associated with serious harm or death from acute hospitals in 2005-06, accounting for 1.3% of all reported incidents from a total of 526,599.18 A special analysis of the serious incidents associated with death identified 425 deaths that were potentially avoidable.19 Unfortunately, serious
20
under reporting occurs in such systems and this is particularly the case for harm at the severe end of the spectrum if staff fear they will be blamed.20
Following the Bristol Inquiry, the DH had put much faith in the power of publicly available comparative data on hospital mortality to identify outliers for quality and patient safety. The Hospital Standardised Mortality Ratio (HSMR) and more recently the Summary Hospital-level Mortality Indicator (SHMI), case-mix adjusted ratios of observed to expected hospital deaths, easily calculated using routinely collected hospital administrative data, were
developed for this purpose. These statistics have been used to infer that hospitals towards the higher end of the ratio distribution have higher levels of avoidable deaths, an assumption that has been questioned primarily because of the lack of rigorous evidence to back it up. In fact, there have been only four studies, all from North America and published between 1987 and 2008, that have looked at the association between HSMR and the proportion of
preventable deaths detected by case record review and none for SHMI. Across the studies, the preventable deaths were from selected specialties,21-22 diseases,23 or interventions,24 and therefore had a limited capacity to predict relationships between HSMR and preventable deaths in broader groups of patients. The studies were also limited by sample size (ranging from182-347 patients, except for one with 739 patients22) and did not analyse the
relationship at the level of individual hospitals, but as aggregated data from groups of high and low HSMR hospitals. Three of the studies either found no correlation,21-22 or a non-significant negative correlation.24 Only one study, the smallest, found a significant positive association in hospitals with a high HSMR and preventable deaths, and that was confined to patients in a single disease group (pneumonia).23 Conducting similar correlation studies in England has been limited by the lack of a reliable estimate for preventable deaths in hospitals.
In 2006, the House of Commons Public Accounts Committee commented that the ‘…lack of accurate information on serious incidents and deaths makes it difficult for the NHS to
21
evaluate risk or get a grip on reducing high-risk incidents…’,25 a perspective reiterated in 2009 by a House of Commons Health Committee which also looked at patient safety.26 This uncertainty applied not only to the numbers of preventable deaths, but also to the problems in healthcare that led to these deaths and to the subpopulations most affected. At the time there was no information available as to whether preventable deaths were occurring
predominantly in those with an already limited life expectancy, or were foreshortening lives by a substantial number of years. Since then, the publication of failings at the Mid
Staffordshire Hospitals Trust,27 has ensured that the debate around the scale of serious harm including the number of preventable deaths has remained active amongst the public,
politicians and policy makers. Clearly it is incumbent upon health services to minimise the risk to patients, and seek to implement good systems that prevent unnecessary harm, including death. Continuous debate over the numbers of preventable deaths in acute hospitals in England, and whether current measures such as HSMR and SHMI, correlate with these deaths, is at best a distraction, and at worst leads to inappropriate decisions on priority setting for improving safety. Providing a clear picture of the size and nature of safety related deaths in hospitals requires a robust multicentre study of deaths in order to develop a good understanding not only of the size and impact of the problem, but also the main causes and underlying causal factors.
1.2
Aims
and
Objectives
The overall aim of this thesis is to identify the most appropriate method for measuring severe harm, principally in regard to preventable death in acute hospitals, and to determine the proportion of preventable deaths, the nature of those deaths and how this proportion correlates with other patient safety indicators.
22
The specific objectives are:
• To describe the strengths and weaknesses of current measures of patient safety for identifying harm in hospitals
• To compare the scale and scope of hospital harm identified by different measures of patient safety
• To determine the proportion of preventable deaths, causes, contributory factors, subpopulations affected and years of life lost in acute hospitals in England • To determine whether the proportion of preventable deaths across hospitals
correlates with other patient safety indicators
1.3
Conceptual
Framework
In his 2008 report High Quality Care for All, Lord Ara Darzi identified patient experience, effectiveness of interventions and patient safety as key domains of the quality of healthcare provided in the NHS.28 This thesis is grounded in the third domain of patient safety, and focuses on the area of harm measurement.
1.3.1
Defining
Harm
There are many different ways that healthcare can harm patients, and any overarching definition has to have a broad scope if it is to be applied to a general population of adult inpatients. The Oxford English Dictionary defines harm as a ‘physical injury, especially that which is deliberately inflicted’.29Harm in the context of healthcare has been defined by the World Health Organisation/ World Alliance for Safer Healthcare as ‘harm arising from or associated with plans or actions taken during the provision of healthcare, rather than an underlying disease or injury’.30 This definition clearly links such harm to the provision of
23
healthcare, but fails to incorporate harm that arises from failures to undertake plans or actions. For the purpose of this thesis, I use a broad definition that includes any harm arising from the provision of healthcare. I further classify healthcare harm as harm due to:
• Acts of omission or inactions such as failure to diagnose or treat
• Acts of commission or affirmative actions related to the active delivery of care such as incorrect treatment or management
• Unintended or unexpected complications of healthcare: the occurrence of harm despite care that was delivered to an acceptable standard and was error free, such as an adverse drug reaction following the first dose of a new medication.
Since the HMPS, the occurrence of healthcare harm has been customarily labelled as an ‘adverse event’ (see Box 1 for definition).6 More recently, the NPSA customised this term for use in the NHS, naming harm events as ‘patient safety incidents’.31 My research uses a novel term, ‘problem in care’, to describe healthcare related harm. Its definition is designed to extend the focus on harm beyond discrete incidents, thus ensuring that it includes injury resulting from multiple omissions in care, particularly if these occur over days or weeks.
Box 1.1: Definitions of patient harm
• Adverse Event: An unintended injury caused by healthcare management rather than the patient’s disease that resulted in temporary or permanent disability, death or prolongation of hospital stay (Harvard Medical Practice Study)
• Patient Safety Incident: Any unintended or unexpected incident that could have or did lead to harm for one or more persons receiving NHS healthcare (National Patient Safety Agency)
• Problem in Care: Patient harm resulting from acts of omission (inactions), such as failure to diagnose or treat, or from acts of commission (affirmative actions), such as incorrect treatment or management, or harm as a result of unintended complications of healthcare.
24
1.3.2
Design
of
a
Conceptual
Model
for
Safety
and
Harm
Measurement
Understanding the theories underlying the generation of harm in healthcare is essential when considering the development of research into patient safety measurement. As part of
developing the Donabedian Model, a framework for measuring quality in healthcare, the physician Avedis Donabedian described healthcare organisations as having structures, processes, and outcomes.32 An organisation’s structure is the context in which care is delivered, and reflects both physical (e.g. facilities) and organisational (e.g. proportion of trained staff) characteristics. Processes are activities related to the provision of healthcare including the actions of doctors, nurses and patients, and spanning from prevention to cure. These processes are sometimes broken down into technical processes that describe how care related to diagnosis and treatment is delivered to the patient, or non-technical processes reflecting wider aspects of healthcare delivery, encompassing the interactions between people and knowledge sharing determined by organisational factors such as modes of communication, teamwork and leadership.33 Structure and processes combine to culminate in health outcomes. Harm can be considered an adverse outcome of structural and process factors within healthcare organisations.
In a paper exploring the conceptualisation of patient safety, Brown et al adapted
Donebedian’s model to show how breakdowns at each point in the framework can become part of the causal chain in harm generation (Figure 1).34 The causal chain model explains how structural factors influence clinical technical processes and thence harm mediated by intervening variables (also known as contributory factors) such as shift work, team structures or modes of communication (non-technical processes).35 This model also draws on the work of James Reason, a psychologist, who has been an influential thinker in the field of patient safety. He conceptualises a healthcare organisation as a complex system made up of the activities taking place between clinicians and patients, the organisation’s design and procedures and the influence of external factors. He describes errors that occur at the
25
interface between the clinician and the patient as ‘active failures’ and those which are related to how the organisation is run as ‘latent failures’. These ‘latent failures’ can be seen as creating the climate in which ‘active failures’ are more likely to occur.36
Figure 1.1 Conceptual model outlining points where harm can occur and preventative interventions focused
Reproduced from Brown C, Hofer T, Johal A, Thomson R, Nicholl J, Franklin BD, et al. An epistemology of patient safety research: a framework for study design and interpretation. Part 1. Conceptualising and developing interventions. Qual Saf Health Care 2008;17(3):p.160
Thomas and Petersen proposed a framework for harm measures which also builds on the work of Reason (Figure 2).37 The framework places different measures along a continuum. At one end are measures that provide information on the context in which the harm
occurred, therefore shedding light on error provoking environments or latent/ system failures. These include malpractice claims files, incident reports, and morbidity and
mortality meetings. Although such sources can provide valuable information on system-level issues, they cannot be used to determine incidence because of reporting and selection biases. At the other end of the spectrum are methods that collect information on harm prospectively, including direct observation and prospective clinical surveillance, which will be more likely
26
to identify active failures at the level of patient and practitioner. These approaches can be used to measure incidence, and are therefore better placed to allow the measurement of the impact of interventions to improve safety.
Figure 1.2 Thomas and Petersen’s framework for harm measures
Reproduced from Thomas EJ, Petersen LA. Measuring errors and adverse events in health care. J Gen Intern Med 2003;18(1):p.64.
I have combined these two models to create an overarching conceptual model for healthcare-related harm measurement, in order to inform my research (Figure 3). The proposed
conceptual framework models the causal chain of harm generation after Brown et al,34 and acknowledges that different harm measures are likely to identify different types of problems in care (system or clinical) as outlined by Thomas and Petersen.37 It extends the models proposed by these two groups by adding other safety related measures to the components of the causal chain, and categorising harm measures by health services or research orientation. Interpretation of this conceptual framework leadstothe prediction that there should be a correlation between measures related to components of the causal chain and harm.
28
The evidence linking structural factors to safety, though still limited, has been accumulating since the 1970s. It suggests that factors such as numbers and qualification levels of nursing staff,38 work scheduling for junior doctors,39 presence of hospital quality improvement systems,40 and hospital design features41 all have an impact on levels of patient harm. Amongst organisational measures, the most developed are those for evaluating safety culture. Safety culture can be conceptualised as the values, attitudes and behaviours that influence an organisation’s commitment to patient safety improvement.42 Organisation scores using safety culture measurement tools have been shown to be associated with frequency of hospital acquired infection, pressure ulcers and drug errors.43-45 Direct observation has been used to measure important intervening variables, such as teamwork, and has identified the importance of multidisciplinary team composition and knowledge sharing in harm prevention in intensive care units and surgical operating theatres.46-47 The links between clinical processes and patient harm are well established through numerous RCRR studies of harm.48
The conceptual framework can also help highlight one of the key debates in patient safety measurement; whether it is better to measure patient harm, or the underlying errors (both active and latent) that lead to that harm. Harm measurement might seem the obvious approach, responding as it does to the fundamental principle of care provision, i.e. that it causes no unnecessary injury. Its measurement can prove an effective way of gaining the attention and involvement of healthcare professionals in quality and safety improvement. This is particularly the case in systems such as the NHS, where errors can be more easily regarded as trivial, or an inevitable part of its unreliable functioning.49-50 However
measurement of harm is complex, particularly at the severe end (including death), as such events are relatively rare phenomena. Moreover, different approaches to defining and detecting harm lead to different findings. Even with the most clear cut events such as death, the debate over the use of HSMR highlights the challenges of case mix adjustment when such measures are used to compare organisations.51-53
29
In contrast, others argue that measurement of error is superior because errors are more common than harm, therefore offering greater precision in measurement.54 Furthermore, the study of errors in the processes of care, can more easily identify exactly where such care needs improving in relation to both human knowledge and skills at the clinical interface, and for system level issues.55-56 Outcome measures such as harm, being dependent on multiple variables, can be poor indicators of where to target improvement.57 However, there are a number of disadvantages of error measurement that mean it is unlikely to ever replace harm measurement as a reliable metric. Firstly, like harm, definitions of error are subject to debate. Over time there have been a plethora of definitions, from error as an underlying causal factor, to error as an event (process definition), as well as error as an outcome.58 Only in the last decade, influenced by the work of James Reason, has the process definition of error become the most commonly adopted view.59 Confusion between the different notions of error can lead to a loss of clarity over what should be measured, and against which standards (if these standards exist at all). Secondly, a focus on error rather than harm also has the potential to stigmatise staff and reinforce a culture of blame.60 Despite the evidence that system or ‘latent’ factors often underlie an individual’s error (active error), the
individual’s error is often more visible and focussed on, especially in organisations with weak safety cultures.61 Because of its multifactorial origins, attention on harm moves the safety improvement focus away from individual error towards the less stigmatising identification of system flaws.62 It also acknowledges that not all harm is caused by
underlying errors and provides an opportunity to work towards increasing the safety of care through risk reduction.63
My conceptual model is crucial in fulfilling the aims of this thesis, and will be used to direct an exploration of different measures of patient harm. In turn this will enable the
development of an understanding of which harm measure might best fulfil the requirements of a study to establish a baseline proportion of preventable death, and identify underlying
30
problems in care contributing to such deaths. It will also help identify which patient safety measures one might expect to correlate with preventable hospital death.
In this thesis the focus will be on deaths that occur during a hospital admission. Examination of hospital deaths would seem a logical approach to measuring the quality and safety of hospital care, being an easily defined outcome of such care and one held to be important by the public, politicians and clinicians alike. However, deaths occur in less than 5% of hospital admissions,64 and many of these deaths are expected, as up to 50% of the UK population will come to hospital to die.65 Outcome measures can be poor at indicating where interventions for improvement should be focused and many other factors apart from quality and safety can influence these measures, for instance differing lengths of stay and availability of alternative provision for end of life care will influence the proportions of deaths that occur in hospital.53 66
1.4
Structure
of
the
thesis
Chapter 2 presents a narrative literature review which examines the background to harm measurement, describes the most common measures, outlines the epidemiology of harm derived from these measures, looks at issues to be considered when measuring harm, and compares the performance of the different harm measures. Chapter 3 (Research paper 1) describes an exploratory study conducted in one hospital, which examined the utility of a range of information sources to provide information on patient harm. This work, in
association with the literature review, contributed to the development of the methodology for measurement of preventable deaths. Chapter 4 draws on the findings from Chapters 2 and 3 and describes the development of the methodology used in the study to determine the proportion of preventable hospital deaths and their nature. Chapters 5, 6 and 7 comprise three research papers. The first covers headline findings from my RCRR study of 1000
31
deaths across ten English acute hospitals, related to the proportion of preventable hospital deaths and their causes, the second describes in more detail the causes of preventable deaths, and the third explores correlations between hospital preventable death proportions and other measures of patient safety. The final Chapter is an overview of the main findings and discusses the limitations of the thesis, as well as opportunities for future research, along with policy and practice implications.
1.5
Contribution
to
the
thesis
I undertook the background literature review. I took the lead in the design of all studies which make up this thesis and was supported in this by the research study co-authors. I collected all data for Paper 1(Chapter 3). Dr Sisse Olsen and Dr Graham Neale acted as second reviewers for the case record reviews. Dr Frances Healey was second reviewer for the case narratives explored in Paper 3 (Chapter 6). I undertook all data analysis and was provided with statistical support by Dr Jenny Neuburger and Mr Andrew Hutchings. All co-authors of the research papers contributed to data interpretation. Professor Charles Vincent and Dr Frances Healey provided guidance on presentation of the findings in Research Paper 3 and Professor Nick Black for Research Paper 4 (Chapter 7). I produced the first draft of each research paper and made changes in response to co-authors’ and peer reviewer feedback.
The main study was funded by National Institute of Health Research (NIHR), under the Research for Patient Benefit Programme. The candidate was the Chief Investigator, and Professors Black, Vincent, Thomson, and Drs Neale and Healey were co-investigators.
32
1.6
Overall
contribution
of
the
thesis
to
the
field
of
study
My thesis examines the field of harm measurement to identify which approach is best in determining the proportion of preventable deaths in acute hospitals. Chapter 3 (Research paper 1) describes the findings when using a range of approaches to measuring harm in a single acute hospital Trust. The paper concludes that different information sources identify different patient harms, but that these are not harnessed in tandem to allow the development of a better understanding of key risk areas.
In Chapter 4, my thesis outlines the methodology behind the development and
implementation of the largest study of preventable death ever undertaken in the UK. The results of this study, including a robust estimate of the proportion for preventable death in English acute hospitals, are presented in Chapter 5 (Research paper 2). A proportion of 5.2% was found, which was lower than previous estimates based on extrapolations from US studies, but consistent with findings from a more recent Dutch RCRR study. The majority of problems in care that contributed to preventable death were related to clinical monitoring, diagnostic error, and drug and fluid problems. The study methodology has been actively drawn upon to guide the development of an approach that can be used to measure such deaths at a national level. This measure will become a new NHS Outcome Framework indicator in 2014, entitled ‘hospital deaths due to problems in care’.67
Chapter 6 (Research paper 3) presents the findings of a novel content analysis of the case narratives for each preventable death collected during the case record reviews, and reveals more detail of the nature of underlying problems in care linked to such deaths. Problems that have been previously identified, such as failure to monitor anticoagulant medication, poor management of fluid balance, and failure to adequately assess patients and to give indicated drugs, appear still to be common within the NHS, despite a number of national policies and campaigns directed at such issues over the last decade.31 68-70 The fact that around 70% of
33
such problems were related to omissions of care indicates that there are persistent failures to tackle reliability within the health service.
Chapter 7 (Research paper 4) outlines findings from an examination of the association between the proportion of preventable deaths found in acute hospitals and other safety measures including the HSMR. No significant correlations were found, with the exception of MRSA bacteraemia rates. This finding casts doubt on previous assumptions that HSMR/ SHMI measure preventable deaths. One recommendation of the Keogh Review71 of 14 NHS acute hospitals carried out in 2013 in response to quality and patient concerns, was that my colleagues and I should extend our RCRR of hospital deaths to a further 24 hospitals. Combined with the findings from the first ten hospitals, there will then be adequate statistical power to determine if a clinically and statistically significant association exists between preventable deaths identified by case record review and HSMR/ SHMI.
34
Chapter
2
Measuring
Harm
in
Healthcare:
Background
2.1
Introduction
This chapter is framed partly by my conceptual framework, and partly by drawing on previous work on specifications for quality measures.72-73 It draws on an extensive body of literature drawn from a wide ranging search strategy (see Appendix 1). The chapter begins with a brief description of the history of harm measurement. Then, guided by my conceptual framework, I identify the main measures of patient harm, reviewing current use and scope for measuring different types of harm. These measures are grouped by measurements more commonly used in hospital practice, and those with more of a research focus. There follows an overview of the epidemiology of patient harm, with a focus on findings from RCRR studies.
As harm can be regarded as an outcome indicator for poor quality care,34 the next section explores harm measurement against criteria that have been developed to assess the technical attributes of healthcare quality indicators. These criteria draw on those developed by the Institute of Medicine in the US as part of its Medicare Quality Assurance Programme, and the World Health Organisation Performance Assessment Tool for Quality Improvement in Hospitals (PATH).72-73 The harm measures are then directly compared against these criteria and each other.
The chapter concludes with consideration of which approach may be best for measurement of the scale and scope of preventable deaths in hospitals in England. The work presented in this chapter and the following chapter guided me in the choice of harm measure for a study to ascertain a national estimate of the proportion of preventable hospital deaths in England and their underlying causes.
35
2.2
The
Development
of
Harm
Measurement
Receiving healthcare can be a hazardous business for a patient. The driving force of all patient safety initiatives is to prevent patient harm as a consequence of healthcare. More specifically, patient safety can be defined as ‘…the avoidance, prevention and amelioration of adverse outcomes or injuries stemming from the processes of healthcare.’74 Attainment of such goals is dependent on identifying problems that occur in healthcare, the harm that results and their frequency. Florence Nightingale and later, Ernest Codman, a 19th Century US surgeon, can be seen as the founders of the modern safety measurement movement. Both took an interest in the outcomes of healthcare interventions, particularly in the numbers of patients who died following such interventions, and the causes of those deaths. However, it was the emergence of peer review organisations in the US from the 1970s, combined with a growing interest in establishing the contribution of hospital related harm, that really
stimulated the development of harm measurement.5 75 Retrospective methods for analysing the contents of case records emerged and became formalised as the RCRR approach, traditionally a two stage process consisting of an initial nurse-led screening stage followed by an in-depth review by a senior doctor of screen positive records. Researchers from Boston, when designing the first large scale epidemiological study based on RCRR, the HMPS, built on these foundations; they improved reliability by introducing a structured review form, systematic training of reviewers, and a proportion of double reviews at the screening and full record review stages. Over 50 years later, the RCRR remains the
internationally recognised method for the measurement of patient harm in hospital settings.
In the UK, the traditional forums for examining patient harm were Mortality and Morbidity meetings, principally run amongst surgical specialties. In the 1930s, the first national Confidential Enquiry was established, with the aim of identifying problems in care associated with maternal deaths in a more systematic fashion.76 Many more national
36
confidential enquiries were introduced, including the National Confidential Enquiry into Perioperative Deaths (NCEPOD) in 1986.77
Over this period, growing concern aroused by increasing litigation in the NHS led to the development of hospital risk management programmes, which had already successfully reduced the number of health-related legal claims in the US.78 Such programmes specified the need for an incident reporting system similar to those used to improve safety in the high risk industries of aviation, nuclear power, and oil.79 In An organisation with a memory, published in 2000, the CMO for England exposed the scale of harm in the NHS and put forward a national programme for its amelioration.9 One specific action was to set up a national incident reporting system, and the NRLS was established in 2004. It was to be run by a new agency, the NPSA. The hope was that the NRLS would initiate a step change in learning from harm. Much effort was put into promoting openness about error and patient harm in NHS organisations which, in turn, it was hoped would lead to good reporting rates.31 New mechanisms were devised to disseminate learning and ensure that recommendations were acted upon. The NRLS drew on information fed in from local reporting systems, as well as independent NHS staff reports, via a web-based portal. Although incident reporting has gradually increased over the last decade, reaching a total of just over a million reports made by 2012/13, analysis of reporting patterns indicates persistent under-reporting. Combined with the lack of denominators, the result is that the utility of this source in providing an accurate picture of harm in the NHS is limited.80-81
The latter half of the 20th Century proved a fertile period for innovation in safety
measurement. James Reason’s highly influential work exploring the nature of error and harm from a psychological perspective was instrumental in influencing how harm is
conceptualised and investigated.59 Interest in organisational culture and its influence on the proportion of errors and harm has led to a burgeoning of approaches to evaluating safety culture by surveys or direct observation within hospitals.44 82 The addition of questions on
37
the witnessing of harm and incident reporting to the annual NHS staff survey acknowledged the patient safety intelligence held by NHS frontline staff. The emergence of new dangers, such as healthcare acquired infections (e.g. MRSA or Clostridium difficile) have led to the establishment of new monitoring systems to track incidence and promote a sense of urgency in addressing these serious problems.83
In the last decade, there has been a movement towards developing a more systematic understanding of patterns of mortality as part of a suite of approaches that can be used to identify preventable harm and other quality failings across hospitals and, in doing so, focus improvement efforts.84-85 Death statistics were first published over one hundred years ago, and have appeared intermittently in the public domain since then.76 Following the
Government’s increased interest in the potential of these statistics to benchmark hospitals and provide an early warning system for poor care, The Dr Foster organisation began to publish comparative HSMRs for all acute hospitals in England from 2002.86 Debate has continued since the introduction of this measure as to the validity of these estimates, and the nature of the ‘excess deaths’ identified, in terms of just how many of these are actually preventable. With the emergence of reports of hospitals gaming the system, and research indicating that many other factors apart from the quality and safety of patient care have an impact on the value of these statistics, calls have been made to abandon the use of HSMR.51 87
Drawing on the work of the US Institute for Healthcare Improvement88 and the UK’s Modernisation Agency,89 the NHS Institute for Innovation and Improvement has subsequently advocated the use of case record based mortality reviews for identifying patient harm and focussing safety efforts.90 This approach was also recommended by NHS national safety campaigns in England and Wales.69 85 Furthermore, the need to better understand their own fluctuations in HSMRs has generated bottom-up momentum within hospitals to expand the review of deaths beyond Mortality and Morbidity meetings. The
38
differential impact of these forces has resulted in the emergence of a variety of approaches to the mortality review process. Morbidity and Mortality meetings, RCRR, incident reporting and HSMR have emerged as the main approaches to measuring serious healthcare-related harm in the UK. The next section describes these measures and others in common use in more detail, including an exploration of their scope.
2.3
An
Exploration
of
Harm
Measures
Harm measures can be divided into those that have been developed for use in a health service setting, and those that are currently more frequently used in patient safety research. Some measures, such as RCRR, analyses of claims and inquest records, and prospective surveillance span both spheres and others are likely to move from research into the health services over time. Different measures are likely to identify different types of error or harm.
2.3.1
Health
Service
Orientated
Measures
2.3.1.1 Routine Data
Routine data must be collected by hospitals as part of corporate resource management, and therefore provide a cheap and easily accessible source of information on hospital activity. The utility of the data can be enhanced through links with other data sources such as Office of National Statistics (ONS) mortality data. There are three main harm measures derived from routine data: the 41 ICD-10 diagnosis codes for adverse events and misadventures, standardised mortality ratios and Patient Safety Indicators (PSI). Such measures can provide information on harm at individual consultant, department or hospital levels, as well as for different patient subgroups.91 However, only standardised mortality ratios are used as an indicator of safety in today’s NHS.
39
The 41 adverse event and misadventure codes are primarily limited to surgical and obstetric harm, with the codes identifying problems during and after procedures or complications related to devices, grafts or foreign bodies. None of the codes relate specifically to death. One English study of hospital episode statistics from between 1999-2003 and covering over 50 million episodes of care found at least one of these codes in 2.2% of all admissions.13 A similar study from Australia found the codes in 4.75% of admissions.92
In the US there has been much more interest in developing indicators of patient safety from routine data than in the UK, which probably reflects the better quality and depth of coded activity information available. Early on, attention focused on deriving case mix adjusted measures of hospital mortality using sophisticated algorithms that standardised for age, deprivation, gender, urgency of admission, co-morbidities and diagnosis. Professor Brian Jarman and his team at Imperial College developed the first such measure for use in the UK, the HSMR, in 1999. 93 The measure was calculated from the ratio of a hospital’s observed death rate to an expected death rate derived from the national average. Values above 100 are interpreted as ‘excess deaths’ with the assumption that at least some of these deaths are preventable. Linkage between hospital administrative data and the Office of National Statistics data also allows inclusion of deaths within 30 days of discharge.
In the 1980s, cardiothoracic surgeons in New York were the first medical specialists to make their death rates, at individual surgeon level, available to the public.94 Since then there has been increasing international political interest in the use of such data for hospital
performance management and benchmarking.95 The UK Government believed publication of league tables for hospital mortality rates would lead to the earlier recognition of problems with hospital safety, and avert future scandals similar to the one uncovered at Bristol Royal Infirmary.76 Marshall et al, in their review of the impact of publicly released mortality data in the US found that publication of such information did lead to changes, both in the processes and outcomes of care; responses being driven by factors such as sensitivity to
40
public image and the legal risk posed by underperforming doctors.94 A subsequent review of outcomes following feedback of mortality data to cardiothoracic surgeons in England, also found a reduction in mortality from cardiac surgery.96 However, other studies have found little or no impact of such information.97 Smith highlighted that there were also a range of unintended consequences as a result of publishing such data, including measure fixation, tunnel vision, misinterpretation and gaming.98 Like other summary outcome measures, HSMR is limited in its ability to indicate where resources for improvement should be focused. To date, HSMRs continue to be used for benchmarking hospitals in England alongside the SHMI, a measure similar to HSMR whose calculation is based on a broader range of in-hospital deaths and also takes into account deaths within 30 days of discharge. More recently, the Care Quality Commission, the national organisation charged with ensuring quality and safety standards are maintained in NHS organisations, has commenced monitoring of disease-specific mortality ratios. The measures are being used as triggers for further investigations of hospital practice.
An alternative approach to harm measurement, again largely developed in the US, has been to use signal or indicator codes known to be linked to hospital harm.99 The algorithms for PSI are created by combining primary and secondary diagnoses with procedure codes. Sophisticated systems can identify those diagnoses present only after admission.100 The first indicators focused on specific causes of harm, such as hospital acquired infection and drug errors.101-102 In the 1990s, Iezzoni et al in the US broadened the scope to 27 indicators including post-operative haemorrhage, post-operative pneumonia, sepsis and wound infection as part of the Complications Screening Programme Study.103 Building on this work, the US Agency for HealthcareResearch and Quality (AHRQ) created a suite of PSIs for use in inter-hospital comparisons. Again, the majority of PSIs are designed to identify complications following surgical procedures and obstetric trauma rather than medical harm, as more of the codes used in these specialties are clearly linked to harm.104 Two PSI codes look for potentially avoidable deaths: ‘failure to rescue’ includes deaths per 1,000 patients
41
with specified treatable complications of care (e.g. pneumonia, sepsis, gastrointestinal bleeding) develop during hospitalisation, and ‘deaths in low mortality diagnosis related groups’ includes in-hospital deaths per 1000, in patients with an admission diagnosis that has a less than 0.5% expected mortality. Interest in using PSI is developing in the UK, and some initial work has been done to adapt the algorithms to make this possible.105
Harm identified by adverse and misadventure codes or patient safety algorithms is more likely to be related to acts of commission rather than omissions, and clinical rather than system-based. The introduction of the electronic patient record holds promise for more sophisticated data linkage, and measurement of a wider range of harms using routine data.106
2.3.1.2 Incident Reporting
Incident reporting systems encompassing the reporting, collating and learning from safety incidents were initially designed to identify specific, usually rare, events like blood
transfusion reactions,107 or problems occurring in the high risk settings of anaesthetic rooms or intensive care units.108 The UK was the first country in the world to develop a national, voluntary, confidential incident reporting system in 2004.9 Other countries now have similar systems, but none on the scale of the NRLS. Reports to the NRLS provide descriptive details of the incident, contributory factors and mitigating actions along with an assessment of the degree of harm. Such systems are able to shed light on harm as a consequence of system factors such as low staffing levels, as well as those with a clinical origin, but do tend to pick up more harm linked to acts of commission. A national system is particularly useful for identifying rare harms and high risk areas, and for tracking responses to interventions that address these problems over time.109
Although the number of reports has increased steadily since its inception, patterns of reporting have remained similar with two-thirds of reports being no-harm incidents. Falls remain the most common type of incident reported, at approximately 30%.18 Less than 0.1%
42
of reports relate to a death.110 Analysis of trends in patient safety incident reporting to the 46NRLS, shows that hospitals with the highest reporting rates overall (in the top 25%) report fewer incidents linked to no-harm and falls as other types of incident reports take their place. Higher reporting rates are considered to be a feature of a positive safety culture.111 However, across all organisations, doctors report fewer incidents than nurses do, leading to an under representation of incidents linked to clinical diagnosis, assessment and management.112-113
2.3.1.3 Morbidity and Mortality Meetings
In the early 20th century, Ernest Codman, an American surgeon, began to keep records of outcomes following surgery, documenting errors and subsequent harm. This approach developed into the modern day Mortality and Morbidity (M&M) meetings. M&M meetings are the traditional forums for discussing and learning from unexpected deaths or serious complications that occur in surgical and anaesthetic specialties, and have been a prerequisite in NHS hospitals hosting surgical training programmes since the 1960s.114 Increasingly, meetings to review deaths have been adopted by other specialties, attracting participation from the wider multidisciplinary team and, more recently, reframed as an approach to pinpoint patient safety risks in healthcare provision.115
The meetings are a potentially rich source of information on serious harm, especially when post mortem findings are also available. A systematic review has shown that up to 25% of post mortems reveal an unsuspected principal diagnosis, or primary cause of death,
providing evidence of missed diagnoses.116 With the decline in frequency of post mortems, this valuable source of learning is being lost.117 Although there is potential to collect information on system-related harm as well as clinical harm, to date there has been little systematic collection and analysis of this information. Recent initiatives have looked to standardise the process of case selection, analysis and feedback, in an effort to improve institutional learning alongside educational and peer review elements.118
43
2.3.2
Health
Service
and
Research
Orientated
Measures
2.3.2.1 Retrospective Case Record Review
The HMPS was the first rigorous application of the RCRR method. The study reviewed 30,121 randomly selected records from hospitals across New York State; it was designed to investigate the epidemiology of healthcare related harm and to build on the findings from earlier smaller studies that had used non-random samples. Traditionally the method consists of a nurse-led initial screening process followed by a detailed clinical review by one or more senior physicians. Doctors are asked to make judgements as to whether harm occurred as a result of healthcare rather than a patient’s own illness, the degree of harm, and its
preventability. The rich material found in the record can provide the reviewer with a picture of care from admission through to discharge, in addition to information on the context in which care was delivered, and other contributory factors. The technique uses implicit review, whereby reviews of the case record are conducted without any pre-set criteria, and use clinician judgements, based on knowledge and experience, to assess whether processes of care were of an acceptable standard.
Seen as an approach that can shed light on a broad array of harms, especially those at the more severe end of the spectrum, those generated by the actions of doctors and those caused by omissions in care which are difficult to identify using other measures, it has often been used as the ‘gold standard’ against which other measures are compared. However, case record content is more likely to contain information on technical aspects of care, encompassing processes related to diagnosis and management that are targeted at the patient’s presenting problems. Limited information on non-technical aspects of care which relate to the way care is delivered at the clinician-patient interface and on the organisational context in which it is delivered make it more likely that reviews will identify problems related to an individual’s actions as opposed to those due to underlying system failure.119-120
44
Confidential Enquiries can be seen as a form of implicit review designed to determine if adverse outcomes, particularly serious harm and death, were associated with the processes of care delivery for particular specialties or procedures. Some enquiries look at all deaths within a specialty, such as obstetrics, whilst others will undertake themed reviews. In recent years the NCEPOD has undertaken investigations into deaths following in-hospital cardiac arrest, deaths in older patients, and deaths as a result of acute kidney disease.121-123 The aim of these investigations is to make recommendations that will address identified problems, and in so doing will improve safety. These studies can be useful for generating hypotheses around the nature of preventable mortality and key contributory factors that can be
subsequently tested. Wider generalisations can be limited by a lack of denominator data and controls.77
2.3.2.2 Global Trigger Tool
Trigger Tools are a form of explicit review in which sentinel events or ‘triggers’ linked to harm, are pre-specified in a list which is then used to screen a case record. The approach originated to address concerns that traditional RCRR was too resource intensive, both in terms of review time and the requirement for senior doctors to undertake assessments. In the 1970s, Jick et al first developed a pre-determined list of sentinel words or conditions
associated with medication harm that could be used to find high risk records for further more extensive review.124 Subsequently, Classen et al used this trigger list to search electronic patient records. 125 Under the auspices of the US Institute of Healthcare Innovation (IHI), Rozich went on to develop a tool which could be applied to a wider range of harms, and named it the Global Trigger Tool (GTT). 126-127
Since its introduction, use of the GTT has spread to a number of developed countries including the UK, and new trigger lists have been developed for use in subsets of patients including those in intensive care or children, along with flexibility for customisation to suit