ISSN: 2302-9285, DOI: 10.11591/eei.v8i1.1442 30
FACTS device installation in transmission system using whale
optimization algorithm
Irham Syafiq Shahbudin1, Ismail Musirin2, Saiful IzwanSuliman3, Afdallyna Fathiyah Harun4,
Sharifah Azma Syed Mustaffa5, Hadi Suyono6, Nor Azura Md Ghani7
1,2,3Faculty of Electrical Engineering, University Teknologi MARA, 40450, Shah Alam, Selangor, Malaysia 5College of Engineering, Universiti Tenaga Nasional, Kajang, Selangor, Malaysia
6Faculty of Engineering, Brawijaya University, Jl. MT. Haryono, No. 167 Malang, 65145
East Java, Indonesia
4,7Faculty of Computer and Mathematical Sciences, Universiti Teknologi MARA, 40450
Shah Alam, Selangor, Malaysia
Article Info ABSTRACT
Article history: Received Sep 30, 2018 Revised Nov 19, 2018 Accepted Dec 24, 2018
As the world is progressing forward, the load demand in the power system has been continuously increasing day by day. This situation has forced the power system to operate under stress condition due to its limitation. Therefore, due to the stressed condition, the transmission losses faced higher increment with a lower minimum voltage. Theoretically, the installation of the Flexible AC Transmission System (FACTS) device can solve the problem experienced by the power system. This paper presents the Whale Optimization Algorithm for loss minimization using FACTS devices in the transmission system. Thyristor controlled series compensator (TCSC) is chosen for this study. In this study, WOA is developed to identify the optimal sizing of FACTS device for loss minimization in the power system. IEEE 30-bus RTS was used as the test system to validate the effectiveness of the proposed algorithm.
Keywords: FACTS devices Loss Minimization TCSC
Voltage Enhancement
Whale Optimization Algorithm Copyright © 2019 Institute of Advanced Engineering and Science. All rights reserved. Corresponding Author:
Irham Syafiq Shahbudin,
Faculty of Engineering, University Teknologi MARA, 40450, Shah Alam, Selangor, Malaysia
Email: [email protected]
1. INTRODUCTION
In recent years, the power system has experienced an increasing demand in most parts of the world. This situation is expected to be more critical in the foreseeable future [1]. The growing demand has affected the transmission line loss as well as the system’s voltage. One of the action can be considered in solving this problem is to build new power plants to increase power generation. However, due to some limitations such as the cost, land acquisition and environment, this solution is irrelevant [2].
In the last decade, flexible alternating current transmission system (FACTS) devices have been widely used in energy utilization, demand control, voltage stabilization reactive power compensation and power factor correction [3, 4]. FACTS devices is an electronic device that has higher controllability in power system [5]. N.G Hingorani introduced the concept for this device in [1]. Normally, FACTS device will act as a power network controller which will decrease the heavily loaded lines hence increasing its loadability. Simultaneously, this action will enhance the security and stability of the power system network [6]. Additionally, FACTS devices can also enhance the power transfer capability in the existing line. Without involving any modification on the existing generation or switching operation in the network, the power flow of the network can be controlled [7]. However, to gain benefits of utilizing FACTS devices, the installation of FACTS must be at a suitable location with optimal sizing.
Technically, there are three types of FACTS devices, which are series, shunt, combined series-shunt and combined series-series compensator devices [8]. Series controlled FACTS devices consists of a capacitor that introduces voltage in series with the transmission line. Thyristor controlled series capacitor (TCSC) and Static series synchronous compensators (SSSC) are examples of series-controlled FACTS devices. Shunt controllers consist of variable impedance device such as reactor that will produce current in series with the line. Static VAR Compensator (SVC) is one of the shunt controlled device [9]. The combined series-shunt controllers used the series controller to produce current while the shunt controllers are used to produce voltage. Examples of this type are Unified power flow controller (UPFC) and Thyristor controller phase shifting transformer (TCPST) [10].
In this study, the objective is to minimize the active power loss in te transmission network. With the installation of TCSC, the objective of this study can be achieved. Comparing to other FACTS devices, TCSC has an exceptional performance where it offers smoother and flexible control of the line impedance [11]. TCSC also has the fastest response time. Several methods have been used to obtain the optimal value of TCSC in the power system. Application of artificial intelligence (AI) has been widely used in this particular section. Besides finding the value of TCSC, the optimal placement of the TCSC has also been solved using AI methods. In [12], Particle Swarm Optimization (PSO) is used to identify the optimal placement of the FACTS device. PSO algorithm also is applied to determine the optimal sizing of SVC to minimize the transmission line losses [2]. Bacterial Foraging Optimization Algorithm (BFOA) has proven to be an effective algorithm to enhance the voltage profile and minimize the transmission losses in [6]. At present, one of the latest optimization technique is Whale Optimization Algorithm (WOA). This method imitates the way humpback whales’ hunts, known as bubble-net feeding method [13]. Due to their intelligence, humpback whales will encircle their preys which are small fishes by creating distinctive bubbles along a circle to avoid them from leaving and then they will swim toward the surface to feed on their victims.
This paper presents WOA technique for transmission line losses minimization in a power system by the installation of TCSC. The effectiveness of this method is compared to the EP method to validate its robustness. The IEEE-30 bus RTS is used as the test system for FACTS devices installations.
2. THYRISTOR CONTROLLED SERIES COMPENSATOR (TCSC)
TCSC is series-controlled capacitive reactance. TCSC has the ability to enhance the power flow and transient, thus providing dynamic stability [14]. The existence of TCSC provides the capability of controlling the overall effective impedance of the transmission line by the addition of a capacitive or inductive reactance consistently [15]. Figure 1 shows the series reactance of TCSC connected between bus i and j [16].
Figure 1. Modelled diagram of TCSC The value of reactance of TCSC as follows [9]:
TCSC LINE ij X X X (1) LINE TCSC TCSC X X (2)
Whereas: Xij=Line reactance where the location to install TCSC TCSC X =Reactance TCSC located TCSC =Compensation degree of TCSC LINE X =Value of impedance The constraint limit for TCSC is given by (3):
LINE TCSC LINE X . X X . 08 02 (3)
Before installing the TCSC, the placement has to be first determined. TCSC is suitable to be installed on the weakest buses and heavily loaded area to reduce the stressed condition experienced by the system. By using the static voltage stability index (SVSI), the location of the weakest bus can be determined. From [17], the weakest bus in the system is bus 26 while line 25-26 is the weakest line. Therefore, line 25-26 is the most suitable line to install TCSC.
3. METHODOLOGY
This section explains the research procedure based on WOA for FACTS installation in IEEE 30-bus RTS.
3.1. Pre-optimization
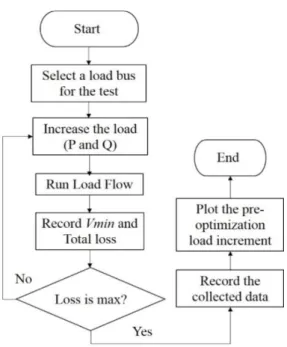
Before the execution of the optimization process, the pre-optimization process is performed to initialize the value of the minimum voltage and losses for the system under the worst condition. At this condition, the values of the active and reactive power load are increased at the weakest bus. Figure 2 illustrates the flowchart of the pre-optimization process.
Figure 2. The flowchart diagram of pre-optimization process
Step 1: A load bus is selected for the pre-optimization process. Step 2: The active and reactive power load are increased. Step 3: Run the load flow.
Step 4: The loss value is recorded.
Step 5: Step 2 until Step 4 isrepeated until the maximum load is achieved. 3.2. Evolutionary programming (EP)
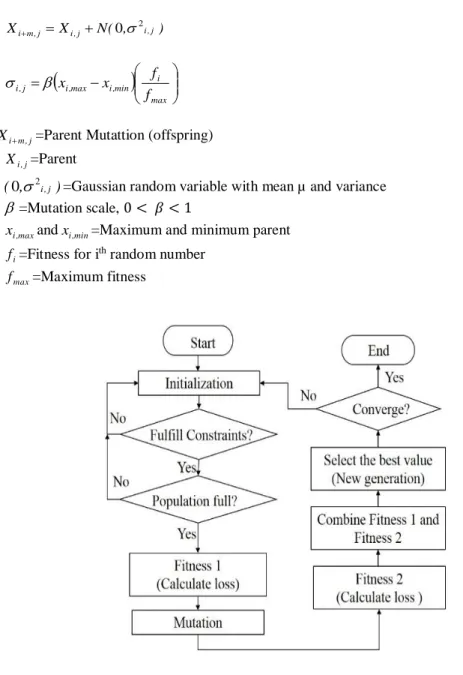
Evolutionary programming (EP) is one of the oldest optimization technique, which has been used widely in the complex problem in electrical power system [18]. The EP process consists of initialization, fitness calculation, mutation, combination, selection, new generation and convergence test. In this research, the EP has been used to determine the value of TCSC to solve for loss minimization and voltage enhancement. Figure 3 illustrates the flowchart of the EP method to achieve the value of minimum voltage and losses.
Step 1: Initialization: During this process, the number of XTCSCwas generated randomly up to 20 individuals to form a population. The number of generated individuals must be within the constraint as given in (3).
Step 2: Fitness 1: This process calculates the fitness value using the random number generated during the initialization process. The value of XTCSC is used to calculate the value of transmission losses for fitness 1. This can be done by running the load flow process.
Step 3: Mutation: The Gaussian Mutation Technique is applied for offspring calculation. The offspring are generated from the selected parents. The formula for this calculation are given in (4) and (5):
) , ( N X Xim,j i,j 02i,j (4)
max i min , i max , i j , i f f x x (5)where: Xim,j=Parent Mutattion (offspring) j , i X =Parent ) ,
(02i,j =Gaussian random variable with mean µ and variance =Mutation scale, 0 < 𝛽 < 1
max , i
x andxi,min=Maximum and minimum parent i
f =Fitness for ith random number max
f =Maximum fitness
Figure 3. EP flowchart for optimal
Step 4: Fitness 2: The value obtained from mutation is used to calculate new transmission loss and minimum voltage for fitness 2 based on the new value of XTCSC.
Step 5: Combination: The population of offspring and parents, which are fitness 1 and fitness 2 are combined.
Step 6: Selection: In this process, the top individuals will be ranked by the best fitness.
Step 7: Convergence Test: when the losses and minimum voltage is achieved, and the iteration reached its maximum, the process will stop.
3.3. Whale Optimization Algorithm (WOA)
WOA analyzes humpback whale’s hunting method and uses it as an optimization process. The bubble-net attacking method is the main method used in this algorithm. Spiral updating position, search for prey, and
shrinking encircling mechanism are three types of search agent appllied for this method. Each of the methods has a different condition and equations. Figure 4 shows the flowchart diagram of WOA.
Figure 4. The flowchart diagram of WOA
Step 1: Initialize the parameter: The first step is the initialization of the parameters to generate random numbers. The random numbers represent the value of XTCSC to be injected into the line data. The parameters are the same
for both objective functions. Parameters for WOA as shown in Table 1.
Table 1. Parameters for WOA
Parameters Values N 20 Max iteration 100 Dim 1 Upper boundary, ub 0.076 Lower boundary, lb -0.0304 p Random number [0,1]
Step 2: Fitness: In this step, fitness values will be calculated and assigned as search agents using the generated random numbers. The best search agent is defined based on fitness.
Step 3: Obtain the initial best search agent based on calculated fitness, X*.
Step 4: Check the parameter, p, if p<0.5, continued, otherwise Step 8 is implemented.
Step 5: If |A| < 1, the position of current search agent is updated using encircle the prey equation given by (6).
t X
t X C D (6)where: D=the distance of the ith whale to the prey
X =position vector of the best solution
Step 6: If |A| ≥ 1, a new search agent is calculated, and the position is updated using search for prey technique given by (7).
t X A DX 1 rand (7)
where: Xrand
Step 8: The position of the current search agent is updated using spiral updating position given by (8).
t D'e cos
l X
tX 1 bl 2 (8)
where: D=the distance of the ith whale to the prey
b=constant for defining the shape of the logarithmic spiral Step 9: The results are produced once the stopping criteria have been met.
4. RESULT AND DISCUSSION
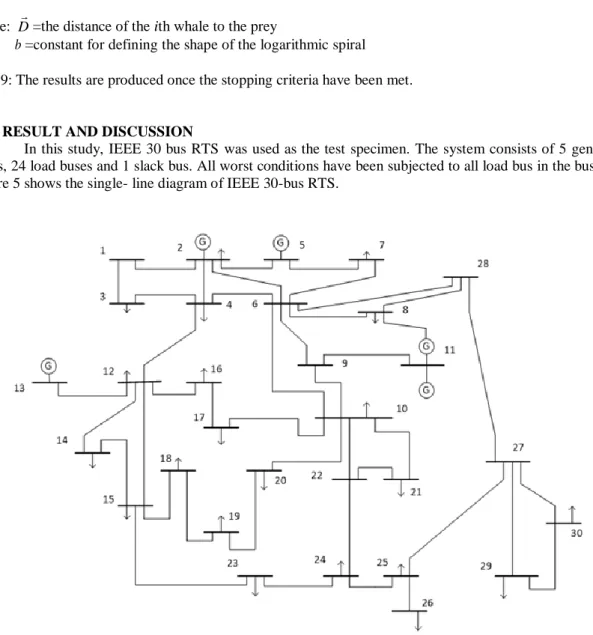
In this study, IEEE 30 bus RTS was used as the test specimen. The system consists of 5 generator buses, 24 load buses and 1 slack bus. All worst conditions have been subjected to all load bus in the bus data. Figure 5 shows the single- line diagram of IEEE 30-bus RTS.
Figure 5. IEEE 30-bus real test system
The proposed algorithm was implemented on IEEE 30 bus RTS. 3 cases have been considered, namely: Case 1: Pre-optimization (before installation of TCSC)
Case 2: Losses minimization with TCSC installation using EP Case 3: Losses minimization with TCSC installation using WOA 4.1. Case 1: Pre-optimization (without installation TCSC)
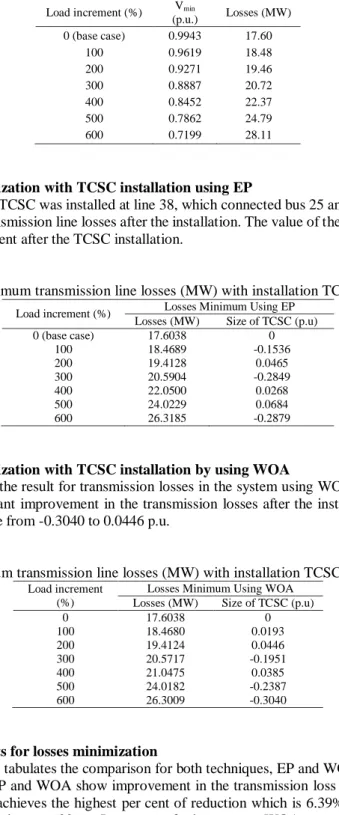
In the pre-optimization process, bus 26 was chosen for load increment due to its lowest maximum loadability compared to other buses in the system [16]. The active and reactive power load was increased slowly from 0% until it reaches its worst case, which is 600%. The value of losses for each increment is recorded. The result of pre-optimization is tabulated in Table 2. From Table 2, it can be observed that the minimum voltage for the system decreases while the transmission line losses increase as the load at bus 26 is gradually increased. The highest losses happened at the load increment of 600% with the value of 28.11 MW.
Table 2. Result for pre-optimization
Load increment (%) Vmin
(p.u.) Losses (MW) 0 (base case) 0.9943 17.60 100 0.9619 18.48 200 0.9271 19.46 300 0.8887 20.72 400 0.8452 22.37 500 0.7862 24.79 600 0.7199 28.11
4.2. Case 2: losses minimization with TCSC installation using EP
As stated in [15], TCSC was installed at line 38, which connected bus 25 and 26. Table 3 tabulates the results obtained for the transmission line losses after the installation. The value of the transmission line losses is reduced for all load increment after the TCSC installation.
Table 3. Minimum transmission line losses (MW) with installation TCSC using EP
Load increment (%) Losses Minimum Using EP
Losses (MW) Size of TCSC (p.u)
0 (base case) 17.6038 0 100 18.4689 -0.1536 200 19.4128 0.0465 300 20.5904 -0.2849 400 22.0500 0.0268 500 24.0229 0.0684 600 26.3185 -0.2879
4.3. Case 3: losses minimization with TCSC installation by using WOA
Table 4 tabulates the result for transmission losses in the system using WOA. It can be observed that the results show a significant improvement in the transmission losses after the installation of the TCSC. The optimal size of TSCS range from -0.3040 to 0.0446 p.u.
Table 4. Minimum transmission line losses (MW) with installation TCSC by using WOA
Load increment (%)
Losses Minimum Using WOA
Losses (MW) Size of TCSC (p.u)
0 17.6038 0 100 18.4680 0.0193 200 19.4124 0.0446 300 20.5717 -0.1951 400 21.0475 0.0385 500 24.0182 -0.2387 600 26.3009 -0.3040
4.4. Comparison of results for losses minimization
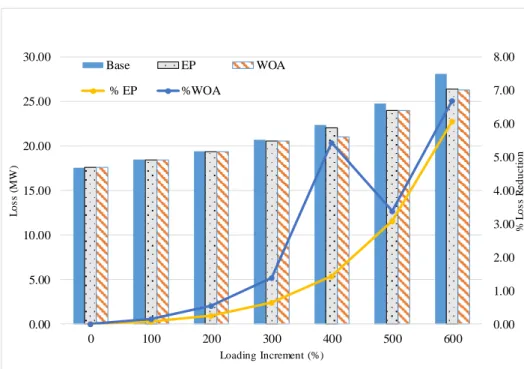
Table 7 and Table tabulates the comparison for both techniques, EP and WOA. As can be observed in Table 7, both results for EP and WOA show improvement in the transmission loss after a single unit FACTS device installation. WOA achieves the highest per cent of reduction which is 6.39% from 28.11MW to 26.31 MW when the loading is at 600%. In most of the cases, WOA outperformed EP and gives higher loss reduction.
Table 7. Comparison between pre-optimization and post-optimization result with both method and for loss minimization
Load increment
(%) Pre-optimization
Post-Optimization Loss Reduction (%)
EP WOA EP WOA 0 17.60 17.60 17.60 0.00 0.00 100 18.48 18.47 18.47 0.07 0.08 200 19.46 19.41 19.40 0.25 0.30 300 20.72 20.59 20.57 0.64 0.73 400 22.37 22.05 21.05 1.44 5.92 500 24.79 24.02 24.02 3.09 3.11 600 28.11 26.40 26.31 6.07 6.39
Figure 6 presents the comparison of results for loss minimization, the results from WOA is slightly better than the EP approach for losses minimization. For the minimum voltage enhancement, it is proven that WOA produces more efficient results than EP.
Figure 6. Transmission line losses comparison for both methods
5. CONCLUSION
This paper presents the application of whale optimization algorithm (WOA) to achieve the transmission loss minimization using thyristor series compensator (TCSC) installation in the IEEE 30-bus RTS. Based on the results, WOA outperformed EP by providing higher percentage of loss reduction after the TCSC installation WOA. This installation can solve the problem of increasing demand in the power system. In the future, other FACTS device such as SVC, UPFC and TCPST can be incorporated to achieve the same objective.
ACKNOWLEDGMENT
The authors would like to acknowledge the Institute of Research Management and Innovation (IRMI), UiTM Shah Alam, Selangor, Malaysia for the financial support of this research. This research is supported by IRMI under BESTARI Research Grant Scheme with project code: 600-IRMI/MYRA 5/3/BESTARI (026/2017).
0.00 1.00 2.00 3.00 4.00 5.00 6.00 7.00 8.00 0.00 5.00 10.00 15.00 20.00 25.00 30.00 0 100 200 300 400 500 600 % L o s s R e d u c ti o n L o s s ( M W ) Loading Increment (%) Base EP WOA % EP %WOA
REFERENCES
[1] N. G. Hingorani, “Power electronics in electric utilities: role of power electronics in future power systems,” Proc. IEEE, vol. 76, no. 4, pp. 481–482, 1988.
[2] I. Musirin and M. M. Othman, “Transmission Loss Minimization Using SVC Based on Particle Swarm Optimization,” pp. 419–424, 2011.
[3] S. Thongkeaw and M. Boonthienthong, “Technique for Voltage Control in Distribution System,” vol. 7, no. 10, pp. 840–843, 2013.
[4] A. R. Bhowmik, “Placement of UPFC for Minimizing Active Power Loss and Total Cost Function by PSO Algorithm,” pp. 217–220.
[5] F. H. Gandoman et al., “Review of FACTS technologies and applications for power quality in smart grids with renewable energy systems,” Renew. Sustain. Energy Rev., vol. 82, no. September 2017, pp. 502–514, 2018. [6] M. S. Kumar, “Bacterial Foraging Algorithm based Enhancement of Voltage Profile and Minimization of Losses
Using Thyristor Controlled Series Capacitor ( TCSC ),” vol. 7, no. 2, pp. 21–27, 2010.
[7] S. N. Singh and A. K. David, “Optimal location of FACTS devices for congestion management,” Electr. Power Syst. Res., vol. 58, no. 2, pp. 71–79, 2001.
[8] R. Selvarasu and M. S. Kalavathi, “UPFC Placement: : A new self adaptive firefly algorithm.”
[9] L. Minimization, “1 &: It ! J Self Adaptive Firefly Algorithm Based Transmission,” pp. 683–688, 2013. [10] L. Angquist and G. Anderson, “No Title,” vol. 12, no. 4, pp. 1629–1634, 1997.
[11] N. R. H. Abdullah, I. Musirin, and M. M. Othman, “Thyristor controlled series compensator planning using evolutionary programming for transmission loss minimization for system under contingencies,” PECon2010 - 2010 IEEE Int. Conf. Power Energy, pp. 18–23, 2010.
[12] K. Sundareswaran, P. S. Nayak, C. D. Venkatesh, and H. B., “Optimal placement of FACTS devices using probabilistic Particle Swarm Optimization,” ISGT2011-India, pp. 53–58, 2011.
[13] S. Mirjalili and A. Lewis, “The Whale Optimization Algorithm,” Adv. Eng. Softw., vol. 95, pp. 51–67, 2016. [14] N. I. Maruf, “Study of Thyristor Controlled Series Capacitor (TCSC) as a Useful Facts Device,” Int. J. Eng. Sci., vol.
2, no. 9, pp. 4357–4360, 2010.
[15] F. Lakdja and F. Z. Gherbi, “Impact of Thyristors Controlled Series Capacitor Devices and Optimal Power Flow on Power Systems,” no. 16, pp. 145–157, 2010.
[16] N. R. H. Abdullah, I. Musirin, and M. M. Othman, “Thyristor controlled series compensator planning using evolutionary programming for transmission loss minimization for system under contingencies,” PECon2010 - 2010 IEEE Int. Conf. Power Energy, no. January, pp. 18–23, 2010.
[17] M. Amroune, “Voltage Stability Limit Enhancement using Thyristor Controlled Series Capacitor ( TCSC ),” vol. 72, no. 20, pp. 46–50, 2013.
[18] P. D. I. Musirin and T. K. A. Rahman, Evolutionary Programming Optimization Technique for Solving Reactive Power Planning in Power System, vol. 2. 2005.