Classifying by Driving Record:
The Safe Driver Insurance Plan
In 1975, the legislature banned age and sex discrim-ination as a basis for setting auto insurance rates. It also instituted the current Safe Driver Insurance Plan (SDIP).19 Under the SDIP system, rates are based more on conditions under a driver's control-i.e., driving record-and less on demographics. Violations and accidents result in point assessments which in turn cause a surcharge on liability rates.
Serious violations, such as hit-and-run driving causing injury or death, bring 12 SDIP points and a 450 percent surcharge. Speeding between 55 and 75 mph results in 2 SDIP points and a 40 percent surcharge. Causing an accident results in either 2 points (over $500 in total damage) or 1 point (under $500); 1 point has a 10 percent surcharge. (See full list of violations, points, and surcharges below.)
Drivers assessed SDIP points have their base rate increased by the SDIP surcharge for
Infractions,
points and surcharges
Here is a list of the infractions for which Safe Driver Insurance Plan points are assessed, and the sur-charges those points carry. Keep in mind that this system
differs from the one the state Transportation Department
uses to determine whether a driver's license should be revoked.
12 points - 450 percent surcharge: Pre-arranged racing or lending a vehicle for pre-arranged racing; hit-and-run driving, causing an injury or death;
manslaugh-ter or negligent homicide from the operation of a motor vehicle.
10 points - 350 percent: Driving while under the influence of alcohol or drugs; driving while impaired; transporting illegal intoxicating liquors by motor vehicle
for the purpose of a sale; highway racing, or lending a motor vehicle for a race.
8 points - 250 percent : Driving with an operator's
license that is suspended or revoked.
4 points - 100 percent : Failing to report an accident; hit-and-run driving, causing property damage; leaving the scene of an accident in which there was property
damage; reckless driving; passing a stopped school bus; speeding over 75 mph.
2 points - 40 percent : Illegal passing; following too
closely; driving on the wrong side of the road; speeding
between 55 mph and 75 mph; accidents involving per-sonal injury or death; causing an accident in which the
total damage exceeds $500 (effective Jan. 1, 1984; before
then it was over $200 to either owned or non-owned
property).
1 point -10 percent : All other moving traffic viola-tions, including speeding, unsafe movements, running red lights and stop signs and improper turning; causing an
accident in which the total damage is under $500 (effective
Jan. 1984; before then it was under $200).
Zero points: Speeding less than 10 mph over the speed limit, provided the citation did not occur in a school
zone and the driver had no previous moving traffic viola-tions in the previous three years; driving with an inade-quate muffler; improper lights or equipment; failing to have an operator's license in possession if a valid one
exists; failing to display the current inspection sticker. Reprinted by permission of United Press International.
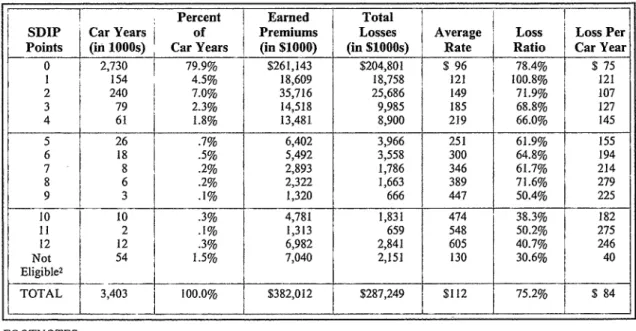
Table 3. Liability Insurance Experience in North Carolina, 1982'
SDIP Points
Percent Earned
Car Years of Premiums
(in 1000s) Car Years (in $1000)
Total Losses (in $1000s) Average Loss Rate Ratio Loss Per Car Year 0 2,730 79.9% $261,143 $204,801 $ 96 78.4% $ 75 1 154 4.5% 18,609 18,758 121 100.8% 121 2 240 7.0% 35,716 25,686 149 71.9% 107 3 79 2.3% 14,518 9,985 185 68.8% 127 4 61 I 1.8% 13,481 8,900 219 66.0% 145 5 26 .7% 6,402 3,966 251 61.9% 155 6 18 .5% 5,492 3,558 300 64.8% 194 7 8 .2% 2,893 1,786 346 61.7% 214 8 6 .2% 2,322 1,663 389 71.6% 279 9 3 .1% 1,320 666 447 50.4% 225 10 10 .3% 4,781 1,831 474 38.3% 182 11 2 .1% 1,313 659 548 50.2% 275 12 12 .3% 6,982 2,841 605 40.7% 246 Not Eligible2 54 1.5% 7,040 2,151 130 30.6% 40 TOTAL 3,403 100.0% $382,012 $287,249 $112 75.2% $ 84 FOOTNOTES
I Calculations were done before rounding, so some small variations might appear.
2"Not eligible " refers to non-fleet private passenger cars owned by partnerships or corporations.
Source: N.C. Rate Bureau (data on car years, premiums, and losses). Other calculations and table design by Steve Adams for North Carolina Insight.
three years. Moreover, the resulting rates are multiplied by a surcharge to offset losses incurred by the Reinsurance Facility and to subsidize "clean risks" in the facility. In 1984, this sur-charge-which all drivers with SDIP points must pay-was 27.2 percent.20
Many of the drivers for whom the system was designed are not paying the consequences. According to a six-month study by UPI reporter Craig Webb, insurance companies assess only 39 percent of SDIP points that should be assessed (see sidebar on page 44). Even if this figure is understated by 10 or 20 percentage points-and there is no reason to believe that it is-the SDIP system has a major flaw.
Most of the missing SDIP points may simply fall through the cracks. There is no law or regulation requiring drivers to report convictions, as they must report accidents. In addition, the Division of Motor Vehicles charges insurance companies, like anyone else, $4 for a copy of a driver's record. Most companies apparently find that it is not cost-effective to check. And, despite the reporting requirement, insurance companies also appear to miss some accidents. "It's an even bigger problem chasing down [unreported] acci-dents than violations," says Aetna's Seagle.
While the primary problem may be the lack of an adequate reporting system, the SDIP system also breeds two kinds of cheating. Drivers with SDIP points might register their car in someone else's name but still drive the car regularly. (Remember, insurance technically covers a car, not a driver.) Secondly, while the Division of Motor Vehicles does maintain records of convictions, drivers legally do not have to report violations (unlike accidents) to insurance companies.
"Consumers realize through conversations with an agent that if they go elsewhere and don't tell about their violations, they're not going to be charged those extra two points," says Commis-sioner Long. "You do have cheating within the system."
Working with those SDIP points that were assessed, other important problems appear. In 1982, four of every five cars were assigned 0 SDIP points, according to the N.C. Rate Bureau. These cars caused 71 percent of all liability losses paid by insurers that year. Drivers with points, who did cause more losses per car, were respon-sible for only 29 percent of total losses. Table 3 summarizes the 1982 liability data, the latest available.
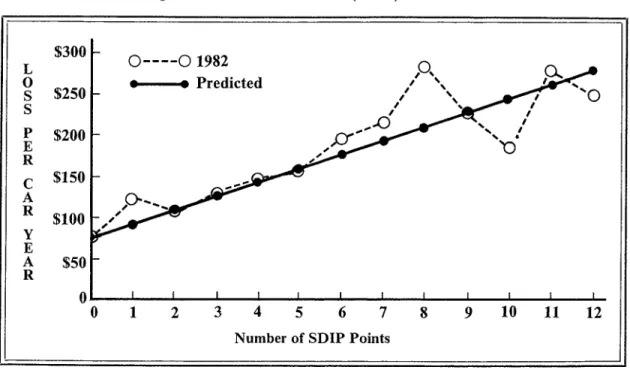
Figure 1. Loss Per Car Year-1982 (Actual) and Predicted
$300
LS
$250
$100
S
P
$200
E RC
$150
A
Q.--R
Y EA
$50
R,O,
%.-O
0
0
1
2
3
4
5
6
7
8
O----01982
* ---
Predicted
Number of SDIP Points
9
10
11
12
Table 4. Losses Per Car Year, Rates , and Surcharges -1982 and Predicted Levels, by SDIP Category'
- - - -- - -
--AVERAGE LOSS
-- - - --- --; - - --
-SDIP PER CAR YEAR AVERAGE RATE SDIP SURCHARGE
POINTS 1982 Predicted2 1982 Predicted3 1982 4 Predicteds
0 $ 75 $ 76 $ 96 $102 1.00 1.00 1 2 3 121 93 121 124 1.10 1.22 107 109 149 146 1.40 1.43 127 126 185 168 1.70 1.65 4 145 5 155 6 194 7 214 8 279 9 225 10 182 II 275 12 246 143 159 176 192 209 225 242 258 275 219 190 2.00 1.87 251 212 2.30 2.08 300 234 2.70 2.30 346 256 3.10 2.51 389 277 3.50 2.73 447 299 4.00 2.95 474 321 4.50 3.16 548 343 5.00 3.38 605 365 5.50 3.60 FOOTNOTES
Calculations were performed before rounding , so some small variations might appear. 2Data from linear regression analysis shown in Figure 1.
3Data calculated like this : a x b = c Key: "a" - predicted rate
a = c/b "b" - .752 (loss ratio for all drivers in 1982) "c" - predicted loss per car (from Figure 1)
4The surcharge is expressed as the base premium (1.00) plus the surcharge percent for each SDIP group. For example, the surcharge for 8 points is 1.00 plus 2.50 (8 points carries a 250 percent surcharge), or 3.50.
SData calculated like this: a x b = c Key: "a" - predicted surcharge
a = c/b "b" - predicted rate for 0 SDIP points ($100) "c" - predicted rate for each SDIP category
(from calculation above)
continued from p. 42
The SDIP system, in theory, groups drivers according to the losses an insurer expects them to cause. Drivers with 5 SDIP points, for example, are expected to cause more losses than drivers with 0 points-hence, the 230 percentage sur-charge for drivers with 5 points. For this sursur-charge
to be fair, the ratemaking system must accurately relate future losses to SDIP points. In examining the SDIP system, the best measurement of fairness is what the industry calls the loss-ratio
figure.
In 1982, the average loss ratio for all drivers was 75.2 percent (see Table 3). Put simply,
Und erassess m ent of S DIP
Po ints Wi despr ead
Auto
Insurance
Craig Webb of United Press Interna-tional reported in January 1984 that insurance companies assessed only 39 percent of the SDIP points that should have been assessed. Webb's investigation took six months. The results appeared as a five-part series in news-papers throughout North Carolina.
Insurance carriers file with the N.C. Rate Bureau the SDIP data for their policies. The
court system and law enforcement officials
report all traffic convictions and accidents to the N.C. Division of Motor Vehicles (DMV). Webb compared aggregate SDIP data from the Rate Bureau for FY 1982 with aggregate violation/ accident data from DMV for the three preceding years (remember that SDIP
points affect premiums for three years). Of a
total of 4,502,365 points that might have been assessed, insurance companies assessed only 1,761,305 points, or 39 percent.'
To obtain an individual's driving record, an insurance company or agent must request a Motor Vehicle Record check (MVR) and must pay $4 for each MVR form. In interviews with the 10 largest auto insurance carriers in the state, Webb found that only three checked a driver's record at least once a year. (Policies are often renewed semi-annually.) The other seven checked no more than every other year. (See list of top 10 insurers on page 32.)
The reason is money and convenience. Paying $4 for each individual's record (plus the cost of ordering and reviewing the receipt) could cost more than the increased revenues the companies would earn for catching points that had not been reported, says Paul Mize, general manager of the Rate Bureau and the Reinsurance Facility. Further, insurance companies transfer the policies of most driv-ers with bad records to the facility - the premiums as well as the policies. For reinsured
drivers, a company would not benefit directly from increased premiums for additional SDIP points even if it did profit from checking driving records of policies in the voluntary market.
Regarding reinsured policies, an insurer must obtain an individual's driving record from the Division of Motor Vehicles when first ceding that driver's policy to the facility. As long as that policy is written and ceded to the facility, the insurer must obtain the driving record from DMV at least once a year.
The state-approved driver classification system depends heavily on the SDIP points, yet DMV does not supply this information to insurance companies on an efficient or cost-effective basis. State policies conflict here. Two specific problems need attention, and neither involves a major tinkering with the ratemaking system: the cost and the method of getting the accident/ violation information to the insurance companies.
The cost of each driving record was $1 until the legislature raised the fee to$3 in 1981 and $4 in 1983. "The $4 fee is there because the
companies paid out an average of 75.2 cents in claims and related expenses for every dollar of premiums collected. (Another way to think of a loss ratio, from a consumer's point of view, is a "payback ratio"-i.e., measuring the ratio in terms of what is "paid back" to the consumer, not "lost" by the insurer. The following discussion
Highway Fund was short of funds several years ago," says Commissioner Long, who in 1981 was legislative counsel to the Speaker of the House. "The actual cost of processing [a driver's record at DMV] is in the range of 60 to 70 cents."
The cost is as much a deterrent to the agents as it is to insurance companies. "Some companies have started requiring the agents to furnish the form to them, and if it is fur-nished, to pay for it," Long continues. "The agents are making a commission of 15 to 18 percent on a policy, and $4 off that leaves little margin. The agents aren't going to spend the $4 and the companies aren't going to spend $4, so no one is checking your violations when you write or renew your policy."
Various steps might alleviate these problems:
• reduce the fee back to $1 (at a cost of $9 million per year to the Highway Fund, according to the legislature's Fiscal Research Division);
• require by statute that an agent or company must have the MVR form to renew a policy;
• mandate DMV to report driving records en masse to insurance companies;
• change the law to require drivers to report violations as well as accidents with some specific punishment for commiting fraud (this change would not require an elabo-rate computer reporting system);2 or
• require clerks of court to send a notice of all guilty pleas or convictions for violations and prayers for judgment continued to insur-ance carriers, with the cost of the notice included in court costs rather than going to insurance companies.3
Commissioner Long, while recognizing these problems, is not ready to propose a solu-tion. "It's going to be some time before we determine what is the best system for rating
uses the standard industry terminology, but "payback ratio " could be substituted for "loss ratio. ")
Comparing the loss ratio at each SDIP level with 75.2 percent shows whether average rates were fair . If a loss ratio for an SDIP group is
lower than the average , then the insurance
t
auto insurance in North Carolina. Then we'll address the problem of that $4 form versus the $1 form and who has to pay for it. Instead of worrying about the detail of the MVR form, let's back off and look at the entire system."
FOOTNOTES
'The number of points that might have been assessed could be overstated somewhat. Webb's methodology did not take into account, for example, the convicted drivers who had since died or moved away from North Carolina,
those drivers who did not regularly drive an individually owned non-fleet private passenger car, those under long-term driver license suspension or revocation, or those in prison. But Webb did, in his methodology, take the conservative method of calculation in several instances. For example, Webb assigned all speeding convictions the lowest possible SDIP point assessment, even though speeding can count anywhere from 1 to 4 points.
2Webb found that 90 percent of the points that should have been assigned were from violations (4.1 million points), which are not mandatory to report to an insurer. Only 10 percent of the points that should have been reported came from accidents (443,000).
3This system would not pick up out-of state viola-tions, but presumably that is arelatively small proportion of the violations.
companies made more money than average on that group of drivers.
For groups with 2 or more SDIP points, the loss ratio generally declined as the number of points increased.21 This means 1) drivers with high SDIP points paid excessive rates, and 2) the insurance industry made more money on drivers with poor records than on those with good records-even before facility surcharges. Groups with 2 or more points had loss ratios below the average; these drivers paid too much for liability coverage, in relation to other SDIP groups. Drivers with 0 points had a loss ratio of 78.4 percent, near the overall average of 75.2 percent; relative to other groups, their rates were about right. Drivers with I point had a loss ratio of 100.8 percent, considerably over the average; their rates were too low, relative to other SDIP groups.
The data in Table 3 incorporates rate vari-ations from territories, driver experience, car use, policies ceded to the Reinsurance Facility, and of course, SDIP points. These figures do not, however, include the recoupment surcharge assessed against all drivers with SDIP points to offset losses incurred by the Reinsurance Facility. Adding this surcharge to the calculations would make the rates for drivers with SDIP points even more excessive.
Table 3 is a snapshot of a past year's liability activity. In setting the odds on individual policies, however, insurance underwriters try to anticipate future losses. One way to determine whether SDIP points predict future claims is to apply what statisticians call a "linear regression anal-ysis." This, in short, straightens out the jagged line of actual experience and determines the level of correlation, in this case between SDIP cate-gories and loss per car year.22 Applying a regres-sion formula to the loss-per-car data in Table 3 results in a projection of anticipated or predicted
losses. In Figure 1, the straight line connects the predicted losses; the jagged line shows actual
1982 losses.
In Table 3, rates appeared excessive for persons with a high number of SDIP points because the loss ratio declined as the SDIP points increased. Using the 1982 average loss ratio for all drivers, 75.2 percent, Table 4 shows
how excessive rates and surcharges were-if no other part of the ratemaking system were changed. Table 4 shows average rates and sur-charges that would have been fair for each SDIP category.
Predicted Rates. In 1982, drivers with 0 and 1 points paid slightly under what would have been fair ($96 rather than $102, $121 rather than $124, respectively). But drivers with 2 points or
more paid too much. The more points, the more excessive was the rate. People with 12 points paid $605, a rate of $365 would have been fair-a difference of 66 percent.
Predicted Surcharges . Drivers with I or 2 points had too low a surcharge (1.1 rather than 1.22, 1.4 rather than 1.43, respectively). But the drivers with 3 or more points had too high a surcharge. Drivers with 10 points, for example, would have paid a fair amount with a surcharge of 3.16 rather than 4.50. Given those findings about the current SDIP system, most surcharges should be reduced.
In 1983, the N.C. Rate Bureau proposed that the commissioner reduce surcharges for high SDIP points. The bureau's calculations, like the tables included here, showed that drivers with a high number of points paid more than the loss ratio indicated they should. The bureau's proposals fell below the reductions indicated on Table 4. For example, the bureau proposed that the maximum surcharge be lowered from 450 percent to 400 percent. Commissioner Ingram rejected the bureau's proposal, however.
Tables 3 and 4, along with the Rate Bureau proposal of 1983, show that drivers with high SDIP points generally pay excessive rates. More importantly, perhaps, the SDIP system has gradually evolved from a way of anticipating losses for ratemaking purposes to a means of punishing drivers for violations or accidents through insurance rates. This system of penalizing drivers with SDIP points for three years goes against all the studies about past accidents and violations as predictors of future accidents.
The Highway Safety Research Center at the University of North Carolina, for example, found that "a majority of accidents are sustained by a majority of drivers .... [E]ven among so called `high-risk' drivers, a very significant proportion of them have no future accidents." The study concludes that "if a very stringent suppressive program were brought to bear on drivers with a violation record ... the majority of this group are drivers who in fact would have clean accident records in the future."23
If the surcharges were lowered, the SDIP system could again play the purpose for which it was designed-to anticipate losses based on driving record rather than on demographics. But even if the surcharges were lowered, the Rate Bureau would still make rate filings based on the critical loss-ratio figure.
The calculations in Tables 3 and 4 hinge on using a 75 percent average loss ratio for all drivers. Does a 75 percent loss ratio provide the auto industry with a reasonable profit? Or does such a loss ratio result in excessive rates?