This is the author’s version of a work that was submitted/accepted for
pub-lication in the following source:
Xie, Jie
,
Towsey, Michael
,
Zhang, Jinglan
,
Dong, Xueyan
, &
Roe, Paul
(2015)
Application of image processing techniques for frog call classification. In
Proceedings of the 2015 International Conference on Image Processing
(ICIP)
, IEEE, Québec City, Canada, pp. 4190-4194.
This file was downloaded from:
http://eprints.qut.edu.au/89676/
c
Copyright 2015 IEEE
Personal use of this material is permitted. Permission from IEEE must be obtained for all other uses, in any current or future media, including reprinting/republishing this material for advertising or promotional purposes, creating new collective works, for resale or redis-tribution to servers or lists, or reuse of any copyrighted component of this work in other works.
Notice
:
Changes introduced as a result of publishing processes such as
copy-editing and formatting may not be reflected in this document. For a
definitive version of this work, please refer to the published source:
APPLICATION OF IMAGE PROCESSING TECHNIQUES FOR FROG CALL
CLASSIFICATION
ABSTRACT
Frogs have received increasingly attention due to their effectiveness for indicating the environment change [1]. Therefore, it is important to monitor and assess frogs. With the development of sensor techniques, large volumes of audio data are generated for analysing frogs. After transforming the 1-D audio signal to its 2-D representation, the visual inspection of the representation motivates us to use image processing techniques for classifying frog calls. In this study, the 2-D representation (spectrogram) is generated by applying short-time Fourier transform (STFT) to the 1-D audio signal. Acoustic events are segmented for improving the classification accuracy and reducing calculation burden. Then, ridges are extracted from each isolated acoustic event. Three feature sets, MFCCs, feature sets extracted from AED results and ridges, are used for the frog call classification with a support vector machine (SVM) classifier. Fifteen anuran species widely spread in Queensland, Australian, are selected to evaluate the proposed method. The experiment results show that ridge based features can achieve an average classification accuracy of 80.32% which outperforms the MFCCs (41.9%) and AED related features (72.8%).
Index Terms—frog call classification, acoustic event detection, ridge detection, support vector machine
1. INTRODUCTION
It is widely known that the environment health situation will directly or indirectly affect the animal distribution[2]. Therefore, the animal distribution can be used to reflect the environment health. Recently, due to the development of sensor techniques, large volumes of acoustic data (animal calls) are collected. Studying acoustic data to monitor and assess environment health has been widely used [3].
Frogs are widely used as bio-indicators for the following reasons: (1) Frogs require suitable habitat in both terrestrial and aquatic environments. (2) Frogs are near the top of the food chain. (3) Frogs can absorb toxic chemicals easily due to their permeable skin. Due to this important character of frogs, several papers have already described
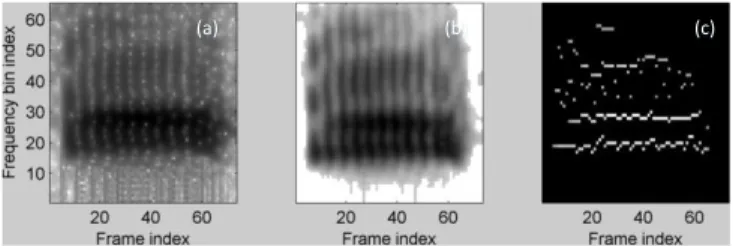
(a) (b) (c)
Figure 1: The spectrogram results of ridge detection, (a) spectrogram, (b) after noise reduction, (c) after ridge
detection
automated methods for detection and classification of frog calls [4-8]. Almost all prior work adopts the following structure: (1) syllable segmentation, (2) feature extraction, (3) classification. For syllable segmentation, one method is based on the analysis of frog call energy[6, 9]. The assumption of this method is that the frame energy within frog calls is higher than other parts of the recordings. Syllable segmentation based on the amplitude-frequency change is another widely used method [4, 8]. However both methods cannot be followed for the recordings containing overlapping vocal events. After syllable segmentation, acoustic features are extracted to characterise syllables for the classification. Linear predictive coding (LPC) and Mel-frequency cepstral coefficients (MFCCs) are two well-known parameters for analysing frog calls [10, 11]. Both LPC and MFCCs describe individual frames of the syllables. To characterise the syllable as a whole, all frame-level features of one syllable are averaged [8]. Time-frequency features are also widely used for describing syllables, including dominant frequency, maximum frequency, minimum frequency, syllable duration, syllable energy, zero-crossing rate, spectral flux [5, 7, 10]. Classification is the next step after feature extraction. Many classifiers have been applied the frog species classification that include linear discriminant analysis, k-nearest neighbour, support vector machines, decision tree [5-8].
Inspired by the inspection of the spectrogram image, applying image processing technique to analyse animal calls has attracted increasingly attention recently. In this paper, the audio signal is first transformed from waveform to spectrogram using STFT. Then, acoustic event detection
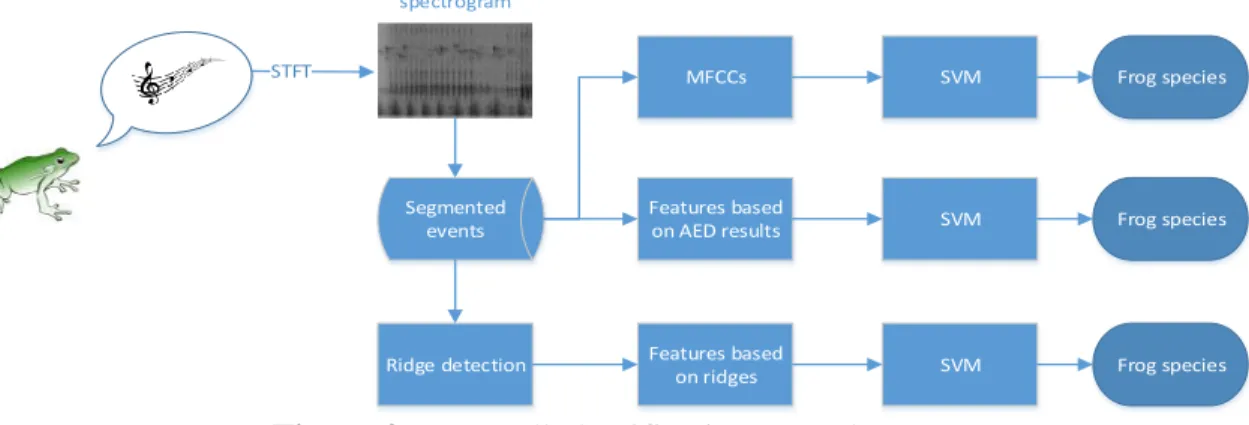
Segmented events Ridge detection Frog species STFT Features based on ridges spectrogram SVM MFCCs Features based on AED results SVM SVM Frog species Frog species 文本
Figure 2:
Frog call classification procedure.
(AED) is applied for isolating the individual event from which ridges are detected. A feature vector is constructed based on the ridges with a SVM classifier for classification. The experimental results show the success of applying image processing techniques for classifying the audio data.
This remainder of this paper is organized as follows: Section 2 describes the materials and methods. Section 3 reports the experiment results and discussions. The conclusion and future work are offered in section 4.
2. MATERIALS AND METHODS
The method for the classification in this study consists of six steps which are shown in Figure 2: (1) data sets acquisition, (2) pre-processing, (3) acoustic event detection, (4) ridge detection, (5) feature extraction, (6) classification.
2.1. Data sets and pre-processing
In this study, 15 frog species which are widespread in Queensland, Australia are selected for experiments (Table 1), which are obtained from David Stewart’s CD (http://www.naturesound.com.au/cd_frogsSE.htm). All the recordings have a sample rate of 44.1 kHz, and mix-down to mono. All frog species contain 30 syllables individually except three due to the lack of recordings. All dataset were divided into two subsections, reserving 30% for training and the rest for testing.
For generating the spectrogram, we apply short-time Fourier transform (STFT) to the recordings (window size = 256 frames, window overlap = 0.85). The generated spectrogram has 128 frequency bins, each spanning 86.13 Hz. One frame spans 0.86 ms. The intensity values in the spectrogram is converted to decibels (dB) using , where is the intensity value.
2.2. Acoustic event detection
Acoustic event detection (AED) aims to identify both time and frequency boundary of the acoustic events. In this study, one efficient method derived from [12] is used for detecting the acoustic events. Image processing techniques are applied for detecting acoustic events. In particular, a Wiener filter is first applied to the spectrogram image for removing the back ground graininess [12]. For enhancing the interested signal and improving AED results, noise
reduction is the next step. The noise power model of each frequency bin is estimated using a modified method from the adaptive level equalisation algorithm [12]. To further reduce the noise level and remove the small gaps within one acoustic event, a Gaussian kernel is used to convolve the noise reduced spectrogram for producing a smoothed spectrogram. In the next step, different from Michael’s original method, we use an adaptive thresholding method named Otsu thresholding to convert the smoothed spectrogram into binary spectrogram [13]. Morphological clean-up operations, re-joining broken events and identifying acoustic events are then applied in the following step. At last, two adaptive threshold, and , are
used to separate incorrectly joined events and removing small events [12]. The results after applying the AED method are showed in Figure 3.
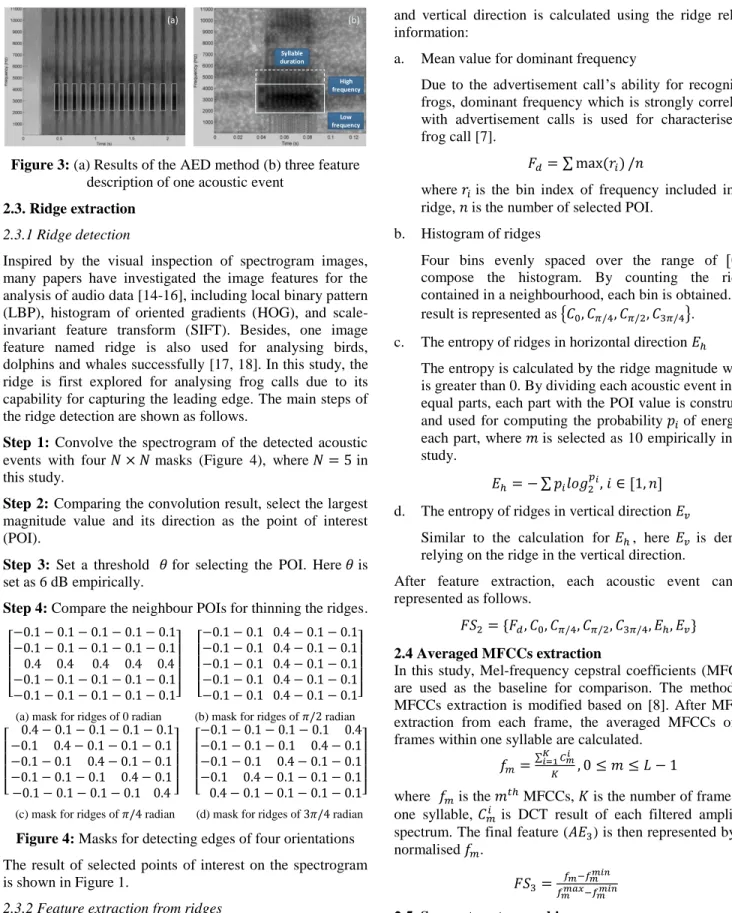
Based on the AED results, three features used for this study are low frequency ( ), high frequency ( ), and time duration . Therefore, each acoustic event can be represented as { }.
Table 1: Summary of the frog scientific name, common name, and corresponding code
No. Scientific name Total
syllables
Code
1 Assa darlingtoni 30 ADI
2 Crinia parinsignifera 30 CPA
3 Litoria caerulea 30 LCA
4 Litoria latopalmata 30 LLA
5 Litoria nasuta 30 LNA
6 Litoria revelata 30 LEA
7 Litoria rubella 30 LRA
8 Limnodynastes tasmaniensis 30 LSI
9 Limnodynastes terraereginae 30 LTI
10 Mixophyes fasciolatus 30 MFS
11 Mixophyes fleayi 28 MFI
12 Neobatrachus sudelli 30 NSI
13 Philoria kundagungan 22 PKN
14 Uperoleia fusca 30 UFA
High frequency Low frequency Syllable duration (a) (b)
Figure 3: (a) Results of the AED method (b) three feature description of one acoustic event
2.3. Ridge extraction
2.3.1 Ridge detection
Inspired by the visual inspection of spectrogram images, many papers have investigated the image features for the analysis of audio data [14-16], including local binary pattern (LBP), histogram of oriented gradients (HOG), and scale-invariant feature transform (SIFT). Besides, one image feature named ridge is also used for analysing birds, dolphins and whales successfully [17, 18]. In this study, the ridge is first explored for analysing frog calls due to its capability for capturing the leading edge. The main steps of the ridge detection are shown as follows.
Step 1: Convolve the spectrogram of the detected acoustic events with four masks (Figure 4), where in this study.
Step 2: Comparing the convolution result, select the largest magnitude value and its direction as the point of interest (POI).
Step 3: Set a threshold for selecting the POI. Here is set as 6 dB empirically.
Step 4: Compare the neighbour POIs for thinning the ridges.
[ ] [ ]
(a) mask for ridges of 0 radian (b) mask for ridges of radian
[ ] [ ]
(c) mask for ridges of radian (d) mask for ridges of radian
Figure 4: Masks for detecting edges of four orientations The result of selected points of interest on the spectrogram is shown in Figure 1.
2.3.2 Feature extraction from ridges
To characterise the frog call for classification, a feature vector including mean value for dominant frequency, histogram of ridges, and the entropy of ridges in horizontal
and vertical direction is calculated using the ridge related information:
a. Mean value for dominant frequency
Due to the advertisement call’s ability for recognising frogs, dominant frequency which is strongly correlated with advertisement calls is used for characterise the frog call [7].
∑ (1) where is the bin index of frequency included in the ridge, is the number of selected POI.
b. Histogram of ridges
Four bins evenly spaced over the range of compose the histogram. By counting the ridges contained in a neighbourhood, each bin is obtained. The result is represented as { }.
c. The entropy of ridges in horizontal direction
The entropy is calculated by the ridge magnitude which is greater than 0. By dividing each acoustic event into m equal parts, each part with the POI value is constructed and used for computing the probability of energy in each part, where is selected as 10 empirically in this study.
∑ (2) d. The entropy of ridges in vertical direction
Similar to the calculation for , here is derived relying on the ridge in the vertical direction.
After feature extraction, each acoustic event can be represented as follows.
{ } (3)
2.4 Averaged MFCCs extraction
In this study, Mel-frequency cepstral coefficients (MFCCs) are used as the baseline for comparison. The method for MFCCs extraction is modified based on [8]. After MFCCs extraction from each frame, the averaged MFCCs of all frames within one syllable are calculated.
∑
(4) where is the MFCCs, is the number of frames for one syllable, is DCT result of each filtered amplitude spectrum. The final feature ( ) is then represented by the normalised .
(5) 2.5. Support vector machine
Support vector machine (SVM) has been widely used for classifying animal sounds due to the high accuracy and
superior generalization properties [4, 19]. For the proposed method, the feature vector obtained by subsection 2 is first selected as the training data. Then, the pairs are constructed using the selected training data, where is the number of frog call in the training data, is the feature vector obtained from the -th frog call in the training data, and is the frog species. In the classification stage, the decision function for the classification problems is defined by:
∑ (6)
where is the kernel function whose kernel is Gaussian, is the Lagrange multiplier, and is the constant value.
3. RESULTS AND DISCUSSION
In this experiment, the SVM classifier is used to learn a model on the training examples with 10-fold cross-validation. For evaluating the robustness of proposed feature vectors, the SVM is run 10 times for each classification task. The classification accuracy is defined as follows:
(7) where is the number of syllables that classified correctly,
and is the total number of syllables.
Since all three feature sets are extracted based on the AED result in this experiment, the accuracy of AED result will affect the classification accuracy directly. If one detected acoustic event meets the following rule, it will be regarded as correct detection.
(8)
where is the overlapped duration between detected
event and labelled duration, is the duration of labelled events. The accuracy result is shown in Figure 4.
Figure 4: Accuracy of AED results
The SVM classifier is used with three feature sets: MFCCs, AED related features, and ridge related features. The average classification accuracy result for the three feature sets are shown in Table 2. The classification accuracy obtained by is 72.84%; however with ridge related feature , the classification accuracy has an improvement of 7.48%. The detailed classification accuracy
Table 2: Classification accuracy of three feature sets, is the AED related feature, is ridge related feature
Feature sets Classification accuracy
MFCCs
information of individual frog species is shown in Figure 5. The best classification accuracy is obtained by Assa darlingtoni, Litoria latopalmata, and Mixophyes fleayi
which is 100%. However the classification accuracy of
Neobatrachus sudelli is 34.68%, because of its unclear ridge structure. This classification accuracy is calculated based on the assumption that the acoustic events are detected by the AED method with 100% accuracy. After we add a weighting to the classification result, the final classification accuracy is 74.73%.
Figure 5: Classification accuracy of each frog species with best feature set
4. CONCLUSION AND FUTURE WORK In this paper, we explored the image processing techniques (AED and ridge detection) for classifying audio data. To achieve this goal, the audio data was first transformed to spectrogram by STFT, and each acoustic event is isolated by the AED method. For each acoustic event, the ridge was detected. Three feature sets were extracted from AED results and ridges separately. Finally, a SVM classifier was used for the classification of frog calls. Results show the effectiveness of the image processing techniques for classifying audio data. In the future, we will focus on more frog species.
5. REFERENCES
[1] Opdam, P. and D. Wascher, Climate change meets habitat fragmentation: linking landscape and biogeographical scale levels in research and conservation. Biological conservation, 2004. 117(3): p. 285-297.
[2] Hofmeister, E., et al., Climate Change and Wildlife Health: Direct and Indirect Effects. 2010: US Department of the Interior, US Geological Survey.
[3] Wimmer, J., et al. Scaling Acoustic Data Analysis through Collaboration and Automation. in e-Science (e-Science), 2010 IEEE Sixth International Conference on. 2010.
[4] Huang, C.-J., et al., Frog classification using machine learning techniques. Expert Systems with Applications, 2009. 36(2): p. 3737-3743.
[5] Han, N.C., S.V. Muniandy, and J. Dayou, Acoustic classification of Australian anurans based on hybrid spectral-entropy approach. Applied Acoustics, 2011. 72(9): p. 639-645. [6] Chen, W.-P., et al., Automatic recognition of frog calls using a multi-stage average spectrum. Computers & Mathematics with Applications, 2012. 64(5): p. 1270-1281.
[7] Gingras, B. and W.T. Fitch, A three-parameter model for classifying anurans into four genera based on advertisement calls. The Journal of the Acoustical Society of America, 2013. 133(1): p. 547-559.
[8] Lee, C.-H., et al., Automatic recognition of animal vocalizations using averaged MFCC and linear discriminant analysis. Pattern Recognition Letters, 2006. 27(2): p. 93-101. [9] Croker, B. and N. Kottege, Using feature vectors to detect frog calls in wireless sensor networks. The Journal of the Acoustical Society of America, 2012. 131(5): p. EL400-EL405.
[10] Bedoya, C., et al., Automatic recognition of anuran species based on syllable identification. Ecological Informatics, 2014. 24: p. 200-209.
[11] Ting Yuan, C. and D. Athiar Ramli, Frog Sound Identification System for Frog Species Recognition, in Context-Aware Systems and Applications, P. Vinh, et al., Editors. 2013, Springer Berlin Heidelberg. p. 41-50.
[12] Towsey, M.W. and B. Planitz, Technical Report: Acoustic analysis of the natural environment. 2010.
[13] Otsu, N., A threshold selection method from gray-level histograms. Automatica, 1975. 11(285-296): p. 23-27.
[14] Dennis, J., H.D. Tran, and H. Li, Spectrogram image feature for sound event classification in mismatched conditions. Signal Processing Letters, IEEE, 2011. 18(2): p. 130-133.
[15] Esfahanian, M., H. Zhuang, and N. Erdol, Using local binary patterns as features for classification of dolphin calls. The Journal of the Acoustical Society of America, 2013. 134(1): p. EL105-EL111.
[16] Muthamizh Selvan, A. and R. Rajesh, Spectral histogram of oriented gradients (SHOGs) for Tamil language male/female speaker classification. International Journal of Speech Technology, 2012. 15(2): p. 259-264.
[17] Dong, X., et al. A Novel Representation of Bioacoustic Events for Content-Based Search in Field Audio Data. in Digital Image Computing: Techniques and Applications (DICTA), 2013 International Conference on. 2013. IEEE.
[18] Kershenbaum, A. and M.A. Roch, An image processing based paradigm for the extraction of tonal sounds in cetacean communications. The Journal of the Acoustical Society of America, 2013. 134(6): p. 4435-4445.
[19] Acevedo, M.A., et al., Automated classification of bird and amphibian calls using machine learning: A comparison of methods. Ecological Informatics, 2009. 4(4): p. 206-214.